



















The United Kingdom has cemented its position as Europe's most mature, most investable, and most structurally complex energy storage market. As of August 2026, the UK energy storage market has reached a cumulative installed capacity of 12.7 GW, with grid-scale battery energy storage system (BESS) additions growing 45% year-on-year in 2025 — approximately 4 GWh of new capacity — bringing total operational capacity to 12.9 GWh. Projections indicate the market will expand to 58.8 GW by 2034, representing a compound annual growth rate (CAGR) of 18.03%.
Yet beneath these headline figures lies a market in the throes of fundamental transformation. The era of easy frequency response revenue is over. The grid connection queue — once bloated beyond 800 GW of speculative projects — is being aggressively rationalised through the "Ready to Connect" reforms. Capacity market clearing prices have collapsed from £75/kW to £5/kW. And commercial & industrial (C&I) customers now face a landscape where success depends not on access to capital alone, but on the sophistication of revenue modelling, technical differentiation, and the ability to navigate an increasingly complex regulatory environment.
For solar PV integrators, EPC contractors, energy managers, and C&I end-users, the questions are no longer whether to deploy storage, but how to deploy it profitably, which technology platforms to standardise on, and what revenue strategies will remain viable over a 15-year asset life.
This guide — prepared by the market intelligence desk at MateSolar — provides a comprehensive, data-driven analysis of the UK commercial and industrial energy storage market as it stands in August 2026. It addresses nine critical challenges facing the industry, provides actionable frameworks for decision-making, includes technical specification tables for currently available outdoor cabinet and containerised solutions, and offers answers to the most frequently asked questions from professionals across the photovoltaic and energy storage value chain.
Table of Contents
1. The UK C&I Storage Market in August 2026: State of Play
2. Policy and Regulatory Environment: The Five Forces Reshaping the Market
3. Recent Project Deployments: What Success Looks Like in 2026
4. The Nine Critical Problems Facing C&I Storage Customers — And How to Solve Them
5. Technical Product Matrix: Outdoor Cabinets and Containerised Systems
6. Frequently Asked Questions
7. Conclusion: The Path Forward for UK C&I Storage
1. The UK C&I Storage Market in August 2026: State of Play
1.1 Market Scale and Trajectory
The United Kingdom's energy storage market has transitioned decisively from its infancy into a phase characterised by scale, structural reform, and financial maturation. Total installed storage capacity of 12.7 GW places the UK ahead of every European peer in absolute terms, with only Germany approaching comparable levels of market development. The 45% year-on-year growth in grid-scale BESS capacity during 2025 — adding approximately 4 GWh — underscores the pace of deployment now underway.
The forward trajectory is equally striking. The UK market is forecast to reach 58.8 GW by 2034, a figure that encompasses grid-scale, distribution-connected, and behind-the-meter (BTM) assets. This represents a 4.6x expansion over the coming decade, driven by four concurrent forces:
1. The Clean Power 2030 mandate requiring 23–27 GW of grid-scale battery capacity by 2030
2. Electrification of heat and transport creating new demand profiles that storage must serve
3. Corporate net-zero commitments driving behind-the-meter deployment across the C&I sector
4. The retirement of legacy thermal generation creating structural wholesale price volatility that storage can monetise
Within this broader market, the commercial and industrial (C&I) segment represents one of the most dynamic and fastest-growing sub-sectors. Annual C&I storage deployment is projected to grow from approximately 1 GWh per year in 2026 to between 5–8 GWh per year by 2035. This growth is underpinned by the electrification of industrial heat processes, the rapid expansion of commercial electric vehicle charging infrastructure, and corporate commitments to net-zero operations that increasingly require on-site flexibility assets.
The BTM stationary storage market — which includes all storage deployed behind customer meters for self-consumption optimisation, demand charge reduction, and resilience — is projected to reach an installed system value of £18–22 billion in 2026, expanding to £65–85 billion by 2035. This represents one of the most significant value creation opportunities in the European energy sector.
1.2 The Core Structural Tension: Supply-Demand Mismatch
Despite the impressive headline figures, the UK storage market in August 2026 is defined by a fundamental tension that distinguishes it from comparable markets in Germany or Texas: a profound mismatch between the volume of projects seeking connection and the actual demand for flexibility services.
The grid connection queue — the pipeline of projects awaiting transmission or distribution network connections — has historically been characterised by a "first come, first served" approach that encouraged speculative applications with minimal commitment. This resulted in a queue exceeding 800 GW of proposed capacity, the vast majority of which had no realistic prospect of reaching financial close or construction.
The reform of this queue — detailed extensively in Section 2 — has reduced the active pipeline dramatically. As of June 10, 2026, the National Energy System Operator (NESO) has issued connection offers to 713 projects covering 37 GW of new renewable and BESS capacity. This represents 58% of the projects in the pre-2030 pipeline.
Yet even this reformed queue presents challenges. The Gate 2 battery queue — projects that have progressed past initial application stages — currently stands at 91 GW, while the Clean Power 2030 target requires only 29 GW. This means that even among projects that have cleared initial hurdles, roughly 68% will not be needed to meet national targets and must compete for commercial viability in an increasingly crowded market.
The implications for C&I customers are significant. Projects that are "shovel-ready" — with secured land rights, completed planning approvals, signed grid connection agreements, and demonstrated technical maturity — will increasingly receive preferential treatment. Projects that are speculative, under-capitalised, or technically immature will be squeezed out through a combination of regulatory pressure, queue reform fees, and competitive dynamics.
1.3 Revenue Model Transformation: From Ancillary Services to Wholesale Arbitrage
The most consequential shift in the UK storage market over the past 24 months has been the fundamental restructuring of revenue models. This transformation is so significant that it deserves detailed examination.
The Collapse of Frequency Response Revenue
Between 2020 and 2023, frequency response services — particularly Dynamic Containment, Dynamic Moderation, and Dynamic Regulation — provided the dominant revenue stream for UK battery storage assets. During this period, frequency response could account for 60–80% of total project revenue, with exceptionally high clearing prices driven by scarcity of responsive capacity.
This dynamic has been completely inverted. The massive influx of BESS capacity — 12.9 GWh operational as of 2026 — has saturated the frequency response market. Revenue from frequency response services now accounts for approximately 20% of average project revenue, down from its historical dominance. The price for these services has fallen to levels where they represent a supplementary rather than primary revenue stream.
The Rise of Wholesale Arbitrage and Balancing Mechanism
The revenue gap left by frequency response collapse has been filled by two sources that were previously marginal contributors:
- Wholesale price arbitrage: Charging during periods of low wholesale prices (typically overnight and during midday solar peaks) and discharging during high-price evening peaks. This now represents the largest single revenue source for many assets, with the combination of arbitrage and balancing mechanism participation contributing approximately 50% of average project revenue — up from just 8% in 2022.
- Balancing Mechanism (BM) participation: The BM, administered by NESO to reconcile generation and demand in real-time, offers premium prices for flexibility during periods of system stress. Assets registered as BM participants can access these revenues, though participation requires technical sophistication and operational capability.
The Decline of Capacity Market Revenue
The Capacity Market, designed to ensure security of supply during peak demand periods, has historically provided an important revenue floor for storage assets. New-build BESS assets are eligible for 15-year Capacity Market agreements, providing revenue certainty that supports project financing.
However, Capacity Market clearing prices have experienced a dramatic decline:
- 2022/23 auction: £75/kW/year
- 2026/27 auction: £5/kW/year
This represents a 93% decline in Capacity Market revenue over four auction cycles. While the 15-year agreement duration still provides some financing value, the absolute revenue contribution has diminished to near-negligible levels for many projects.
Implications for C&I Customers
The revenue transformation has profound implications for C&I storage deployment decisions:
1. Value stacking is essential: No single revenue stream is sufficient to support a viable project. Customers must build revenue models that combine wholesale arbitrage, balancing mechanism participation, demand charge reduction, self-consumption optimisation, and emerging flexibility services.
2. Behind-the-meter value is increasingly important: For C&I customers, the value of storage extends beyond grid revenue to include avoided network charges (DUoS, Triad, and capacity charges), self-consumption of on-site solar PV, and resilience benefits. These BTM values are often more predictable than grid revenue and should be prioritised in project economics.
3. Operational sophistication is a competitive advantage: The shift toward wholesale arbitrage and balancing mechanism revenue requires sophisticated optimisation algorithms, real-time market awareness, and the ability to respond to NESO dispatch signals. Storage projects that lack this operational capability will underperform.
1.4 Key Market Statistics Summary
| Metric | Value | Context |
| Total UK storage capacity (2025) | 12.7 GW | Europe's largest storage market |
| Grid-scale BESS operational capacity (2025) | 12.9 GWh | 45% YoY growth, ~4 GWh added |
| Projected market size (2034) | 58.8 GW | 18.03% CAGR from 2024 |
| C&I annual deployment (2026) | ~1 GWh/year | Projected 5–8 GWh/year by 2035 |
| BTM installed system value (2026) | £18–22 billion | Projected £65–85 billion by 2035 |
| Gate 2 battery queue | 91 GW | vs. 29 GW Clean Power 2030 target |
| Capacity Market clearing price (2026/27) | £5/kW | Down from £75/kW in 2022/23 |
| Frequency response revenue share | ~20% | Down from 60–80% historical peak |
| Wholesale arbitrage + BM revenue share | ~50% | Up from ~8% in 2022 |
2. Policy and Regulatory Environment: The Five Forces Reshaping the Market
The UK's regulatory framework for energy storage is undergoing its most significant transformation in decades. Five policy developments are reshaping the market landscape, each with direct implications for C&I storage deployment decisions.
2.1 Clean Power 2030: The Mandate Driving Everything
The Clean Power 2030 Action Plan, published by the UK government, establishes one of the most ambitious energy transition targets in the world: achieving a fully decarbonised electricity system by 2030. Within this framework, grid-scale battery storage has a clearly defined role:
Target: 23–27 GW of grid-scale battery capacity by 2030
Current status:
- 5 GW of battery capacity has been built over the past five years
- ~20 GW additional capacity must be built in the next five years
- 160 GWh of BESS projects have secured planning approval
- ~22 GWh are currently under construction
- ~13 GWh are already operational
The scale of the challenge is clear: the UK must deploy roughly four times as much battery capacity in the next five years as it has in the preceding five. This creates both opportunity and pressure. The opportunity lies in the sheer volume of projects that must be delivered. The pressure lies in the compressed timeline and the corresponding strain on supply chains, grid connections, and financing capacity.
For C&I customers, Clean Power 2030 has indirect but significant implications. As grid-scale storage scales up, the volatility in wholesale electricity prices that C&I storage can monetise will likely increase — creating both challenges (higher price spikes) and opportunities (greater arbitrage potential). Additionally, the policy focus on grid-scale storage may influence network charging arrangements and flexibility markets in ways that benefit or disadvantage behind-the-meter assets.
2.2 Grid Connection Reform: "Ready to Connect" Replaces "First Come, First Served"
The most significant regulatory change in the UK energy sector in decades.
Historically, the UK grid connection queue operated on a "first come, first served" basis. Projects applied for connection, received a queue position, and could retain that position indefinitely with minimal commitment. This created a queue exceeding 800 GW — more than ten times the capacity actually needed.
Under the new "Ready to Connect" framework, administered by NESO:
- Projects must demonstrate planning progress (securing necessary planning approvals)
- Projects must demonstrate land rights (legal control over the project site)
- Projects must demonstrate strategic consistency (alignment with national energy goals)
- Projects that cannot meet these thresholds are removed from the queue or given later connection dates
Progress to date:
As of June 10, 2026, NESO has issued connection offers to 713 projects covering 37 GW of new renewable and BESS capacity. This represents 58% of the pre-2030 pipeline.
The queue reduction has been dramatic. From a peak exceeding 800 GW, the active pipeline has been reduced by more than half. This rationalisation has significant implications:
1. Quality over quantity: Projects that are genuinely ready — with land, planning, and technical maturity — are being prioritised. Speculative projects are being eliminated.
2. Connection dates are becoming more reliable: With fewer speculative projects in the queue, the connection dates offered by NESO are increasingly trustworthy. Projects can plan with greater certainty.
3. Competition among mature projects intensifies: With the queue rationalised, the remaining "real" projects face clearer competition. Differentiation through technical quality, commercial viability, and execution capability becomes more important.
2.3 CMP470: The Grid Connection Queue Charging Reform
The most consequential regulatory development of July 2026.
The CMP470 modification introduces a new charging structure for grid connection queue positions. The key element is the Overage Technical Commitment Fee (OTCF) — a fee that developers must pay to retain their position in the connection queue.
Key developments:
- July 14, 2026: The Final Modification Report was published, reducing the proposed OTCF fee floor from £10,000/MW to £3,000/MW, with a fee ceiling of £25,000/MW.
- August 2026: Ofgem is scheduled to make its decision on CMP470 by mid-August 2026.
- Projected implementation: Fees are expected to take effect in July 2027.
The scale of the problem CMP470 addresses:
The Gate 2 battery queue currently stands at 91 GW, while the Clean Power 2030 target requires only 29 GW. This means that:
- ~25 GW of queue projects are currently holding queue positions without paying any security or commitment fees
- These projects face elimination as CMP470 fees are introduced
- The elimination of speculative projects will free up grid connection capacity for genuinely viable projects
Implications for C&I customers:
CMP470 will have several effects on the C&I storage market:
1. Higher developer costs: Developers will need to pay fees to retain queue positions, increasing project development costs. These costs may be passed through to C&I customers.
2. Queue rationalisation: The elimination of speculative projects should reduce queue congestion, potentially leading to faster connection times for genuinely viable projects.
3. Project viability screening: The fee structure will force developers to conduct rigorous viability assessments before committing to queue positions. Projects with uncertain economics will be abandoned earlier in the development process.
4. Opportunity for serious players: For developers and C&I customers who are committed to storage deployment, the queue rationalisation represents an opportunity. Removing speculative competition improves access to grid connections for projects that are genuinely ready to proceed.
2.4 Long-Duration Energy Storage (LDES): The "Cap and Floor" Mechanism
A new support mechanism for long-duration storage is being introduced.
On June 26, 2026, Ofgem published its minded-to decision on the first LDES application window, supporting 16 projects with a combined capacity of 7.6 GW power and 137 GWh energy storage capacity. This represents a significant commitment to technologies that can store energy for extended periods (typically 6+ hours).
The "cap and floor" mechanism provides revenue certainty:
- Floor: A minimum revenue guarantee that protects investors from downside risk
- Cap: A maximum revenue level above which excess returns are shared with consumers
August 20, 2026 update: The UK government launched the Ultra-LDES Challenge, providing £28 million in funding for technologies that can store and discharge energy for more than 100 hours. This targets seasonal storage applications that are currently outside the scope of conventional battery technologies.
The C&I opportunity in the LDES space:
For C&I customers, the 4–8 hour storage duration segment represents a significant market opportunity. The LDES mechanism is expected to support projects in this duration range, which aligns with many C&I applications:
- Industrial process shifting: Moving energy-intensive operations to periods of lower electricity prices
- Extended backup power: Providing resilience during prolonged grid outages
- Solar self-consumption optimisation: Capturing daytime solar generation for evening and overnight use
The 4–8 hour C&I storage segment is estimated to represent a £20–30 billion market opportunity.
2.5 VAT Exemption and Capacity Market Reforms
VAT exemption:
Storage systems in the UK are exempt from VAT until March 2027. This exemption applies to both standalone storage and storage integrated with solar PV systems. The exemption provides a 20% cost reduction for C&I storage projects and has been an important enabler of market growth.
What happens after March 2027?
The future of the VAT exemption beyond March 2027 remains uncertain. If the exemption is not extended, the cost of storage systems will increase by 20%, potentially slowing C&I deployment. C&I customers considering storage projects should factor this uncertainty into their planning timelines.
Capacity Market reforms:
The Capacity Market continues to provide 15-year agreements for new-build BESS assets, offering revenue certainty that supports project financing. However, clearing prices have collapsed:
| Auction Year | Clearing Price (£/kW) | Change from Peak |
| 2022/23 | £75 | Baseline |
| 2023/24 | £40 | -47% |
| 2024/25 | £18 | -76% |
| 2025/26 | £10 | -87% |
| 2026/27 | £5 | -93% |
The Capacity Market, once a cornerstone of storage project revenue, now contributes only marginal value. The 15-year agreement duration still provides financing value — lenders view it as a revenue floor that reduces downside risk — but the absolute revenue contribution has become negligible.
Implications:
The collapse of Capacity Market prices has two important implications:
1. Revenue stacking becomes even more critical: With Capacity Market revenue reduced to near-zero, projects must rely on other revenue streams — wholesale arbitrage, balancing mechanism, and BTM value — to achieve viability.
2. Project economics shift toward BTM value: For C&I customers, the value of storage increasingly lies in avoided costs (demand charges, network charges, self-consumption) rather than grid revenue. This makes storage an operational efficiency investment rather than a grid revenue play.
3. Recent Project Deployments: What Success Looks Like in 2026
The UK storage market in 2026 is characterised by a diverse range of successful projects spanning grid-scale installations, commercial applications, and industrial behind-the-meter deployments. These projects provide valuable reference points for C&I customers considering storage investments.
3.1 Grid-Scale Project Reference Points
Fidra Energy Thorpe Marsh
- Capacity: 1.4 GW
- Location: Thorpe Marsh, South Yorkshire
- Status: Financing completed 2025
- Significance: The largest single-project financing in Europe during 2025, with approximately £1 billion raised. This project demonstrates the appetite of institutional investors for UK grid-scale storage assets and establishes a benchmark for project financing structures.
Statera Thurrock
- Capacity: 300 MW
- Location: Thurrock, Essex
- Status: Operational August 2025
- Significance: Upon commissioning, this was the largest operational storage site in the UK. It demonstrates the technical feasibility of large-scale BESS deployment within transmission-connected infrastructure.
Pulse Clean Energy Portfolio
- Capacity: 700+ MWh
- Financing: £220 million senior debt
- Significance: Notable for including the repurposing of former diesel generation sites for battery storage. This demonstrates the potential for converting legacy fossil fuel infrastructure to clean energy assets.
SAE Uskmouth
- Capacity: 240 MWh
- Status: Financial close 2025
- Significance: Located at a former coal-fired power station site, this project demonstrates the "just transition" narrative of repurposing legacy energy infrastructure.
3.2 Commercial & Industrial Project Reference Points
Solis RJAH Orthopaedic Hospital
- Capacity: 600+ kWh
- Status: Operational July 2026
- Significance: The first C&I storage project in the UK for Solis, a major inverter manufacturer. Demonstrates the entry of established solar PV manufacturers into the C&I storage space.
Lombard Shipping Ipswich
- System: 102.4 kWh battery + rooftop solar PV + EV charging
- Solar generation: 118 MWh/year
- Financial impact: ~£1 million savings over 20 years; payback period of just over 5 years
- Significance: Demonstrates the value stacking potential of combining solar PV, battery storage, and EV charging infrastructure in a single integrated solution.
Wattstor × LSN Diffusion
- System: 1.3 MW solar PV + 5 MWh BESS
- Location: South Wales manufacturing facility
- Status: Signed June 2026
- Significance: A substantial industrial deployment demonstrating the scale of C&I storage deployment now occurring in the UK manufacturing sector.
CDS Superstores Avonmouth
- System: 2.5 MW solar PV (Phase 1)
- Planned: 40 MW solar PV + storage + intelligent demand management across UK sites
- Significance: Demonstrates the portfolio approach that large C&I customers are adopting, deploying storage across multiple sites with centralised optimisation.
Wenergy UK
- Capacity: 289 kWh C&I ESS cabinet
- Status: Supplied July 2026
- Significance: Notable for being designed for direct electricity market trading rather than solely behind-the-meter applications. This represents a new model where C&I storage assets participate actively in wholesale and balancing markets.
3.3 Key Lessons from Recent Deployments
Several patterns emerge from these project references:
Lesson 1: Value stacking is the norm, not the exception
Every successful C&I storage project in 2026 combines multiple value streams:
- Solar self-consumption optimisation
- Demand charge reduction
- Wholesale price arbitrage
- Balancing mechanism participation (for larger assets)
- Resilience and backup power
- Grid service provision (where applicable)
Lesson 2: Financing innovation is accelerating
The emergence of Power Purchase Agreements (PPAs), leasing arrangements, and "Storage-as-a-Service" models is transforming the C&I storage market. Customers no longer need to fund storage projects entirely from their own balance sheets. Third-party financing structures enable deployment with zero upfront capital.
Lesson 3: Integration with solar PV is standard
Almost all C&I storage deployments in 2026 are integrated with solar PV. The combination of solar generation and storage enables maximum self-consumption, reduces grid import costs, and provides complementary value streams. Pure storage deployments (without solar) remain rare in the C&I segment.
Lesson 4: Technical sophistication differentiates winners
Projects that succeed in 2026 demonstrate sophisticated technical capabilities:
- Real-time market monitoring and optimisation
- Automated dispatch based on price signals
- Integration with building energy management systems
- Predictive analytics for demand forecasting
- Remote monitoring and control capabilities
4. The Nine Critical Problems Facing C&I Storage Customers — And How to Solve Them
The UK C&I storage market in August 2026 presents nine critical challenges that every customer — whether an industrial manufacturer, commercial property owner, or energy services provider — must navigate. This section provides detailed analysis of each problem and actionable guidance for addressing them.
Problem 1: The 91 GW Grid Queue vs. 29 GW Target — How to Ensure Your Project Isn't Squeezed Out
The Situation
The UK's Gate 2 battery queue currently stands at 91 GW, while the Clean Power 2030 target requires only 29 GW. This means that even among projects that have passed initial screening, 68% will not be needed to meet national targets. With CMP470 fees approaching and "Ready to Connect" criteria tightening, many projects will be eliminated.
Why This Matters for C&I Customers
For C&I customers developing storage projects, the grid connection queue is a critical bottleneck. Projects that cannot secure timely grid connections face multi-year delays or complete cancellation. The queue rationalisation creates a Darwinian environment where only the fittest projects survive.
The Scale of the Challenge
| Queue Metric | Value | Implication |
| Gate 2 battery queue | 91 GW | Total projects awaiting connection |
| Clean Power 2030 target | 29 GW | Capacity actually needed |
| Projects currently paying no commitment fees | ~25 GW | At risk of elimination |
| CMP470 fee floor | £3,000/MW | Minimum annual cost to retain position |
| CMP470 fee ceiling | £25,000/MW | Maximum annual cost |
How to Ensure Your Project Survives
1. Demonstrate genuine project maturity
The "Ready to Connect" framework prioritises projects that demonstrate:
- Planning progress: Planning permission secured or application submitted
- Land rights: Legal control over the project site (option, lease, or ownership)
- Technical maturity: Detailed engineering design completed
- Financial viability: Evidence that the project can reach financial close
Projects that lack these elements will be deprioritised and may lose their queue position.
2. Budget for connection fees
The CMP470 OTCF fees — expected to take effect in July 2027 — will add significant costs to project development. A 10 MW project would face fees of £30,000 to £250,000 per year to retain its queue position. These costs must be incorporated into project budgets.
3. Consider alternative connection approaches
For some C&I customers, grid connection may not be the optimal approach:
- Behind-the-meter deployment: Storage sized to match on-site demand may not require grid connection approval
- Distribution-connected projects: Smaller projects connecting at distribution level may face shorter queues
- Existing connection utilisation: Using existing grid connection capacity that is currently underutilised
4. Partner with experienced developers
The complexity of grid connection in 2026 favours experienced developers who understand the regulatory landscape and have established relationships with network operators. Partnering with such developers can improve the chances of securing and retaining queue positions.
Problem 2: Ancillary Service Market Saturation — How to Maintain Revenue After Frequency Response Collapse
The Situation
The frequency response market — historically the dominant revenue source for UK storage assets — has been saturated by the influx of new BESS capacity. Revenue from frequency response has collapsed from its historical peak, now contributing only ~20% of average project revenue. The revenue structure has fundamentally changed:
| Revenue Stream | 2022 Share | 2026 Share | Change |
| Frequency response | 60–80% | ~20% | Collapse |
| Wholesale arbitrage + BM | ~8% | ~50% | Massive growth |
| Capacity Market | Significant | Marginal | Collapse |
| Other (BM, trading, etc.) | ~10% | ~30% | Growth |
Why This Matters for C&I Customers
The revenue model that supported storage projects from 2020–2023 no longer works. Projects designed around frequency response revenue will underperform significantly. New projects must be designed with revenue models that reflect the 2026 market reality.
How to Build a Sustainable Revenue Model in 2026
1. Prioritise wholesale arbitrage
Wholesale price arbitrage — charging when prices are low and discharging when prices are high — has become the dominant revenue source. The UK's increasingly renewable-heavy grid creates predictable price patterns:
- Low prices: Overnight (low demand), midday (high solar generation)
- High prices: Evening peak (high demand, solar declining)
Storage assets that can capture this spread systematically can generate substantial revenue. The key is sophisticated optimisation that anticipates price movements rather than reacting to them.
2. Embrace balancing mechanism participation
The Balancing Mechanism offers premium prices for flexibility during periods of system stress. While BM participation requires technical sophistication and NESO registration, the revenue potential is significant. Assets with fast response capabilities and reliable availability can capture these revenues.
3. Stack BTM value streams
For C&I customers, behind-the-meter value is often more predictable and reliable than grid revenue:
- Demand charge reduction: Avoiding capacity charges by reducing peak import
- Self-consumption optimisation: Maximising use of on-site solar generation
- Network charge avoidance: Reducing DUoS charges (particularly Triad charges during winter peaks)
4. Consider longer-duration storage
As frequency response revenue declines, the value of longer-duration storage (4+ hours) increases. Longer-duration assets can participate in wholesale arbitrage across wider price spreads and capture value from multi-hour price differentials. The LDES mechanism (Section 2.4) provides additional support for these assets.
Problem 3: Commercial Demand and Capacity Charges — How to Precisely Reduce Them
The Situation
For UK commercial and industrial customers with electrical loads exceeding 100 kVA, capacity charges represent a significant cost:
- Capacity charge: Approximately £7.26/kVA/month
- Excess capacity charge: Applied when consumption exceeds the contracted capacity or agreed limits
- G100 export limitation: Further restricts maximum import/export capacity
In the increasingly cost-reflective capacity charging regime, repeated exceedances significantly compress investment returns and increase operating costs.
Why This Matters for C&I Customers
Capacity charges are a fixed cost that applies regardless of actual energy consumption. For customers with variable demand profiles, capacity charges may represent 30–50% of total electricity costs. Reducing capacity charges through storage is one of the most direct and reliable value streams available.
How Storage Reduces Capacity Charges
1. Peak shaving
Storage can discharge during periods of high demand to reduce the maximum import level. If a customer's peak demand is 500 kVA, but storage can reduce this to 400 kVA, the customer saves £726 per month (£7.26 × 100 kVA) in capacity charges.
2. Load shifting
Storage can shift non-time-critical loads (e.g., HVAC, water heating, EV charging) to periods of lower demand, smoothing the overall demand profile and reducing peak requirements.
3. Export management
For customers with on-site generation (solar PV) that exceeds local demand, storage can absorb excess generation and avoid export constraints. Under G100 export limitation schemes, storage enables the site to operate within export limits while maximising self-consumption.
Calculating Storage ROI for Capacity Charge Reduction
A simple framework for assessing storage value for capacity charge reduction:
| Parameter | Example Value |
| Peak demand without storage | 500 kVA |
| Peak demand with storage | 400 kVA |
| Capacity charge reduction | 100 kVA × £7.26/month = £726/month |
| Annual savings | £8,712 |
| Storage system cost (assume 200 kWh/100 kW) | ~£50,000–£70,000 |
| Simple payback (capacity charges alone) | 5.7–8.0 years |
Note: This calculation considers capacity charge reduction only. When combined with other value streams (wholesale arbitrage, solar self-consumption, network charge avoidance), the overall payback period typically shortens to 3–5 years.
Problem 4: Fire Safety Approval Adds 4–8 Months — How to Accelerate Project Timelines
The Situation
The UK lacks a unified fire safety rulebook for BESS installations. Local fire authority approvals add 4–8 months to project timelines. The regulatory landscape is evolving:
Key regulatory developments:
| Regulation | Date | Key Requirements |
| 1 MWh lithium-ion threshold | Current | England's clearest BESS-specific planning signal |
| BS 7671 Amendment 4 | April 2026 | New AC and DC isolation point requirements; firefighter safety labelling |
| NFCC Grid-Scale BESS Planning Guide | 2026 | Tightened fire safety standards |
Why This Matters for C&I Customers
Fire safety approval delays extend project timelines, increase development costs, and create uncertainty. Projects that encounter fire safety objections may need significant design modifications or face complete rejection. For customers with time-sensitive requirements (e.g., replacing failing equipment or meeting corporate sustainability targets), these delays can be costly.
How to Accelerate Fire Safety Approval
1. Engage fire authorities early
Contact the local fire authority during the early design phase, not after plans are finalised. Early engagement allows fire safety considerations to be incorporated into the design from the outset, reducing the likelihood of objections later.
2. Exceed minimum standards
Design systems that exceed regulatory minimums:
- Fire suppression systems: Install automatic fire suppression (e.g., aerosol-based systems) even where not strictly required
- Fire-rated enclosures: Use products with enhanced fire resistance
- Monitoring and early detection: Install gas detection systems that can identify potential issues before thermal runaway occurs
- Isolation capability: Ensure AC and DC isolation points are clearly marked and accessible, meeting BS 7671 Amendment 4 requirements
3. Use products with demonstrated safety credentials
Some products incorporate advanced safety features that can streamline approval:
- Liquid cooling: Reduces thermal stress on battery cells, lowering fire risk
- Cell-level monitoring: Provides early warning of potential issues
- Integrated fire suppression: Built-in suppression systems reduce the need for external fire protection measures
- Safety certifications: Products with UL 9540A or equivalent certifications demonstrate compliance with fire safety standards
4. Consider below-threshold deployments
For some applications, deploying multiple smaller systems (each below the 1 MWh threshold) may be preferable to a single larger system that triggers additional scrutiny. While this may increase complexity, it can significantly reduce approval timelines.
Problem 5: Planning Permission — Large Projects (>50 MW) Require NSIP Approval
The Situation
Large storage projects (typically >50 MW) are classified as Nationally Significant Infrastructure Projects (NSIPs) and require a Development Consent Order (DCO). The DCO process can add years to project timelines. Even for smaller projects, noise sensitivity can eliminate potential sites before engineering design even begins.
Why This Matters for C&I Customers
For customers considering large storage deployments, the planning process is a significant barrier. The DCO process involves:
- Environmental impact assessment
- Public consultation
- Government review
- Potential legal challenges
The timeline for DCO approval typically ranges from 2–5 years, during which the project cannot proceed to construction.
How to Navigate the Planning Landscape
1. Right-size projects to avoid NSIP requirements
For most C&I applications, storage needs can be met with projects well below the 50 MW threshold. A 1–10 MW system is sufficient for most industrial and commercial facilities. Staying below the NSIP threshold avoids the DCO process entirely.
2. Address noise concerns proactively
Noise from cooling systems, inverters, and transformers can trigger objections. Proactively address noise through:
- Liquid cooling: Typically quieter than air-cooled systems
- Acoustic enclosures: Sound-dampening enclosures that reduce external noise
- Site selection: Locating storage away from noise-sensitive receptors (residential areas, offices)
- Noise modelling: Conducting acoustic assessments during the design phase to demonstrate compliance
3. Consider indoor installations
For sites with space constraints or noise sensitivity, indoor storage installations may be preferable. Indoor systems can be placed within existing buildings, eliminating visual impact and reducing noise emissions. Products designed for indoor/outdoor flexibility (e.g., Alpha ESS Storion G3 with IP55 protection) can accommodate both configurations.
4. Bundle storage with solar PV
Storage projects that are co-located with solar PV often benefit from streamlined planning processes. The storage is viewed as an accessory to the solar installation rather than a standalone development, simplifying the approval process.
Problem 6: UK Lacks Domestic Cell Manufacturing — How to Secure Supply Chain
The Situation
As of 2026, the UK has no large-scale cell superfactory operational for the BTM storage market. The Tata (Agratas) Somerset gigafactory (40 GWh planned) is not expected to produce BTM storage cells until 2028–2029 at the earliest. Consequently:
- 70–80% of cell value is imported (China, South Korea, and increasingly European suppliers)
- UK integrators typically hold only 4–8 weeks of cell inventory
- Supply chain disruptions can delay project delivery by months
Why This Matters for C&I Customers
Supply chain vulnerability is a critical risk for storage projects. Delays in cell delivery can extend project timelines, increase costs, and jeopardise financing arrangements. Customers who fail to secure reliable cell supply may find their projects delayed indefinitely.
How to Secure Supply Chain Reliability
1. Partner with established suppliers
Work with suppliers who have demonstrated supply chain resilience:
- Tier 1 manufacturers: Companies with diversified manufacturing bases and established logistics networks
- Multi-source strategies: Suppliers who can source cells from multiple manufacturers
- Vertical integration: Companies that control their supply chain end-to-end
2. Consider alternative cell chemistries
Lithium iron phosphate (LFP) cells have become the dominant chemistry for stationary storage, offering:
- Lower cost: LFP cells are typically 20–30% cheaper than NMC alternatives
- Improved safety: LFP has higher thermal stability, reducing fire risk
- Longer cycle life: LFP cells typically achieve 6,000–8,000 cycles
- No cobalt: Eliminating supply chain dependency on cobalt (concentrated in the Democratic Republic of Congo)
3. Build inventory buffers
For critical projects, consider purchasing additional cells or complete systems in advance of need. While this ties up capital, it provides insurance against supply chain disruptions.
4. Consider containerised systems
Containerised storage systems (e.g., 20ft/40ft container solutions) can be sourced from multiple suppliers and delivered as complete units. This approach reduces integration complexity and provides supply chain flexibility.
Problem 7: Capacity Market Price Collapse — How to Respond to the £75/kW to £5/kW Decline
The Situation
Capacity Market clearing prices have declined 93% over four auction cycles:
| Auction Year | Clearing Price (£/kW) | 15-Year Agreement Value (per MW) |
| 2022/23 | £75 | £1,125,000 |
| 2023/24 | £40 | £600,000 |
| 2024/25 | £18 | £270,000 |
| 2025/26 | £10 | £150,000 |
| 2026/27 | £5 | £75,000 |
While new-build BESS assets still receive 15-year agreements, the revenue contribution has diminished to near-negligible levels.
Why This Matters for C&I Customers
The Capacity Market collapse means that storage projects can no longer rely on Capacity Market revenue to support their business case. Projects that were designed with Capacity Market revenue as a significant component will underperform. New projects must be designed with realistic expectations of Capacity Market value.
How to Adapt to the Capacity Market Collapse
1. Treat Capacity Market as bonus revenue, not core revenue
Design project economics assuming zero Capacity Market revenue. Any Capacity Market income should be treated as upside rather than baseline. This creates conservative project economics that are robust to further Capacity Market declines.
2. Focus on value streams with growth potential
Identify revenue streams that are likely to grow rather than decline:
- Wholesale arbitrage: Increasing renewable penetration creates greater price volatility
- Balancing mechanism: System flexibility needs will grow as renewable share increases
- BTM value: Capacity charge reduction and self-consumption optimisation are reliable and predictable
- Flexibility services: Emerging products (e.g., local flexibility markets, constraint management) offer new revenue opportunities
3. Reconsider project sizing
With Capacity Market revenue reduced, the optimal storage capacity for a given site may change. Smaller systems that focus on BTM value may offer better returns than larger systems that depend on grid revenue.
Problem 8: C&I Competition Shift to "Solution-Oriented" — How to Differentiate
The Situation
The UK C&I storage market has shifted from price-based competition to solution-oriented differentiation. Integrators compete on:
- System design quality
- Financing innovation (PPAs, leasing)
- Grid service optimisation
- Technical support and maintenance
Meanwhile, Chinese cell suppliers (CATL, BYD, EVE Energy) are increasingly selling directly to UK integrators, bypassing traditional distributors and compressing margins for mid-tier players.
Why This Matters for C&I Customers
The shift to solution-oriented competition creates both opportunity and risk:
- Opportunity: Customers can access more sophisticated solutions tailored to their specific needs
- Risk: The proliferation of solution providers makes it harder to distinguish genuinely competent providers from those with superficial differentiation
How to Navigate the Solution-Oriented Market
1. Evaluate total lifetime cost, not upfront price
The cheapest system may not be the cheapest over its lifetime. Consider:
- Cycle life and degradation rates
- Maintenance requirements
- Efficiency losses
- Reliability and downtime
- Warranty terms and conditions
2. Assess technical sophistication
Look for providers who demonstrate:
- Real-time optimisation capabilities
- Integration with energy management systems
- Predictive analytics
- Remote monitoring and troubleshooting
- Regular software updates and improvements
3. Demand financing flexibility
The best providers offer multiple financing options:
- Direct purchase
- Lease arrangements
- Power Purchase Agreements (PPAs)
- Storage-as-a-Service models
4. Verify supply chain relationships
Ask providers about their cell suppliers and sourcing strategies. Providers with established relationships with Tier 1 cell manufacturers (CATL, BYD, EVE, etc.) are better positioned to ensure reliable delivery.
Problem 9: Can Outdoor Cabinet Products Meet UK Climate and Site Constraints?
The Situation
The UK climate — characterised by damp, rainy conditions and cold winters — places specific demands on outdoor storage equipment. Key requirements include:
- High IP protection ratings: IP55 or higher to withstand rain, moisture, and dust
- Low-temperature operation: Performance at temperatures below 0°C
- Space efficiency: C&I sites often have limited space
- Noise management: Proximity to occupied buildings requires low noise emissions
Why This Matters for C&I Customers
Selecting storage equipment that is not suited to UK conditions can lead to:
- Reduced performance and efficiency
- Increased maintenance requirements
- Premature equipment failure
- Safety hazards
- Regulatory compliance issues
Current Product Landscape
The market has responded to these challenges with products specifically designed for UK conditions:
| Product | Capacity | Footprint | Key Features |
| SOCOMEC SMARTSYS C260 | 125 kVA/261 kWh to 1 MVA/2 MWh | 1.35 m² | LFP liquid-cooled, integrated outdoor cabinet, <2 hours installation per cabinet |
| LONGi Hi-MO One Pro | 261 kWh modular | Not specified | iCCS predictive safety technology, detects abnormal gases 25 minutes in advance |
| LONGi OmniCube L233 | 233 kWh/125 kW | 1.35 m² | 8,000 cycle life, high energy density |
| Sunwoda OASIS A200 | 200 kWh | Not specified | Air-cooled LFP, IP55, BNEF Tier 1 Q2 2026 |
| Alpha ESS Storion G3 | Not specified | Not specified | Indoor/outdoor dual-use, IP55 protection, integrated design |
How to Select Outdoor Equipment for UK Conditions
1. Prioritise IP55 or higher protection
For outdoor installations in the UK's damp climate, IP55 is the minimum acceptable rating. IP65 or IP66 offers additional protection for particularly exposed locations.
2. Consider liquid cooling
Liquid-cooled systems offer multiple advantages for UK applications:
- Temperature control: Maintains optimal cell temperature in both cold and warm conditions
- Noise reduction: Typically quieter than air-cooled systems
- Compact design: Higher energy density enables smaller footprints
- Improved cycle life: Better temperature management extends battery life
3. Evaluate footprint efficiency
Products that deliver high energy density per square metre are increasingly important for space-constrained C&I sites. The LONGi OmniCube L233 and SOCOMEC SMARTSYS C260 both deliver 233–261 kWh in just 1.35 m², representing the current state of the art.
4. Look for predictive safety features
Advanced safety features, such as LONGi's iCCS predictive safety technology (which can detect abnormal gases 25 minutes before thermal runaway), provide an additional layer of protection and may streamline fire safety approvals.
5. Technical Product Matrix: Outdoor Cabinets and Containerised Systems
The UK C&I storage market in August 2026 offers a diverse range of technical solutions. This section provides a structured comparison of outdoor cabinet products and containerised systems currently available, with a focus on specifications relevant to UK deployment conditions.
5.1 Outdoor Cabinet Solutions
Outdoor cabinet systems are the preferred solution for many C&I applications, offering compact footprints, rapid installation, and modular scalability.
Comparison Table: Outdoor Cabinet Products (2026)
| Specification | SOCOMEC SMARTSYS C260 | LONGi OmniCube L233 | Sunwoda OASIS A200 | Alpha ESS Storion G3 |
| Power range | 125 kVA – 1 MVA | 125 kW | Not specified | Not specified |
| Capacity range | 261 kWh – 2 MWh | 233 kWh | 200 kWh | Not specified |
| Footprint | 1.35 m² | 1.35 m² | Not specified | Not specified |
| Cooling | Liquid (LFP) | Liquid (LFP) | Air (LFP) | Not specified |
| IP rating | Outdoor-rated | Outdoor-rated | IP55 | IP55 |
| Cycle life | Not specified | 8,000 cycles | Not specified | Not specified |
| Installation time | <2 hours/cabinet | Not specified | Not specified | Not specified |
| Indoor/outdoor | Outdoor | Outdoor | Outdoor | Dual-use |
| Notable features | Fully integrated design | High energy density | BNEF Tier 1 Q2 2026 | Integrated design |
5.2 Containerised Solutions
For larger C&I and industrial applications, containerised storage systems offer higher energy density and rapid deployment.
Key products in the containerised segment:
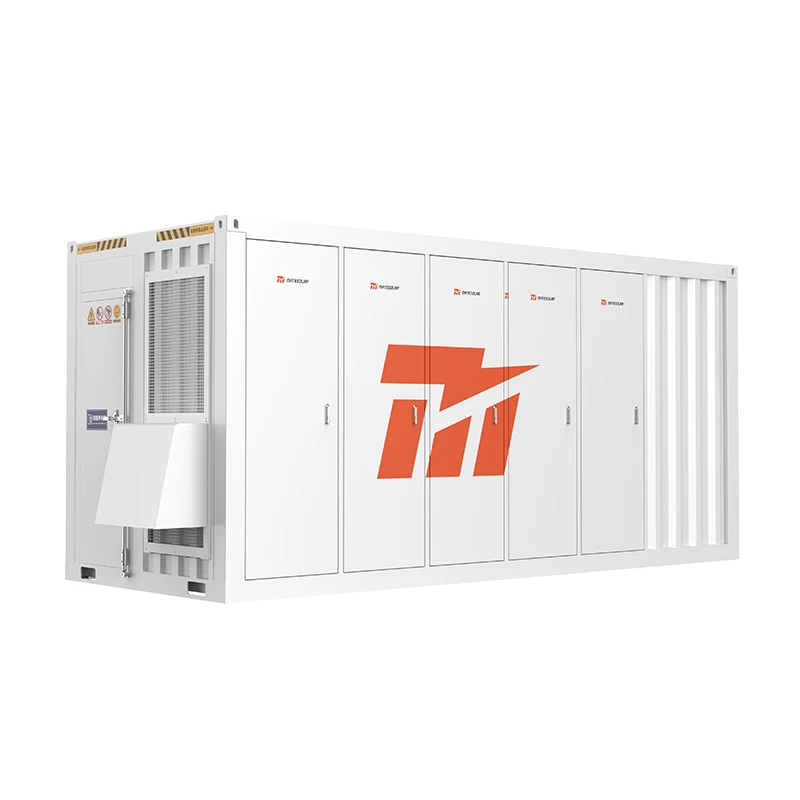
40ft 1 MWh / 2 MWh Air-Cooled Container ESS
This category represents the workhorse of the C&I storage market, offering:
- Pre-assembled and factory-tested design
- Air-cooled thermal management suitable for UK climate conditions
- Rapid deployment (days rather than weeks)
- Scalable from 1 MWh to multi-MWh configurations
- Suitable for industrial facilities, logistics centres, and large commercial properties
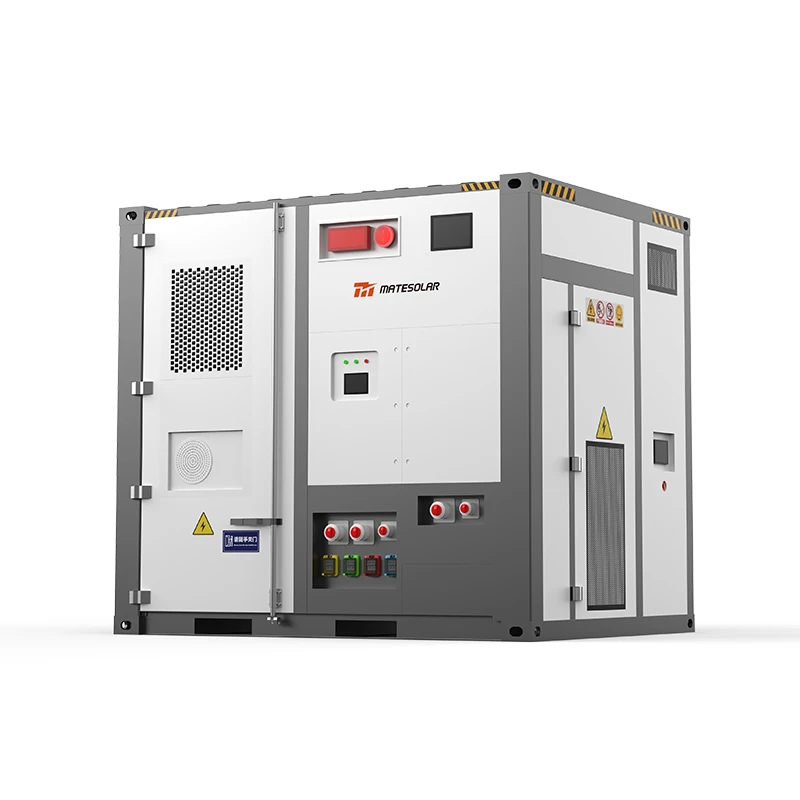
20ft 3 MWh / 5 MWh Liquid-Cooling Container ESS
This category represents the latest generation of containerised storage:
- Liquid cooling enables higher energy density (up to 5 MWh in a 20ft container)
- Improved thermal management extends cycle life
- Reduced auxiliary power consumption
- Suitable for applications requiring large capacity in limited space
- Ideal for industrial microgrids and large-scale C&I deployments
Comparison Table: Containerised Solutions
| Specification | 40ft Air-Cooled Container | 20ft Liquid-Cooled Container |
| Capacity | 1–2 MWh | 3–5 MWh |
| Cooling | Air-cooled | Liquid-cooled |
| Footprint | 40ft container | 20ft container |
| Energy density | Lower | Higher (3x per footprint) |
| Installation | Pre-assembled, factory-tested | Pre-assembled, factory-tested |
| Suitable applications | Industrial, logistics, commercial | Large industrial, microgrid, high-density applications |
| Maintenance | Simpler (air cooling) | More complex (liquid cooling) |
| Noise | Higher (fan noise) | Lower (liquid cooling quieter) |
5.3 Integrated Solar + Storage Solutions
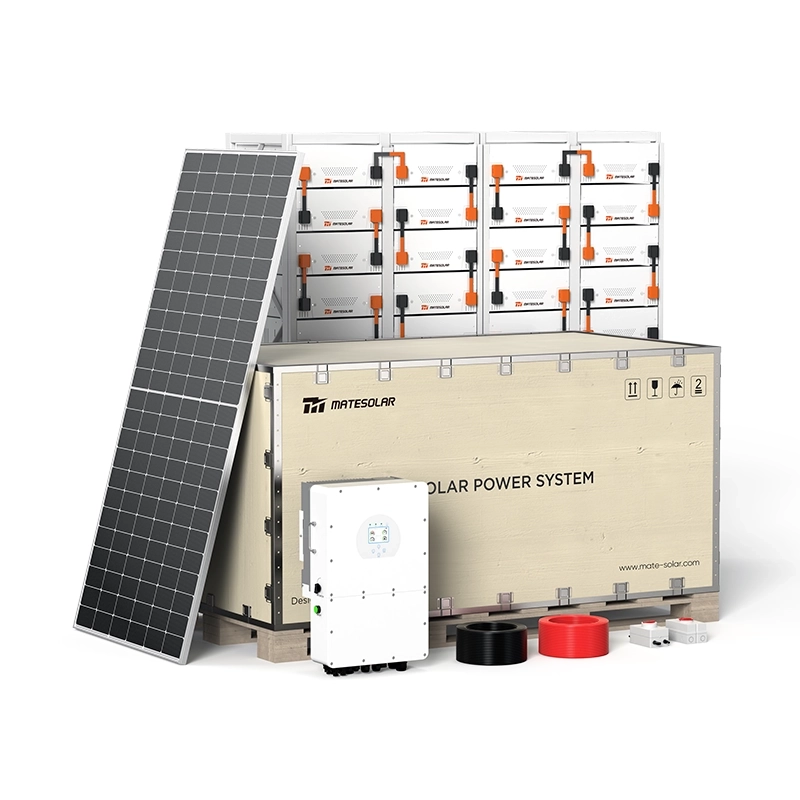
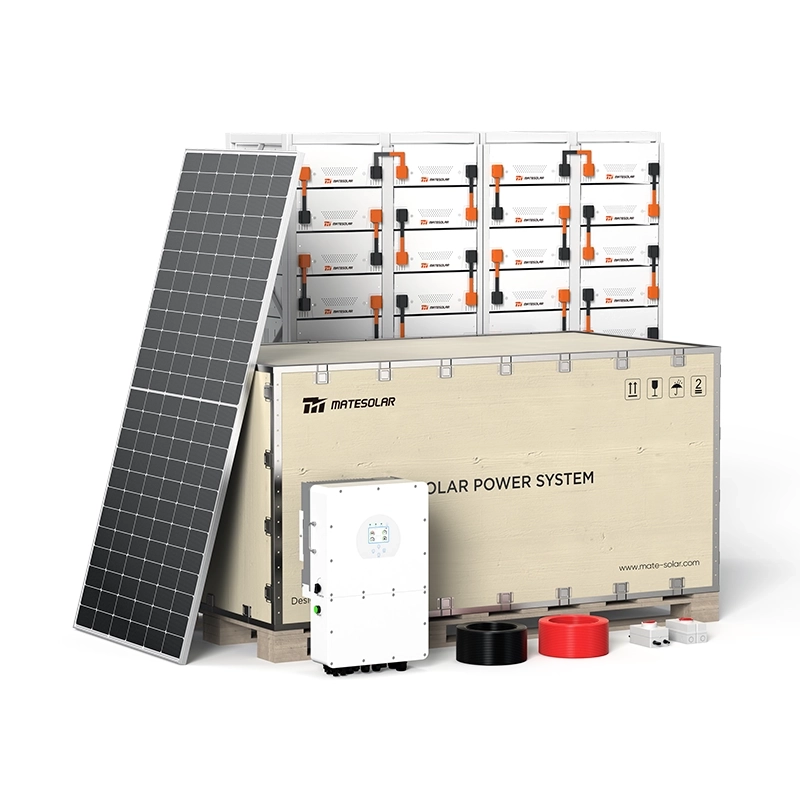
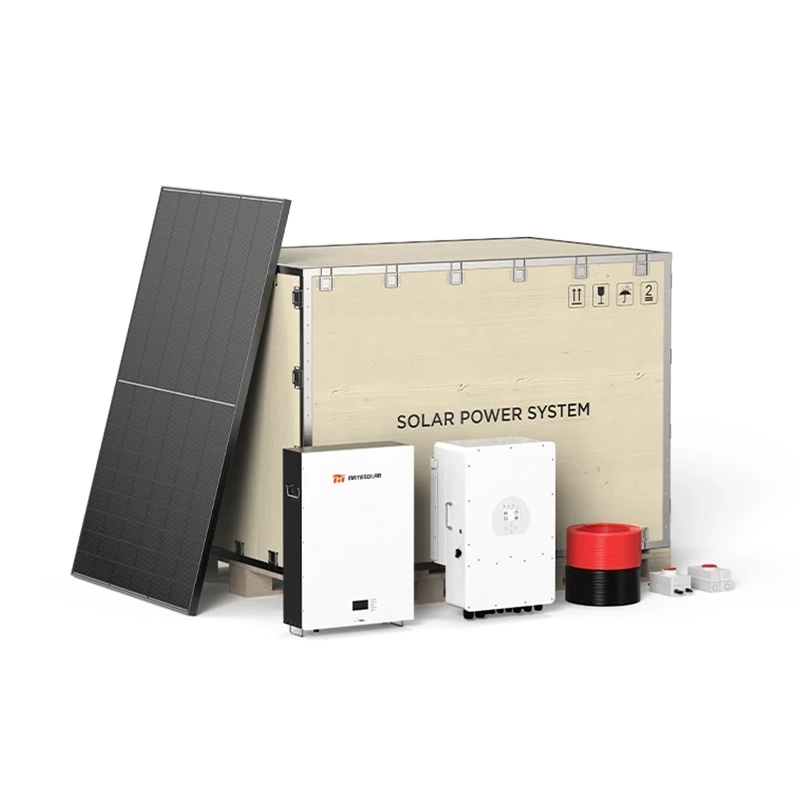
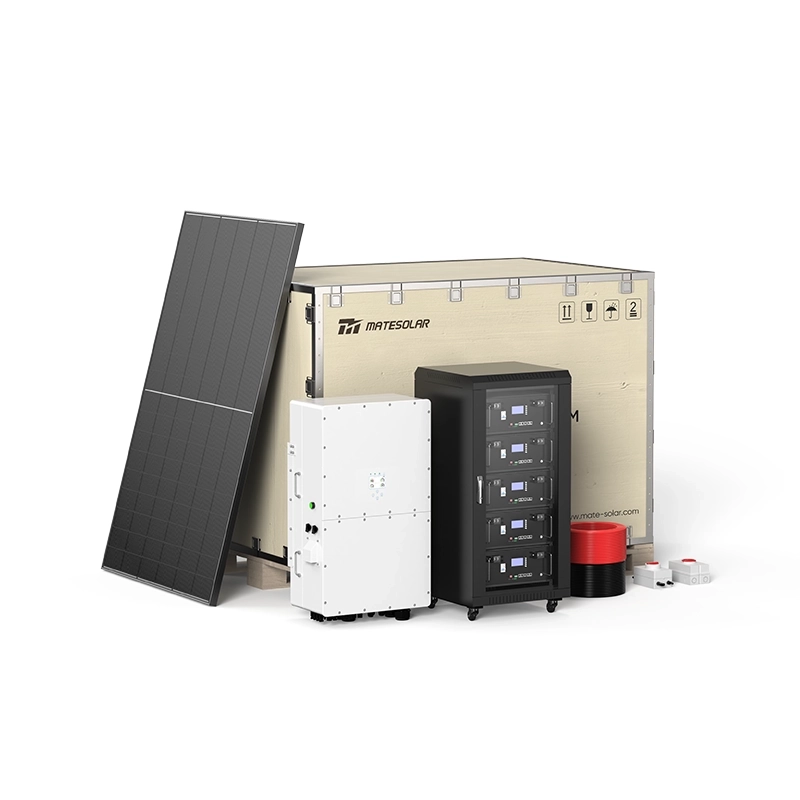
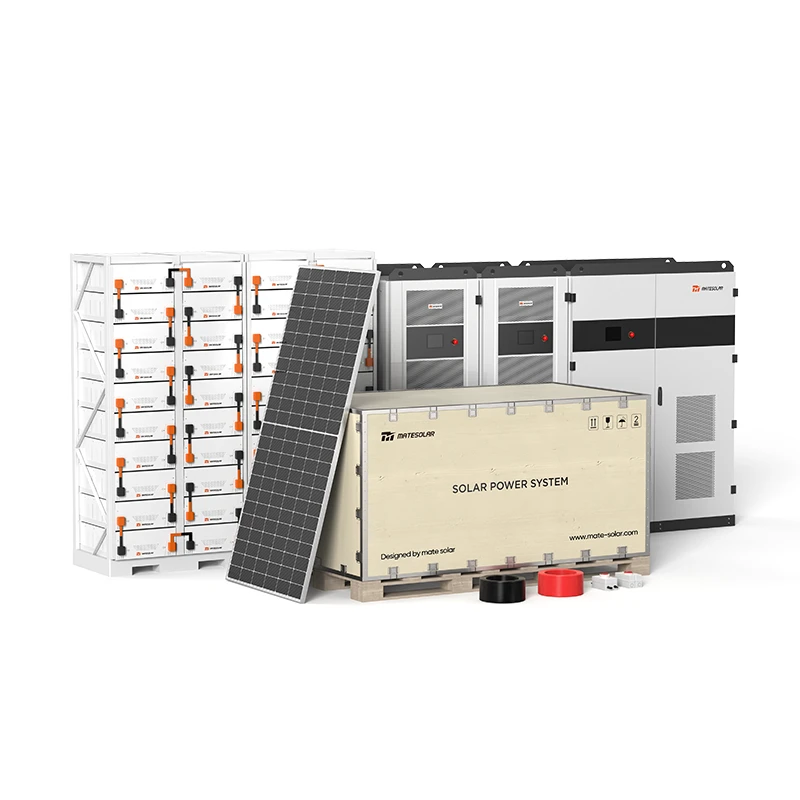
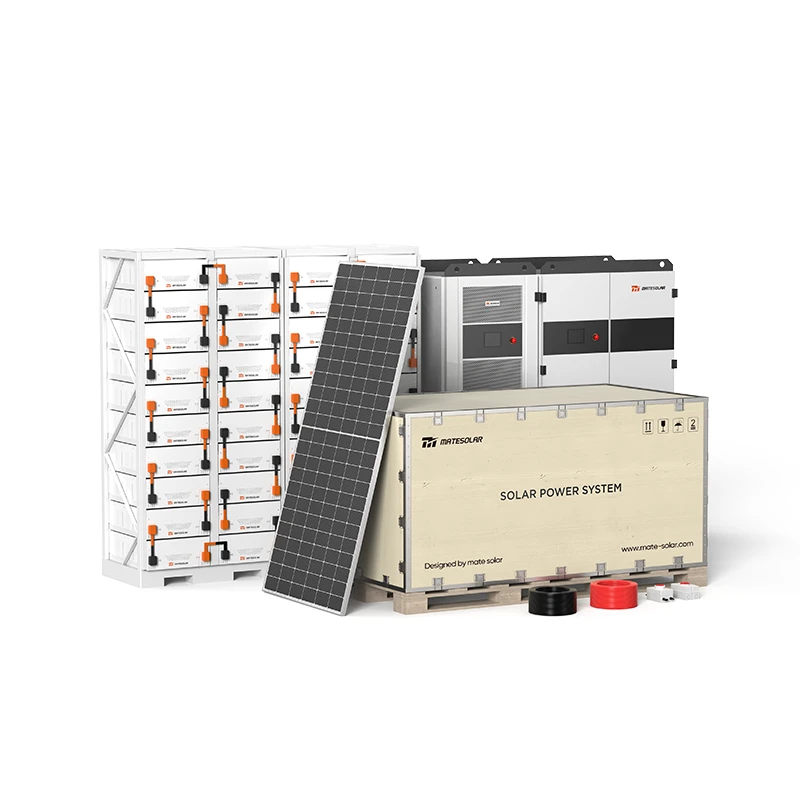
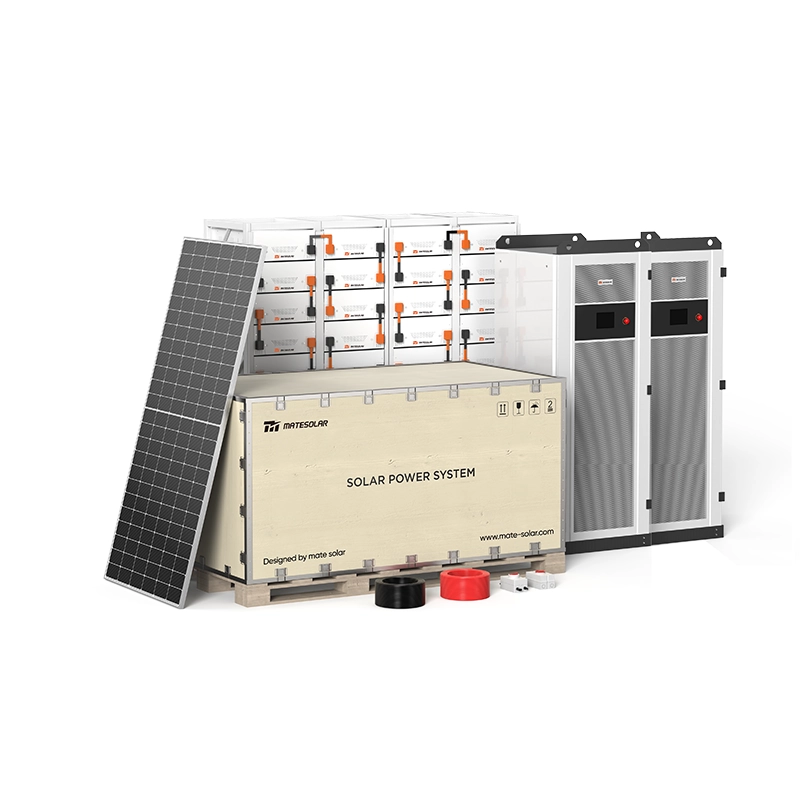
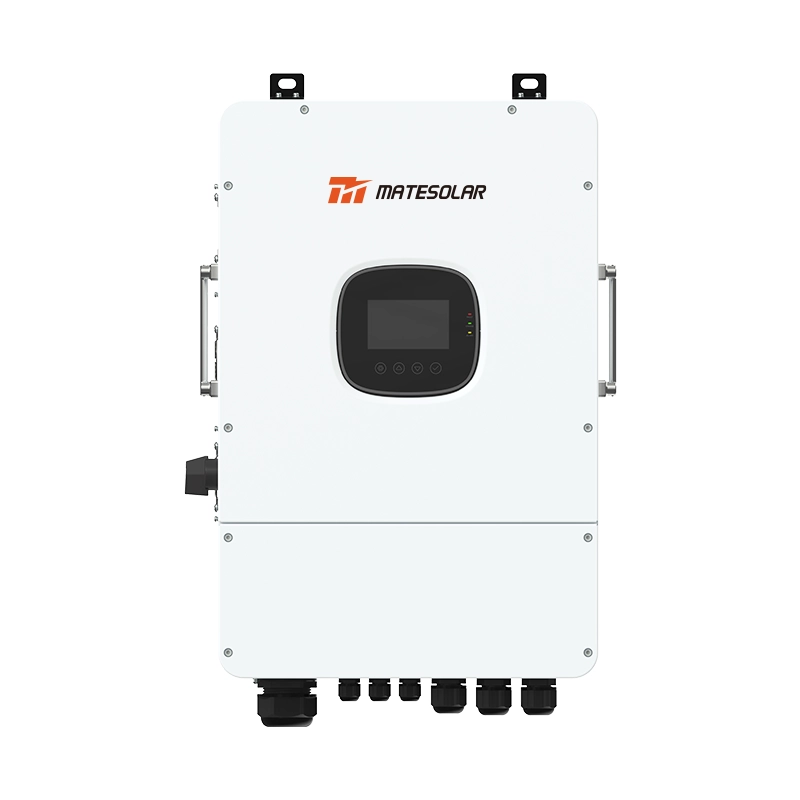
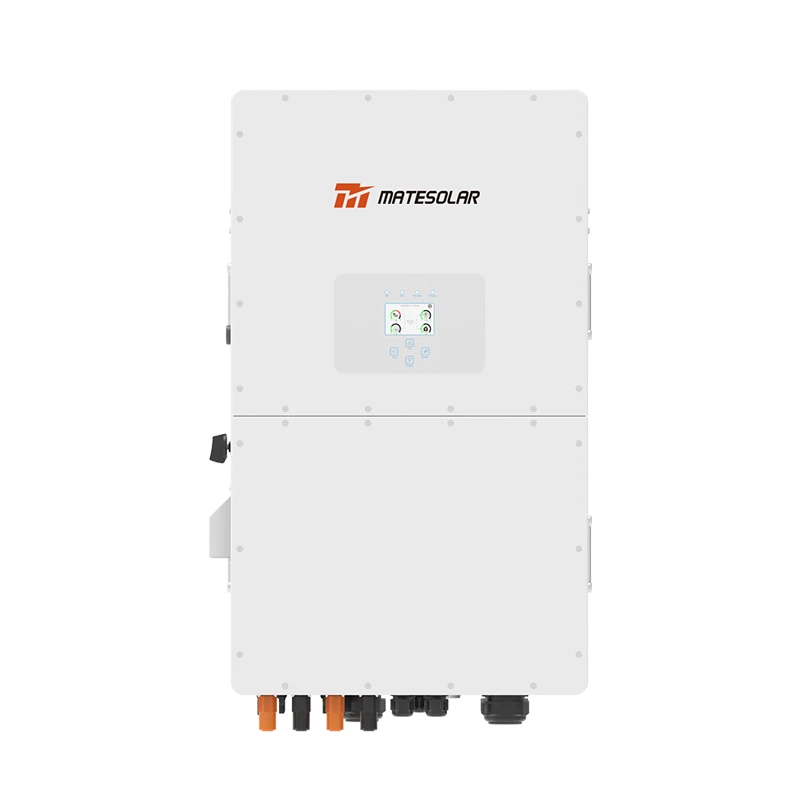
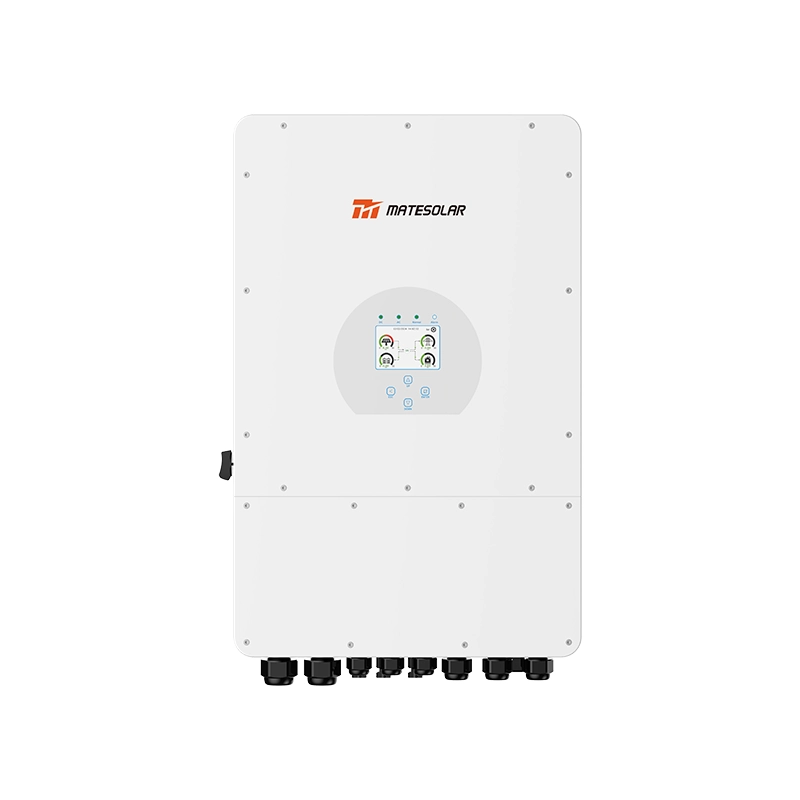
For C&I customers seeking to maximise self-consumption of solar PV while benefiting from storage, integrated solar-plus-storage solutions offer optimal value. A Commercial 500kW Hybrid Solar System represents the sweet spot for many medium-to-large commercial and industrial applications:
- 500 kW solar PV generating approximately 450–500 MWh/year (UK conditions)
- Integrated storage sized to match excess generation and peak demand
- Intelligent energy management optimising self-consumption, demand charge reduction, and wholesale arbitrage
- Single point of responsibility for design, supply, and commissioning
This solution class is particularly well-suited to:
- Manufacturing facilities with daytime operations
- Distribution centres and logistics hubs
- Food processing and cold storage facilities
- Commercial office campuses
- Healthcare facilities
6. Frequently Asked Questions
This section addresses the most common questions from professionals across the photovoltaic and energy storage value chain, providing practical, actionable answers based on the market conditions of August 2026.
Q1: What is the optimal storage duration for UK C&I applications in 2026?
The optimal duration depends on the primary value streams:
| Application | Recommended Duration | Rationale |
| Demand charge reduction | 2–4 hours | Sufficient to shave peak demand periods |
| Solar self-consumption | 4–6 hours | Matches evening demand after solar peak |
| Wholesale arbitrage | 4–8 hours | Captures multi-hour price spreads |
| Backup/resilience | 4–8 hours | Provides meaningful outage protection |
| LDES participation | 8+ hours | Qualifies for LDES support mechanisms |
For most C&I applications, a 4-hour system represents the sweet spot, balancing cost, value stacking potential, and operational flexibility.
Q2: What is the realistic payback period for C&I storage in the UK in 2026?
Payback periods vary significantly based on system size, application, and site-specific factors. Current market data suggests:
| System Size | Typical Payback Period | Primary Value Drivers |
| 100 kWh – 500 kWh | 5–8 years | Demand charge reduction, solar self-consumption |
| 500 kWh – 1 MWh | 4–7 years | Combined BTM value + wholesale arbitrage |
| 1 MWh – 5 MWh | 5–9 years | Wholesale arbitrage + BM participation + BTM value |
| 5 MWh+ | 6–10 years | Complex value stacking, LDES opportunities |
Note: These figures assume current market prices and regulatory conditions. The VAT exemption (until March 2027) significantly improves economics; if the exemption is not extended, payback periods will increase by approximately 20%.
Q3: Should I choose air-cooled or liquid-cooled storage systems?
Both technologies have merit, and the choice depends on application-specific factors:
| Factor | Air-Cooled | Liquid-Cooled |
| Cost | Lower upfront cost | Higher upfront cost |
| Maintenance | Simpler | More complex |
| Noise | Higher | Lower |
| Energy density | Lower | Higher (2–3x) |
| Cycle life | Good | Better (improved temperature control) |
| Space efficiency | Lower | Higher |
| Suitable for | Smaller systems, less constrained sites | Larger systems, space-constrained or noise-sensitive sites |
Recommendation: For UK C&I applications where space is available and noise is not a primary concern, air-cooled systems offer cost-effective performance. For space-constrained or noise-sensitive applications, liquid-cooled systems deliver superior value despite higher upfront cost.
Q4: What is the minimum system size for a viable C&I storage project?
The minimum viable system size depends on the customer's electricity demand and the value streams available:
- Small C&I (50–100 kVA demand): Systems of 50–100 kWh can provide meaningful demand charge reduction
- Medium C&I (100–500 kVA demand): Systems of 100–500 kWh are appropriate
- Large C&I (500+ kVA demand): Systems of 500 kWh–2 MWh or larger
As a general rule, the system should be sized to:
- Reduce peak demand by 10–20% (for demand charge reduction)
- Store 50–100% of average daily solar generation (for self-consumption)
- Provide 4+ hours of operation at rated power
Q5: How has the "Ready to Connect" reform affected C&I storage projects?
The "Ready to Connect" reform affects C&I projects in several ways:
Positive effects:
- Queue rationalisation reduces congestion, potentially shortening connection timelines
- Connection dates are more reliable
- Speculative projects no longer crowd out genuine projects
Negative effects:
- Higher development costs (CMP470 fees)
- Stricter requirements for queue retention
- Potential elimination of projects that cannot demonstrate readiness
Net assessment: For C&I customers who are serious about storage deployment and can demonstrate project maturity, the reform is net positive. It removes competition from speculative projects and creates a more efficient connection process.
Q6: What are the key differences between UK C&I storage and grid-scale storage?
| Factor | C&I Storage | Grid-Scale Storage |
| System size | 100 kWh – 10 MWh | 10 MW – 500 MW+ |
| Connection | Distribution level (behind-the-meter or DNO) | Transmission level |
| Primary value | BTM value (demand charges, self-consumption) | Wholesale arbitrage, BM, ancillary services |
| Revenue certainty | Higher (BTM value is predictable) | Lower (grid revenue is volatile) |
| Planning complexity | Lower (typically within permitted development) | Higher (NSIP for >50 MW) |
| Financing | Simpler (asset finance, operating leases) | Complex (project finance, institutional investment) |
Q7: How do I assess the quality of a storage system provider?
Key criteria for evaluating storage system providers:
| Criterion | What to Look For |
| Cell supplier | Tier 1 manufacturers (CATL, BYD, EVE, etc.) |
| Integration quality | Factory-tested systems, documented quality processes |
| Warranty | Clear warranty terms covering performance and defects |
| UK presence | Local technical support, spare parts availability |
| Track record | Demonstrated project deployments in UK/European conditions |
| Safety certifications | UL 9540A, IEC 62619, UK-specific compliance |
| Software capability | Real-time monitoring, optimisation algorithms, remote troubleshooting |
| Financial stability | Established company with sustainable business model |
Q8: What are the fire safety requirements for C&I storage in the UK?
Fire safety requirements continue to evolve. Key considerations as of August 2026:
| Requirement | Details |
| Planning approval | Required for systems >1 MWh (lithium-ion) |
| BS 7671 Amendment 4 (April 2026) | AC/DC isolation points, firefighter safety labelling |
| NFCC Grid-Scale BESS Planning Guide (2026) | Tightened fire safety standards |
| Local fire authority approval | Adds 4–8 months to project timelines |
| Recommended safety features | Fire suppression, gas detection, thermal monitoring, isolation capability |
Q9: Can I combine solar PV and storage in a single project?
Yes — and in fact, this is the recommended approach for most C&I applications. Combined solar-plus-storage offers:
| Benefit | Explanation |
| Enhanced self-consumption | Storage captures excess solar generation for later use |
| Single grid connection | Shared connection reduces costs |
| Streamlined planning | Combined projects often benefit from simplified approval processes |
| Improved economics | Combined value stacking improves overall project returns |
| Single point of responsibility | One provider for design, supply, and commissioning |
For medium-to-large C&I applications, a Commercial 500kW Hybrid Solar System with integrated storage represents a proven solution architecture.
Q10: What happens after the VAT exemption expires in March 2027?
The future of the VAT exemption is uncertain. Three scenarios:
| Scenario | Implication |
| Exemption extended | No change; storage costs remain 20% lower |
| Exemption replaced with reduced rate | Partial cost increase (e.g., 5–10%) |
| Exemption ended | Full 20% cost increase; payback periods extend by ~20% |
Recommendation: C&I customers considering storage projects should factor this uncertainty into their planning. Projects that can be completed before March 2027 will benefit from the current exemption. Projects planned for after this date should build in contingency for potential cost increases.
Q11: How do I choose between outdoor cabinets and containerised systems?
| Factor | Outdoor Cabinet | Containerised System |
| Capacity range | 100 kWh – 2 MWh | 1 MWh – 5 MWh+ |
| Footprint | Smaller (1.35 m² per cabinet) | Larger (container footprint) |
| Installation speed | Fast (<2 hours per cabinet) | Fast (pre-assembled) |
| Scalability | Modular, add cabinets as needed | Add containers as needed |
| Space constraints | Better for tight spaces | Requires more space |
| Noise sensitivity | Liquid-cooled options available | Air or liquid-cooled options |
| Maintenance | Cabinet-level maintenance | Container-level maintenance |
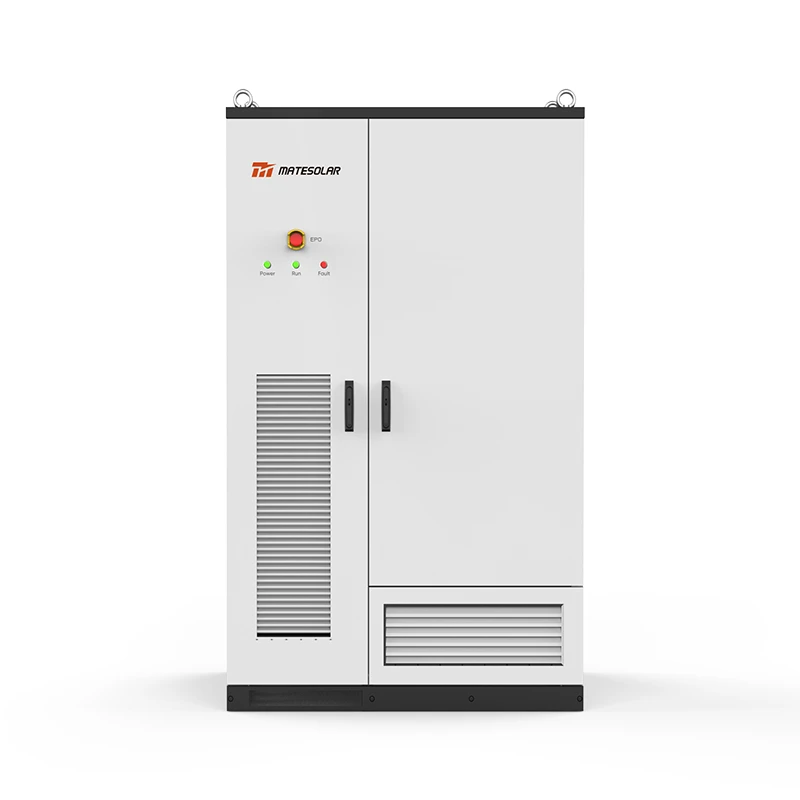
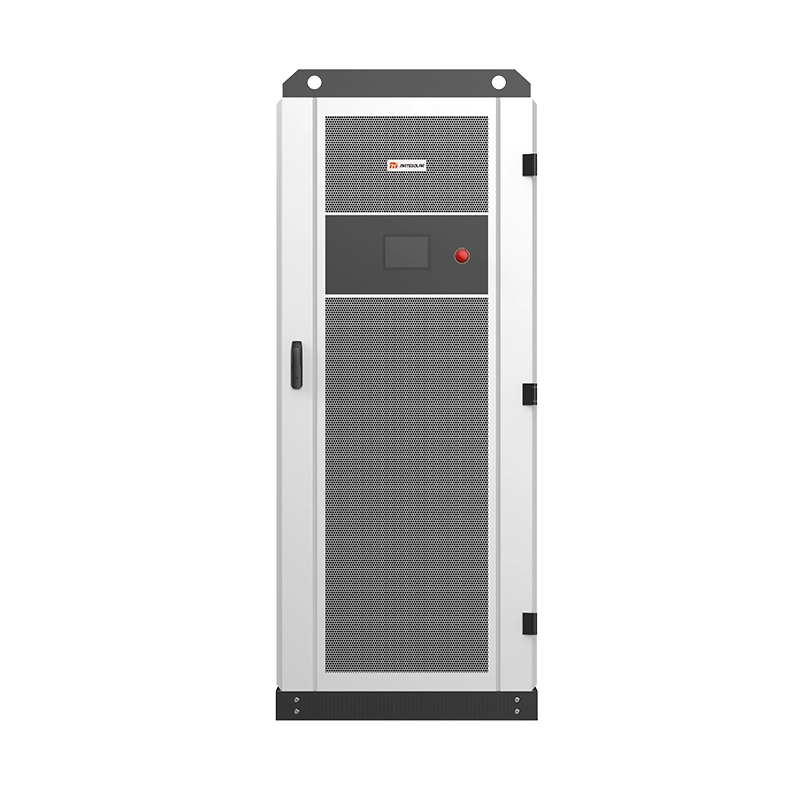
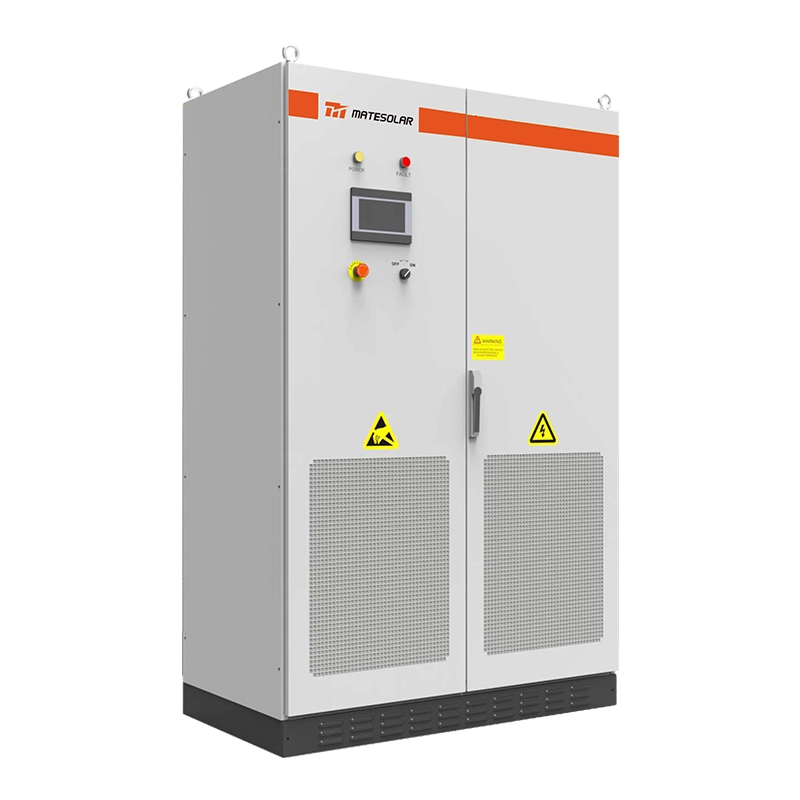
For customers seeking rapid deployment in space-constrained environments, outdoor cabinet products like the 125kW/261kWh Liquid-Cooled Outdoor Cabinet Energy Storage System offer compelling value. For larger applications requiring 1–5 MWh, containerised solutions like the 40Ft 1MWh/2MWh Air-Cooled Container ESS or the 20ft 3MWh/5MWh Liquid Cooling Container Energy Storage System provide proven performance.
Q12: What is the current state of LDES support for C&I projects?
The LDES "cap and floor" mechanism (Section 2.4) supports storage projects with extended durations:
- Eligible duration: Typically 6+ hours
- First window (2026): 16 projects supported (7.6 GW / 137 GWh)
- Ultra-LDES Challenge: £28 million for 100+ hour technologies
- C&I opportunity: 4–8 hour systems represent £20–30 billion market
Assessment: For C&I projects with 8+ hour duration capability, the LDES mechanism provides meaningful revenue support. However, for most C&I applications (4-hour duration), LDES support is not directly applicable.
Q13: How important is software and optimisation capability for C&I storage?
Software capability is critical — and increasingly the primary differentiator between successful and unsuccessful projects:
| Capability | Importance | Rationale |
| Real-time optimisation | Essential | Maximises value from wholesale arbitrage and BTM streams |
| Predictive analytics | High | Anticipates demand patterns and price movements |
| Remote monitoring | Essential | Enables rapid issue identification and resolution |
| Integration with EMS | High | Enables coordinated operation with building systems |
| Automated dispatch | Essential | Responds to market signals without manual intervention |
| Reporting and analytics | Important | Demonstrates value and supports decision-making |
Q14: What is the outlook for storage system prices in 2026–2027?
| Component | 2026 Price | 2027 Projection | Trend |
| LFP cells | £60–80/kWh | £50–70/kWh | Declining |
| Complete systems (cabinet) | £180–250/kWh | £160–220/kWh | Declining |
| Complete systems (container) | £150–220/kWh | £140–200/kWh | Declining |
| Installation (C&I) | £30–60/kWh | £30–55/kWh | Stable |
Note: Prices are indicative and vary based on system size, specifications, and supplier. The VAT exemption (if not extended) will increase effective prices by 20% from April 2027.
Q15: What are the most common mistakes in C&I storage projects?
| Mistake | Consequence | How to Avoid |
| Oversizing system | Poor economics, extended payback | Conduct detailed load analysis before sizing |
| Ignoring fire safety requirements | Project delays, redesign costs | Engage fire authorities early |
| Underestimating noise impact | Planning objections, project rejection | Conduct acoustic assessment early |
| Neglecting BTM value | Suboptimal system design, reduced returns | Model all value streams, not just grid revenue |
| Choosing wrong cooling technology | Reduced performance, higher maintenance | Match cooling technology to site conditions |
| Inadequate software | Suboptimal dispatch, reduced revenue | Prioritise software capability in provider selection |
7. Conclusion: The Path Forward for UK C&I Storage
The UK commercial and industrial energy storage market in August 2026 stands at an inflection point. The market has matured beyond its infancy, with 12.7 GW of installed capacity, a reformed grid connection regime, and revenue models that have fundamentally restructured. The path forward requires a new approach — one that acknowledges the collapse of frequency response revenue, the rationalisation of the grid queue, and the shift toward solution-oriented competition.
For C&I customers, the opportunity is clear: storage deployed behind the meter offers predictable, reliable value through demand charge reduction, solar self-consumption optimisation, and network charge avoidance. The challenge is equally clear: navigating a complex regulatory landscape, selecting appropriate technology, and building revenue models that are robust to market evolution.
The nine critical problems outlined in this guide — from the 91 GW queue vs. 29 GW target mismatch to the fire safety approval timeline — are not insurmountable. They require preparation, technical sophistication, and the right partnerships. Customers who engage early, right-size their projects, and prioritise solution quality over upfront price will succeed. Those who delay, under-invest in optimisation capability, or select inappropriate technology will struggle.
The market will continue to evolve. The CMP470 decision, expected from Ofgem in August 2026, will further reshape the connection queue. The fate of the VAT exemption beyond March 2027 remains uncertain. The LDES mechanism will mature. And the supply chain will continue to diversify as European and UK manufacturing capacity comes online.
What will not change is the fundamental value proposition of storage for C&I customers: the ability to control energy costs, maximise the value of on-site solar generation, and contribute to a decarbonised electricity system. The products and solutions available today — from compact outdoor cabinets delivering 233–261 kWh in 1.35 m² to containerised systems delivering up to 5 MWh in a 20ft footprint — provide the technical foundation for success. The remaining challenge is execution.
For organisations seeking to deploy commercial-scale solar-plus-storage solutions, MateSolar provides end-to-end support as a one-stop photovoltaic and energy storage solution provider. From system design and product selection to supply chain coordination and technical guidance, MateSolar supports customers through every phase of project development, ensuring that C&I storage investments deliver maximum value in the evolving UK market.
MateSolar is a one-stop photovoltaic and energy storage solution provider, offering a comprehensive range of solar PV and battery storage products tailored to the needs of commercial and industrial customers. Our product portfolio includes commercial hybrid solar systems, liquid-cooled outdoor cabinet storage solutions, and air-cooled or liquid-cooled containerised systems for applications ranging from 100 kWh to 5 MWh and beyond. We support customers through the full project lifecycle — from system design and product selection to supply chain coordination and technical guidance — ensuring successful deployment in the dynamic UK energy market.