










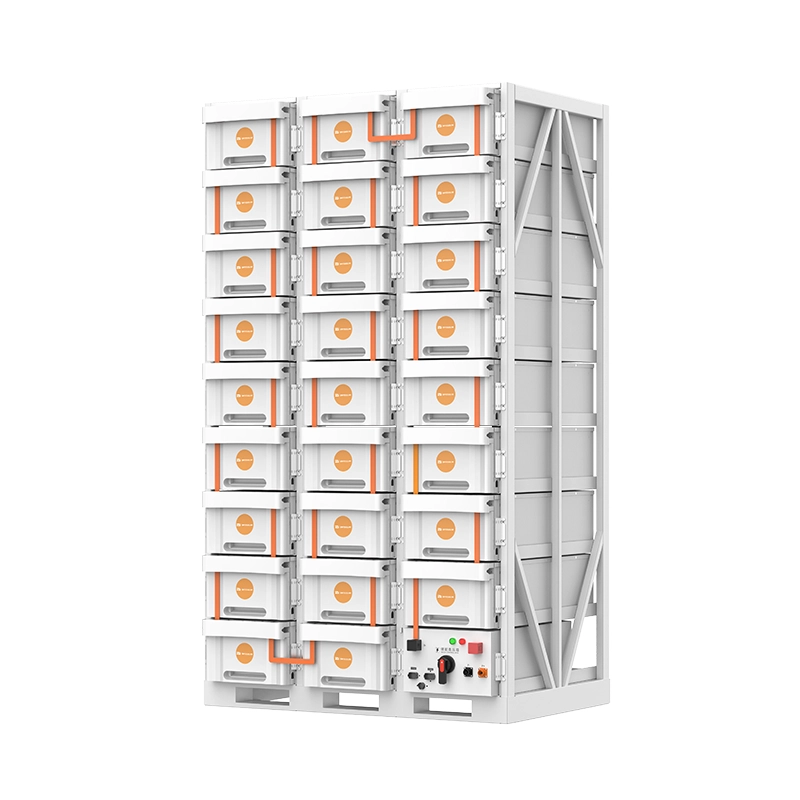
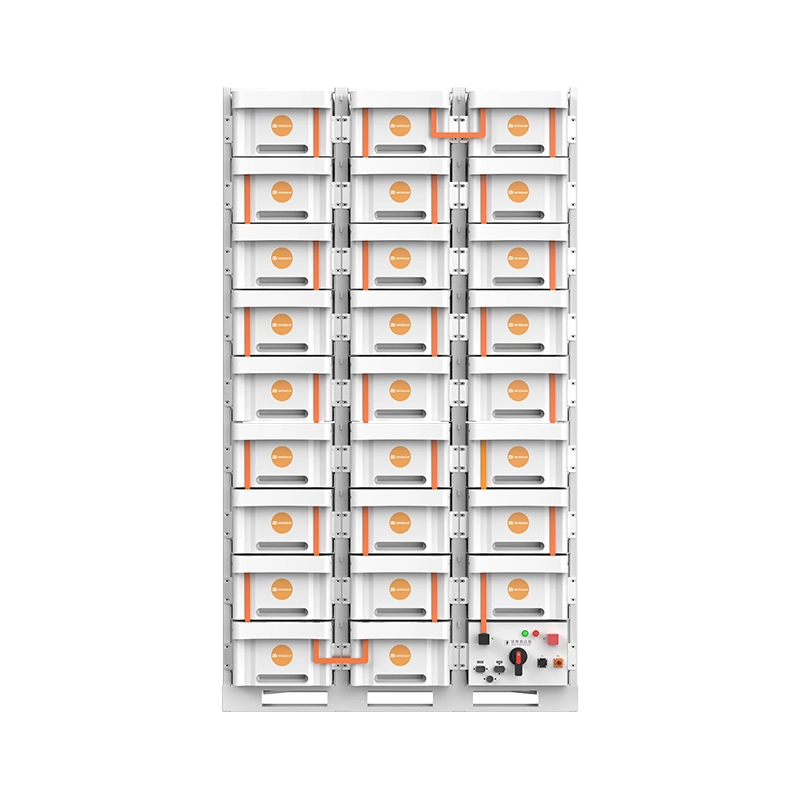
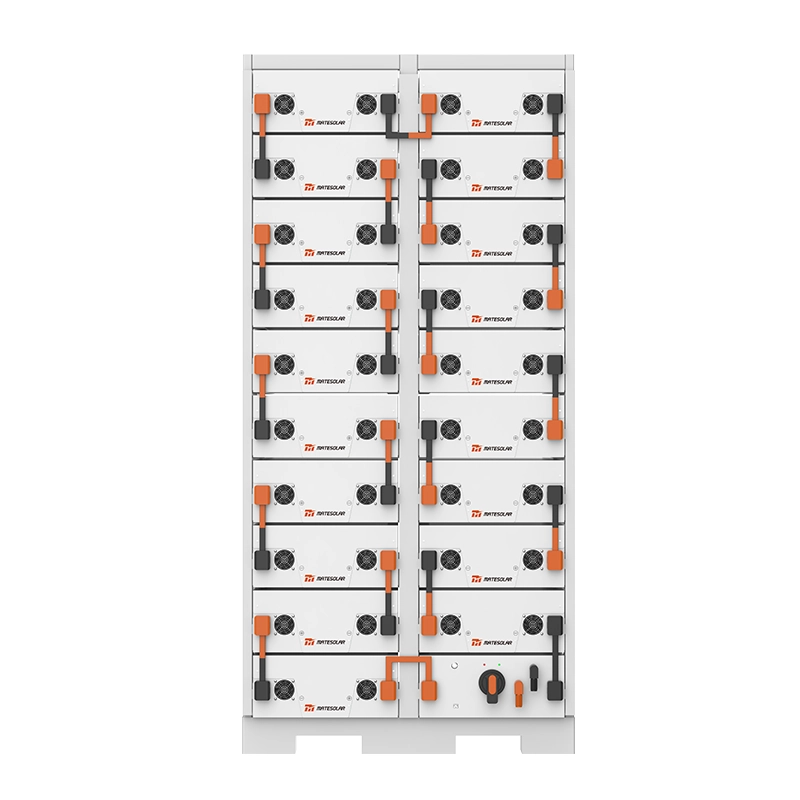
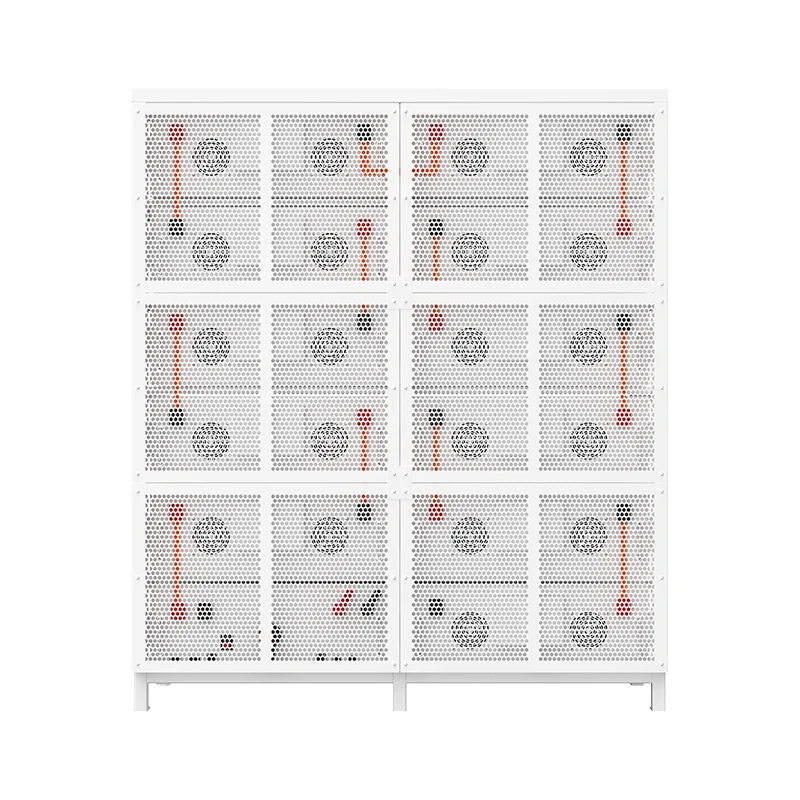
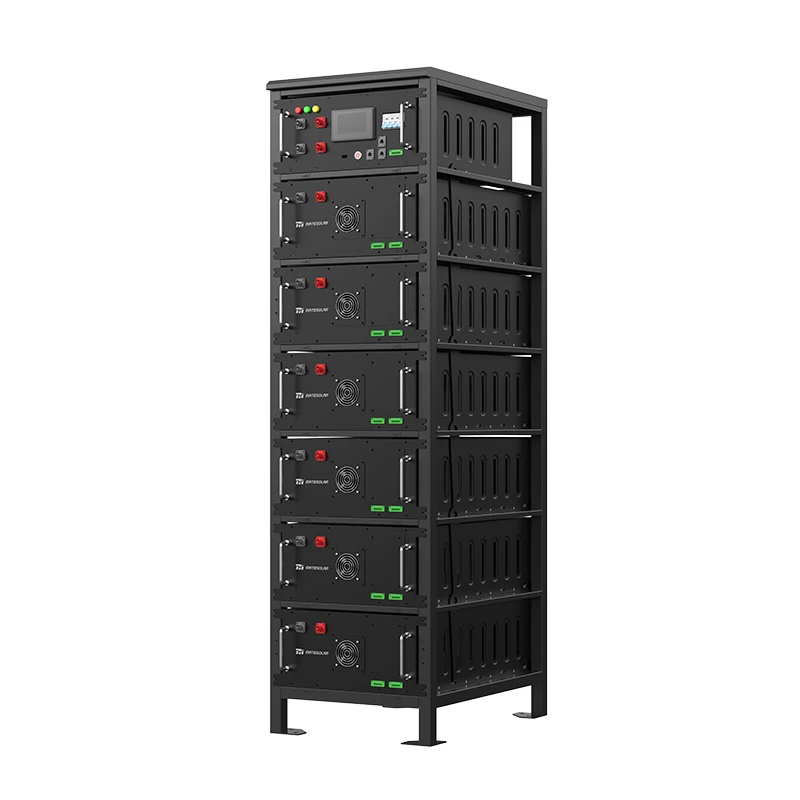
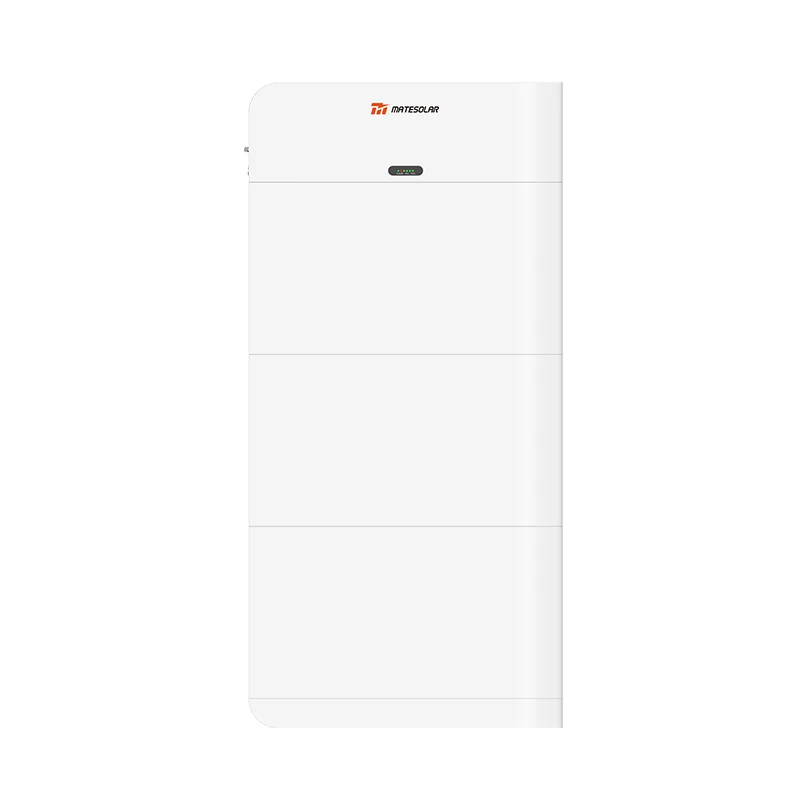
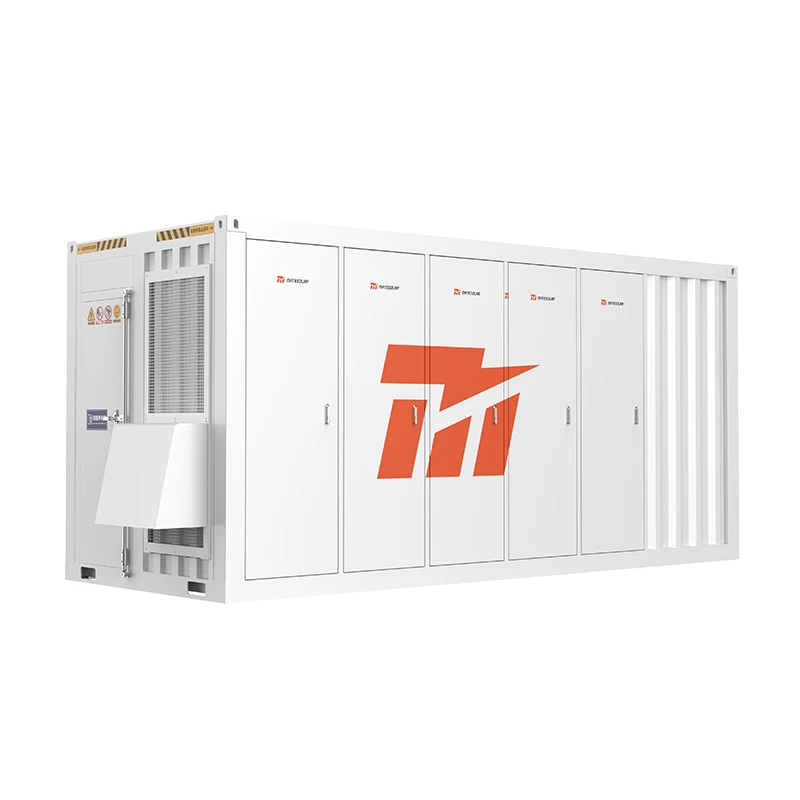
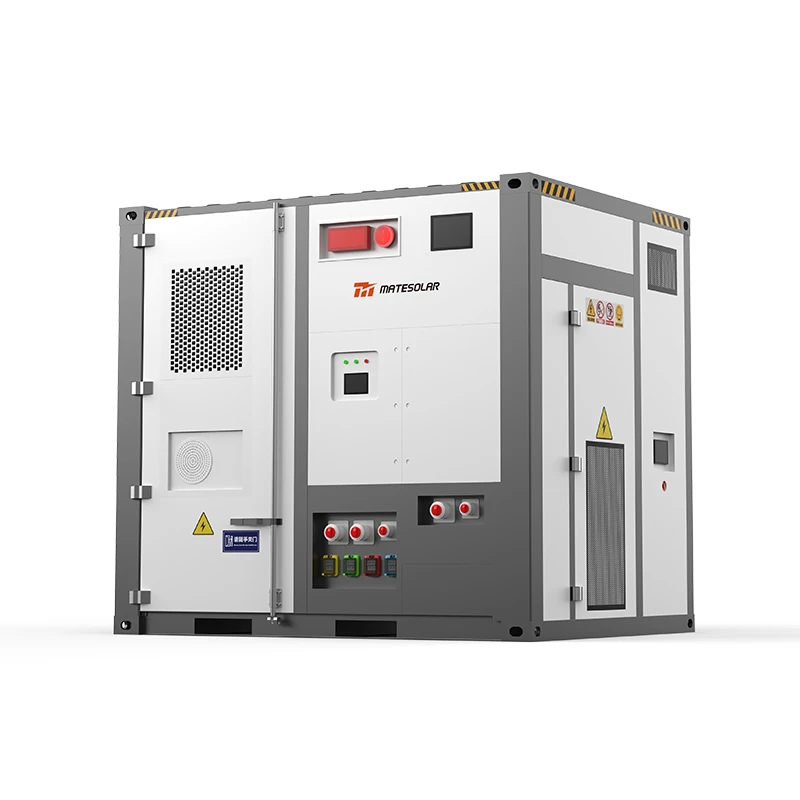







El Reino Unido ha consolidado su posición como el mercado de almacenamiento de energía más maduro, con mayor potencial de inversión y más complejo desde el punto de vista estructural de Europa. A fecha de agosto de 2026, el mercado de almacenamiento de energía del Reino Unido ha alcanzado una capacidad instalada acumulada de 12,7 GW, con un crecimiento interanual de las incorporaciones de sistemas de almacenamiento de energía en baterías (BESS) a escala de red de 45% en 2025 —aproximadamente 4 GWh de nueva capacidad—, lo que eleva la capacidad operativa total a 12,9 GWh. Las previsiones indican que el mercado se expandirá hasta los 58,8 GW en 2034, lo que representa una tasa de crecimiento anual compuesta (CAGR) del 18,03%.
Sin embargo, bajo estas cifras principales se esconde un mercado en plena transformación fundamental. La era de los ingresos fáciles por respuesta a frecuencia ha terminado. La cola de acceso a la red —que en su día superaba los 800 GW con proyectos especulativos— se está racionalizando de manera agresiva mediante las reformas "Ready to Connect". Los precios de adjudicación del mercado de capacidad se han desplomado de 75 £/kW a 5 £/kW. Y los clientes comerciales e industriales (C&I) se enfrentan ahora a un panorama en el que el éxito no depende únicamente del acceso al capital, sino de la sofisticación en la modelización de ingresos, la diferenciación técnica y la capacidad para navegar por un entorno regulatorio cada vez más complejo.
Para los integradores fotovoltaicos, contratistas EPC, gestores energéticos y usuarios finales C&I, las preguntas ya no son si para desplegar almacenamiento, pero cómo para implementarlo de forma rentable, cuál plataformas tecnológicas para estandarizar y Qué las estrategias de ingresos seguirán siendo viables durante una vida útil de los activos de 15 años.
Esta guía, elaborada por el departamento de inteligencia de mercado de MateSolar, ofrece un análisis exhaustivo y basado en datos del mercado de almacenamiento de energía comercial e industrial en el Reino Unido en su estado actual de agosto de 2026. Aborda nueve desafíos críticos a los que se enfrenta la industria, proporciona marcos prácticos para la toma de decisiones, incluye tablas de especificaciones técnicas para las soluciones de armarios para exteriores y contenedores disponibles actualmente, y ofrece respuestas a las preguntas más frecuentes de los profesionales de toda la cadena de valor fotovoltaica y de almacenamiento de energía.
Índice
1. El mercado de almacenamiento C&I en el Reino Unido en agosto de 2026: Estado actual
2. Entorno político y regulatorio: Las cinco fuerzas que remodelan el mercado
3. Despliegues de proyectos recientes: Cómo es el éxito en 2026
4. Los nueve problemas críticos a los que se enfrentan los clientes de almacenamiento C&I y cómo resolverlos
5. Matriz técnica de productos: Armarios para exteriores y sistemas en contenedores
6. Preguntas frecuentes
7. Conclusión: El camino a seguir para el almacenamiento C&I en el Reino Unido
1. El mercado de almacenamiento C&I en el Reino Unido en agosto de 2026: Estado actual
1.1 Dimensión y trayectoria del mercado
El mercado del almacenamiento de energía del Reino Unido ha pasado de forma decisiva de una fase incipiente a otra caracterizada por la escala, la reforma estructural y la madurez financiera. La capacidad total de almacenamiento instalada, de 12,7 GW, sitúa al Reino Unido por delante de todos los demás países europeos en términos absolutos, y solo Alemania se acerca a niveles comparables de desarrollo del mercado. El crecimiento interanual de 45% en la capacidad de los sistemas de almacenamiento de energía en batería (BESS) a escala de red durante 2025 —lo que supone un aumento de aproximadamente 4 GWh— pone de relieve el ritmo de implantación que se está produciendo actualmente.
La trayectoria de crecimiento es igualmente llamativa. Se prevé que el mercado del Reino Unido alcance los 58,8 GW para 2034, una cifra que abarca los activos a escala de red, conectados a la distribución y tras el contador (BTM). Esto representa una expansión de 4,6 veces durante la próxima década, impulsada por cuatro fuerzas simultáneas:
1. El mandato Clean Power 2030 que requiere entre 23 y 27 GW de capacidad de baterías a escala de red para 2030
2. Electrificación de la calefacción y el transporte creando nuevos perfiles de demanda que el almacenamiento debe atender
3. Compromisos corporativos de cero emisiones netas impulso al despliegue detrás del contador en el sector comercial e industrial
4. La retirada de la generación térmica convencional creando una volatilidad estructural de los precios al por mayor que el almacenamiento pueda monetizar
Dentro de este mercado más amplio, el segmento comercial e industrial (C&I) representa uno de los subsectores más dinámicos y de mayor crecimiento. Se proyecta que el despliegue anual de almacenamiento C&I crezca desde aproximadamente 1 GWh por año en 2026 hasta entre 5 y 8 GWh por año para 2035. Este crecimiento está respaldado por la electrificación de los procesos de calor industrial, la rápida expansión de la infraestructura de carga para vehículos eléctricos comerciales y los compromisos corporativos con operaciones de emisiones netas cero que cada vez requieren más activos de flexibilidad in situ.
El mercado de almacenamiento estacionario BTM —que incluye todo el almacenamiento implementado detrás de los contadores de los clientes para la optimización del autoconsumo, la reducción de los cargos por demanda y la resiliencia— proyecta alcanzar un valor de sistema instalado de entre 18.000 y 22.000 millones de libras en 2026, expandiéndose a entre 65.000 y 85.000 millones de libras para 2035. Esto representa una de las oportunidades de creación de valor más significativas en el sector energético europeo.
1.2 La tensión estructural central: Desajuste entre oferta y demanda
A pesar de las impresionantes cifras principales, el mercado de almacenamiento del Reino Unido en agosto de 2026 se define por una tensión fundamental que lo distingue de mercados comparables en Alemania o Texas: un profundo desajuste entre el volumen de proyectos que buscan conexión y la demanda real de servicios de flexibilidad.
La cola de conexión a la red —el conjunto de proyectos que esperan conexiones a la red de transporte o distribución— se ha caracterizado históricamente por un enfoque de "llegada por orden de solicitud" que fomentaba las solicitudes especulativas con un compromiso mínimo. Esto dio lugar a una cola que superaba los 800 GW de capacidad propuesta, cuya gran mayoría no tenía ninguna perspectiva realista de alcanzar el cierre financiero o la construcción.
La reforma de esta lista de espera —que se detalla ampliamente en la sección 2— ha reducido drásticamente el número de proyectos en tramitación. A fecha de 10 de junio de 2026, el Operador Nacional del Sistema Energético (NESO) ha emitido ofertas de conexión a 713 proyectos que abarcan 37 GW de nueva capacidad renovable y de sistemas de almacenamiento de energía por batería (BESS). Esto representa el 58% de los proyectos de la cartera previa a 2030.
Sin embargo, incluso esta lista de espera reformada plantea retos. La lista de espera de Gate 2 para proyectos de baterías —que han superado las fases iniciales de solicitud— asciende actualmente a 91 GW, mientras que el objetivo de «Clean Power 2030» solo requiere 29 GW. Esto significa que, incluso entre los proyectos que han superado los primeros obstáculos, aproximadamente 68% no serán necesarios para cumplir los objetivos nacionales y deberán competir por su viabilidad comercial en un mercado cada vez más saturado.
Las implicaciones para los clientes comerciales e industriales son significativas. Los proyectos que están "listos para construir" —con derechos sobre la tierra asegurados, aprobaciones de planificación completadas, acuerdos de conexión a la red firmados y madurez técnica demostrada— recibirán cada vez más un trato preferencial. Los proyectos que sean especulativos, estén subcapitalizados o sean técnicamente inmaduros serán marginados mediante una combinación de presión regulatoria, tarifas de reforma de cola y dinámicas competitivas.
1.3 Transformación del modelo de ingresos: de los servicios complementarios al arbitraje mayorista
El cambio más significativo en el mercado de almacenamiento del Reino Unido en los últimos 24 meses ha sido la reestructuración fundamental de los modelos de ingresos. Esta transformación es tan importante que merece un examen detallado.
El colapso de los ingresos por respuesta de frecuencia
Entre 2020 y 2023, los servicios de respuesta a la frecuencia —en particular, la contención dinámica, la moderación dinámica y la regulación dinámica— constituyeron la principal fuente de ingresos para las instalaciones de almacenamiento en baterías del Reino Unido. Durante este periodo, la respuesta de frecuencia podría representar entre el 60 % y el 80% de los ingresos totales de los proyectos, con precios de liquidación excepcionalmente elevados debido a la escasez de capacidad de respuesta.
Esta dinámica se ha invertido por completo. La afluencia masiva de capacidad de sistemas de almacenamiento de energía por baterías (BESS) —12,9 GWh en funcionamiento a partir de 2026— ha saturado el mercado de la respuesta de frecuencia. Los ingresos procedentes de los servicios de respuesta de frecuencia representan ahora aproximadamente el 20% de los ingresos medios de los proyectos, lo que supone un descenso respecto a su predominio histórico. El precio de estos servicios ha caído hasta niveles en los que representan una fuente de ingresos complementaria, en lugar de principal.
El auge del arbitraje mayorista y el mecanismo de balance
La brecha de ingresos dejada por el colapso de la respuesta de frecuencia ha sido cubierto por dos fuentes que antes eran contribuyentes marginales:
- Arbitraje de precios al por mayor: recarga durante los periodos de precios al por mayor bajos (normalmente durante la noche y en los picos solares del mediodía) y descarga durante los picos vespertinos de precios altos. Esto representa ahora la mayor fuente de ingresos individual para muchos activos, y la combinación del arbitraje y la participación en el mecanismo de equilibrio aporta aproximadamente el 50% de los ingresos medios del proyecto, frente a solo el 8% en 2022.
- Participación en el Mecanismo de Balance (BM): El BM, administrado por NESO para conciliar la generación y la demanda en tiempo real, ofrece precios prémium por la flexibilidad durante los períodos de tensión en el sistema. Los activos registrados como participantes del BM pueden acceder a estos ingresos, aunque la participación requiere sofisticación técnica y capacidad operativa.
La disminución de los ingresos del mercado de capacidad
El Mercado de Capacidad, diseñado para garantizar la seguridad del suministro durante los periodos de máxima demanda, ha proporcionado históricamente un piso de ingresos importante para los activos de almacenamiento. Los nuevos activos de sistemas de almacenamiento de energía en baterías (BESS, por sus siglas en inglés) son elegibles para acuerdos de 15 años en el Mercado de Capacidad, lo que proporciona una certeza de ingresos que respalda la financiación de los proyectos.
Sin embargo, los precios de adjudicación del Mercado de Capacidad han experimentado un descenso drástico:
- subasta 2022/23: £75/kW/año
- subasta 2026/27: 5 £/kW/año
Esto supone un descenso de 93% en los ingresos del mercado de capacidad a lo largo de cuatro ciclos de subasta. Aunque la duración del acuerdo, de 15 años, sigue aportando cierto valor financiero, la contribución absoluta a los ingresos se ha reducido hasta niveles casi insignificantes para muchos proyectos.
Implicaciones para los clientes comerciales e industriales
La transformación de los ingresos tiene profundas implicaciones para las decisiones de despliegue de almacenamiento C&I:
1. La acumulación de valor es esencialNinguna fuente de ingresos por sí sola es suficiente para respaldar un proyecto viable. Los clientes deben construir modelos de ingresos que combinen arbitraje mayorista, participación en el mecanismo de balance, reducción de cargos por demanda, optimización del autoconsumo y servicios de flexibilidad emergentes.
2. El valor detrás del contador es cada vez más importantePara los clientes comerciales e industriales (C&I), el valor del almacenamiento va más allá de los ingresos de la red e incluye los cargos de red evitados (DUoS, Triad y cargos por capacidad), el autoconsumo de energía solar fotovoltaica in situ y los beneficios de resiliencia. Estos valores detrás del contador (BTM) suelen ser más predecibles que los ingresos de la red y deben priorizarse en la economía del proyecto.
3. La sofisticación operativa es una ventaja competitivaLa transición hacia el arbitraje mayorista y los ingresos del mecanismo de balance requiere algoritmos de optimización sofisticados, conocimiento del mercado en tiempo real y la capacidad de responder a las señales de despacho de NESO. Los proyectos de almacenamiento que carezcan de esta capacidad operativa tendrán un rendimiento inferior.
1.4 Resumen de estadísticas clave del mercado
| Métrica | Valor | Contexto |
| Capacidad total de almacenamiento en el Reino Unido (2025) | 12,7 GW | El mercado de almacenamiento más grande de Europa |
| Capacidad operativa de los sistemas de almacenamiento de energía en baterías (BESS) a escala de red (2025) | 12,9 GWh | Crecimiento interanual del 45%, con una incorporación de aproximadamente 4 GWh |
| Tamaño de mercado proyectado (2034) | 58,8 GW | 18,031 TP3T: tasa de crecimiento anual compuesto a partir de 2024 |
| Despliegue anual C&I (2026) | ~1 GWh/año | Proyectado de 5 a 8 GWh/año para 2035 |
| Valor del sistema instalado de BTM (2026) | £18.000–22.000 millones | Proyectado entre 65.000 y 85.000 millones de libras esterlinas para 2035 |
| Cola de baterías de la puerta 2 | 91 GW | frente al objetivo de 29 GW de energía limpia para 2030 |
| Precio de corte del mercado de capacidad (2026/27) | £5/kW | Bajando de 75 £/kW en 2022/23 |
| reparto de ingresos por respuesta de frecuencia | ~20% | Por debajo del máximo histórico de 60–80% |
| Arbitraje al por mayor + participación en los ingresos de BM | ~50% | Un aumento respecto a los ~81 TP3T de 2022 |
2. Entorno político y regulatorio: Las cinco fuerzas que remodelan el mercado
El marco regulatorio del Reino Unido para el almacenamiento de energía está experimentando su transformación más significativa en décadas. Cinco acontecimientos normativos están remodelando el panorama del mercado, cada uno con implicaciones directas para las decisiones de despliegue de almacenamiento comercial e industrial (C&I).
2.1 Energía Limpia 2030: El mandato que lo impulsa todo
El Plan de Acción Clean Power 2030, publicado por el gobierno del Reino Unido, establece uno de los objetivos de transición energética más ambiciosos del mundo: lograr un sistema eléctrico totalmente descarbonizado para 2030. Dentro de este marco, el almacenamiento de baterías a escala de red tiene un papel claramente definido:
Meta: 23-27 GW de capacidad de almacenamiento en baterías a escala de red para 2030
Estado actual:
- 5 GW de capacidad de batería se ha construido en los últimos cinco años
- ~20 GW se debe construir capacidad adicional en los próximos cinco años
- 160 GWh de los proyectos de sistemas de almacenamiento de energía en baterías (BESS) han obtenido la aprobación de planificación
- ~22 GWh están actualmente en construcción
- ~13 GWh ya están operativos
La magnitud del desafío es evidente: el Reino Unido debe desplegar aproximadamente cuatro veces más capacidad de baterías en los próximos cinco años que en los cinco anteriores. Esto genera tanto oportunidades como presión. La oportunidad radica en el enorme volumen de proyectos que deben llevarse a cabo. La presión radica en el cronograma comprimido y la tensión correspondiente en las cadenas de suministro, las conexiones a la red y la capacidad de financiación.
Para los clientes comerciales e industriales (C&I), Clean Power 2030 tiene implicaciones indirectas pero significativas. A medida que el almacenamiento a escala de red aumente, es probable que aumente la volatilidad en los precios mayoristas de la electricidad que el almacenamiento de C&I puede monetizar, lo que creará tanto desafíos (picos de precios más altos) como oportunidades (mayor potencial de arbitraje). Además, el enfoque político en el almacenamiento a escala de red puede influir en los acuerdos de tarificación de la red y en los mercados de flexibilidad de maneras que beneficien o perjudiquen a los activos detrás del contador.
2.2 Reforma de la conexión a la red: "Listo para conectar" reemplaza a "Primero en llegar, primero en ser atendido"
El cambio regulatorio más significativo en el sector energético del Reino Unido en décadas.
Históricamente, la cola de conexión a la red del Reino Unido funcionaba según el principio de "por orden de llegada". Los proyectos solicitaban la conexión, obtenían un puesto en la cola y podían mantenerlo indefinidamente con un compromiso mínimo. Esto creó una cola que superaba los 800 GW, más de diez veces la capacidad realmente necesaria.
Bajo el nuevo marco "Ready to Connect", administrado por NESO:
- Los proyectos deben demostrar avances en la planificación (obtención de las aprobaciones de planificación necesarias).
- Los proyectos deben demostrar derechos sobre la tierra (control legal sobre el sitio del proyecto)
- Los proyectos deben demostrar coherencia estratégica (alineación con los objetivos energéticos nacionales).
- Los proyectos que no puedan cumplir con estos umbrales se eliminan de la cola o se les asignan fechas de conexión posteriores.
Progreso hasta la fecha:
A fecha de 10 de junio de 2026, NESO ha emitido ofertas de conexión a 713 proyectos que abarcan 37 GW de nueva capacidad renovable y de sistemas de almacenamiento de energía en baterías (BESS). Esto representa el 58% de la cartera de proyectos previstos para antes de 2030.
La reducción de la cola ha sido drástica. Desde un máximo de más de 800 GW, la cartera activa se ha reducido en más de la mitad. Esta racionalización tiene importantes implicaciones:
1. Calidad sobre cantidadSe está priorizando a los proyectos que están verdaderamente listos —con terreno, planificación y madurez técnica—. Se están eliminando los proyectos especulativos.
2. Las fechas de conexión son cada vez más confiablesCon menos proyectos especulativos en la cola, las fechas de conexión ofrecidas por NESO son cada vez más confiables. Los proyectos pueden planificar con mayor certeza.
3. La competencia entre proyectos maduros se intensificaCon la cola racionalizada, los proyectos "reales" restantes se enfrentan a una competencia más clara. La diferenciación a través de la calidad técnica, la viabilidad comercial y la capacidad de ejecución cobra mayor importancia.
2.3 CMP470: La reforma de los cargos de la cola de conexión a la red
El desarrollo normativo más importante de julio de 2026.
La modificación CMP470 introduce una nueva estructura de cobro para las posiciones en la cola de conexión a la red. El elemento clave es la Tarifa de Compromiso Técnico por Exceso (OTCF, por sus siglas en inglés), una tarifa que los desarrolladores deben pagar para mantener su posición en la cola de conexión.
Principales acontecimientos:
- 14 de julio de 2026: Se publicó el Informe de Modificación Final, que redujo el suelo de tarifa OTCF propuesto de £10.000/MW a £3.000/MW, con un techo de tarifa de £25.000/MW.
- Agosto de 2026: Está previsto que Ofgem tome su decisión sobre el CMP470 a mediados de agosto de 2026.
- Implementación proyectada: Se espera que las tarifas entren en vigor en julio de 2027.
La magnitud del problema que aborda el CMP470:
La cola de baterías de Gate 2 se sitúa actualmente en 91 GW, mientras que el objetivo del Plan Clean Power 2030 requiere únicamente 29 GW. Esto significa que:
- ~25 GW de proyectos en cola actualmente ocupan posiciones en la cola sin pagar ninguna tarifa de garantía o compromiso
- Estos proyectos se enfrentan a la eliminación con la introducción de las tarifas CMP470
- La eliminación de proyectos especulativos liberará capacidad de conexión a la red para proyectos genuinamente viables
Implicaciones para los clientes C&I:
CMP470 tendrá varios efectos en el mercado de almacenamiento C&I:
1. Costos de desarrollo más altosLos desarrolladores deberán pagar tarifas para conservar las posiciones en la cola, lo que aumentará los costos de desarrollo de los proyectos. Estos costos pueden trasladarse a los clientes comerciales e industriales (C&I).
2. Racionalización de colasLa eliminación de los proyectos especulativos debería reducir la congestión en las listas de espera, lo que potencialmente conduciría a tiempos de conexión más rápidos para los proyectos genuinamente viables.
3. Evaluación de viabilidad del proyectoLa estructura de tarifas obligará a los desarrolladores a realizar rigurosas evaluaciones de viabilidad antes de comprometerse con las posiciones en la cola. Los proyectos con una economía incierta se abandonarán antes en el proceso de desarrollo.
4. Oportunidad para jugadores seriosPara los desarrolladores y clientes comerciales e industriales que están comprometidos con el despliegue de almacenamiento, la racionalización de las listas de espera representa una oportunidad. Eliminar la competencia especulativa mejora el acceso a las conexiones a la red para los proyectos que están verdaderamente listos para avanzar.
2.4 Almacenamiento de energía de larga duración (LDES): El mecanismo de "tope y suelo"
Se está introduciendo un nuevo mecanismo de apoyo para el almacenamiento de larga duración.
El 26 de junio de 2026, Ofgem publicó su decisión provisional sobre la primera ventana de solicitud de LDES, respaldando 16 proyectos con una capacidad combinada de 7,6 GW de potencia y 137 GWh de capacidad de almacenamiento de energía. Esto representa un compromiso significativo con tecnologías que pueden almacenar energía durante periodos prolongados (normalmente más de 6 horas).
El mecanismo de "límite máximo y mínimo" proporciona certeza de ingresos:
- SueloUna garantía de ingresos mínimos que protege a los inversores del riesgo a la baja
- GorraUn nivel de ingresos máximo por encima del cual los rendimientos excedentes se comparten con los consumidores
Actualización del 20 de agosto de 2026: El gobierno del Reino Unido lanzó el Desafío Ultra-LDES, proporcionando 28 millones de libras esterlinas en financiación para tecnologías capaces de almacenar y descargar energía durante más de 100 horas. Esto apunta a aplicaciones de almacenamiento estacional que actualmente están fuera del alcance de las tecnologías de baterías convencionales.
La oportunidad C&I en el sector de LDES:
Para los clientes comerciales e industriales (C&I), el segmento de duración de almacenamiento de 4 a 8 horas representa una oportunidad de mercado significativa. Se espera que el mecanismo de LDES respalde proyectos en este rango de duración, lo cual se alinea con muchas aplicaciones de C&I:
- Cambio de proceso industrialTrasladar las operaciones que consumen mucha energía a períodos de precios de la electricidad más bajos
- Energía de respaldo extendidaProporcionar resiliencia durante apagones prolongados de la red
- Optimización del autoconsumo solarCaptura de la generación solar diurna para su uso por la tarde y durante la noche
Se estima que el segmento de almacenamiento comercial e industrial de 4 a 8 horas representa una oportunidad de mercado de entre 20.000 y 30.000 millones de libras esterlinas.
2.5 Exención del IVA y reformas del mercado de capacidad
Exención de IVA:
Los sistemas de almacenamiento en el Reino Unido están exentos del IVA hasta marzo de 2027. Esta exención se aplica tanto al almacenamiento autónomo como al integrado en sistemas fotovoltaicos solares. La exención supone una reducción de costes del 20% para los proyectos de almacenamiento en los sectores comercial e industrial y ha sido un factor clave para el crecimiento del mercado.
¿Qué pasa después de marzo de 2027?
El futuro de la exención del IVA más allá de marzo de 2027 sigue siendo incierto. Si no se prorroga la exención, el coste de los sistemas de almacenamiento aumentará en un 20%, lo que podría ralentizar su implantación en el sector comercial e industrial (C&I). Los clientes del sector C&I que estén barajando proyectos de almacenamiento deberían tener en cuenta esta incertidumbre a la hora de planificar sus plazos.
Reformas del mercado de capacidad:
El Mercado de Capacidad sigue ofreciendo contratos de 15 años para los nuevos activos de sistemas de almacenamiento de energía en baterías (BESS), lo que proporciona una seguridad de ingresos que respalda la financiación de proyectos. Sin embargo, los precios de adjudicación se han derrumbado:
| Año de subasta | Precio de compensación (£/kW) | Cambiar desde Peak |
| 2022/23 | £75 | Línea de base |
| 2023/24 | £40 | -47% |
| 2024/25 | £18 | -76% |
| 2025/26 | £10 | -87% |
| 2026/27 | £5 | -93% |
El Mercado de Capacidad, que en su día fue un pilar de los ingresos de los proyectos de almacenamiento, ahora aporta un valor marginal. La duración de los contratos de 15 años sigue aportando valor de financiación —los prestamistas lo ven como un suelo de ingresos que reduce el riesgo a la baja—, pero la contribución absoluta de los ingresos se ha vuelto insignificante.
Implicaciones:
El colapso de los precios del Mercado de Capacidad tiene dos consecuencias importantes:
1. La acumulación de ingresos se vuelve aún más críticaCon los ingresos del mercado de capacidad reducidos a casi cero, los proyectos deben depender de otras fuentes de ingresos —arbitraje mayorista, mecanismo de balance y valor detrás del contador— para lograr su viabilidad.
2. La economía de los proyectos se desplaza hacia el valor detrás del contadorPara los clientes comerciales e industriales (C&I), el valor del almacenamiento radica cada vez más en los costos evitados (cargos por demanda, cargos de red, autoconsumo) en lugar de en los ingresos de la red. Esto hace que el almacenamiento sea una inversión en eficiencia operativa en lugar de una estrategia de ingresos de la red.
3. Despliegues de proyectos recientes: Cómo es el éxito en 2026
El mercado de almacenamiento del Reino Unido en 2026 se caracteriza por una amplia variedad de proyectos exitosos que abarcan instalaciones a escala de red, aplicaciones comerciales e implementaciones industriales detrás del contador. Estos proyectos proporcionan valiosos puntos de referencia para los clientes comerciales e industriales que estén considerando inversiones en almacenamiento.
3.1 Puntos de referencia de proyectos a escala de red
Fidra Energy Thorpe Marsh
- Capacidad: 1,4 GW
- UbicaciónThorpe Marsh, Yorkshire del Sur
- EstadoFinanciación completada 2025
- SignificadoLa financiación para un solo proyecto más grande de Europa durante 2025, con aproximadamente £1 mil millones recaudados. Este proyecto demuestra el apetito de los inversores institucionales por los activos de almacenamiento a escala de red en el Reino Unido y establece un punto de referencia para las estructuras de financiación de proyectos.
Statera Thurrock
- Capacidad: 300 MW
- UbicaciónThurrock, Essex
- Estado: Operativo en agosto de 2025
- SignificadoEn el momento de su puesta en marcha, este era el sitio de almacenamiento operativo más grande del Reino Unido. Demuestra la viabilidad técnica del despliegue a gran escala de sistemas de almacenamiento de energía en baterías (BESS) dentro de una infraestructura conectada a la red de transmisión.
Cartera de Pulse Clean Energy
- Capacidad: 700+ MWh
- Financiamiento: 220 millones de libras de deuda sénior
- SignificadoDestacable por incluir la reconversión de antiguos sitios de generación diésel para el almacenamiento en baterías. Esto demuestra el potencial de convertir la infraestructura de combustibles fósiles heredada en activos de energía limpia.
SAE Uskmouth
- Capacidad: 240 MWh
- EstadoCierre financiero 2025
- SignificadoUbicado en el emplazamiento de una antigua central térmica de carbón, este proyecto demuestra la narrativa de la "transición justa" de reutilizar la infraestructura energética heredada.
3.2 Puntos de referencia de proyectos comerciales e industriales
Hospital Ortopédico Solis RJAH
- Capacidad: 600+ kWh
- EstadoOperativo en julio de 2026
- SignificadoEl primer proyecto de almacenamiento comercial e industrial (C&I) en el Reino Unido para Solis, un importante fabricante de inversores. Demuestra la entrada de los fabricantes establecidos de energía solar fotovoltaica en el sector del almacenamiento comercial e industrial.
Lombard Shipping Ipswich
- Sistemabatería de 102,4 kWh + energía solar fotovoltaica en tejado + carga de vehículos eléctricos
- Generación solar: 118 MWh/año
- Impacto financiero: ~£1 millón de ahorro en 20 años; periodo de recuperación de poco más de 5 años
- SignificadoDemuestra el potencial de acumulación de valor de combinar energía solar fotovoltaica, almacenamiento en baterías e infraestructura de carga de vehículos eléctricos en una sola solución integrada.
Wattstor × LSN Diffusion
- Sistema1.3 MW fotovoltaica solar + 5 MWh BESS
- UbicaciónPlanta de fabricación en el sur de Gales
- EstadoFirmado en junio de 2026
- SignificadoUn despliegue industrial sustancial que demuestra la magnitud de la implementación de almacenamiento C&I que ahora ocurre en el sector manufacturero del Reino Unido.
CDS Superstores Avonmouth
- Sistema: 2,5 MW fotovoltaica solar (Fase 1)
- Planificado: 40 MW de energía solar fotovoltaica + almacenamiento + gestión inteligente de la demanda en sitios del Reino Unido
- SignificadoDemuestra el enfoque de cartera que los grandes clientes comerciales e industriales (C&I) están adoptando, implementando almacenamiento en múltiples sitios con optimización centralizada.
Wenergy UK
- Capacidad: armario ESS C&I de 289 kWh
- EstadoSuministrado en julio de 2026
- SignificadoNotable por estar diseñado para el comercio directo en el mercado eléctrico en lugar de exclusivamente para aplicaciones detrás del contador. Esto representa un nuevo modelo en el que los activos de almacenamiento comercial e industrial participan activamente en los mercados mayoristas y de balance.
3.3 Lecciones clave de implementaciones recientes
De estas referencias de proyectos surgen varios patrones:
Lección 1: La acumulación de valor es la norma, no la excepción
Todo proyecto exitoso de almacenamiento C&I en 2026 combina múltiples fuentes de valor:
- Optimización del autoconsumo solar
- Reducción de la tarifa a la demanda
- Arbitraje de precios al por mayor
- Participación en el mecanismo de balance (para activos más grandes)
- Resiliencia y energía de reserva
- Prestación de servicios de red (si procede)
Lección 2: La financiación de la innovación se está acelerando
La aparición de acuerdos de compra de energía (PPA), contratos de arrendamiento y modelos de "almacenamiento como servicio" está transformando el mercado de almacenamiento comercial e industrial (C&I). Los clientes ya no necesitan financiar proyectos de almacenamiento en su totalidad con sus propios balances. Las estructuras de financiación de terceros permiten el despliegue sin capital inicial.
Lección 3: La integración con energía solar fotovoltaica es estándar
Casi todos los despliegues de almacenamiento C&I en 2026 están integrados con energía solar fotovoltaica. La combinación de generación solar y almacenamiento permite el máximo autoconsumo, reduce los costos de importación de la red y proporciona flujos de valor complementarios. Los despliegues de almacenamiento puro (sin energía solar) siguen siendo raros en el segmento C&I.
Lección 4: La sofisticación técnica diferencia a los ganadores
Los proyectos que tienen éxito en 2026 demuestran capacidades técnicas sofisticadas:
- Monitoreo y optimización del mercado en tiempo real
- Despacho automatizado basado en señales de precios
- Integración con sistemas de gestión de energía de edificios
- Análisis predictivo para la previsión de la demanda
- Capacidades de monitoreo y control remoto
4. Los nueve problemas críticos a los que se enfrentan los clientes de almacenamiento C&I y cómo resolverlos
El mercado de almacenamiento C&I del Reino Unido en agosto de 2026 presenta nueve desafíos críticos que cada cliente —ya sea un fabricante industrial, propietario de un inmueble comercial o proveedor de servicios energéticos— debe afrontar. Esta sección ofrece un análisis detallado de cada problema y orientación práctica para abordarlos.
Problema 1: La cola de la red de 91 GW frente al objetivo de 29 GW: Cómo asegurar que su proyecto no sea desplazado
La situación
La lista de espera de baterías "Gate 2" del Reino Unido asciende actualmente a 91 GW, mientras que el objetivo de «Clean Power 2030» solo requiere 29 GW. Esto significa que, incluso entre los proyectos que han superado la selección inicial, no se necesitarán 68% para cumplir los objetivos nacionales. Con la proximidad del plazo para el pago de las tasas del CMP470 y el endurecimiento de los criterios de «Ready to Connect», muchos proyectos quedarán descartados.
Por qué esto es importante para los clientes C&I
Para los clientes comerciales e industriales que desarrollan proyectos de almacenamiento, la cola de conexión a la red es un cuello de botella crítico. Los proyectos que no pueden asegurar conexiones a la red a tiempo se enfrentan a retrasos de varios años o a su cancelación completa. La racionalización de las colas crea un entorno darwiniano en el que solo sobreviven los proyectos más aptos.
La magnitud del desafío
| Queue Metric | Valor | Implicación |
| Cola de baterías de la puerta 2 | 91 GW | Proyectos totales pendientes de conexión |
| Objetivo de Energía Limpia 2030 | 29 GW | Capacidad realmente necesaria |
| Proyectos que actualmente no pagan comisiones por compromiso | ~25 GW | En peligro de eliminación |
| tarifa mínima de CMP470 | 3.000 £/MW | Costo anual mínimo para mantener la posición |
| Límite de la tarifa CMP470 | 25.000 £/MW | Coste anual máximo |
Cómo garantizar que tu proyecto sobreviva
1. Demostrar una auténtica madurez en el proyecto
El marco "Listo para Conectar" prioriza los proyectos que demuestran:
- Progreso de la planificaciónPermiso de obras obtenido o solicitud presentada
- Derechos de propiedad de la tierraControl legal sobre el sitio del proyecto (opción, contrato de arrendamiento o propiedad)
- Madurez técnicaDiseño de ingeniería detallado completado
- Viabilidad financieraPruebas de que el proyecto puede alcanzar el cierre financiero
Los proyectos que carezcan de estos elementos perderán prioridad y podrían perder su puesto en la cola.
2. Presupuesto para cuotas de conexión
Las tarifas CMP470 OTCF, que se prevé entren en vigor en julio de 2027, añadirán costes significativos al desarrollo de proyectos. Un proyecto de 10 MW se enfrentaría a unas tarifas de £30.000 a £250.000 al año para conservar su puesto en la cola. Estos costos deben incorporarse a los presupuestos del proyecto.
3. Considere enfoques de conexión alternativos
Para algunos clientes C&I, la conexión a la red puede no ser el enfoque óptimo:
- Instalación detrás del contadorEs posible que el almacenamiento dimensionado para coincidir con la demanda in situ no requiera la aprobación de conexión a la red
- Proyectos conectados a la distribuciónLos proyectos más pequeños que se conectan a nivel de distribución pueden enfrentar filas más cortas
- Utilización de la conexión existenteUtilización de la capacidad de conexión a la red existente que actualmente está infrautilizada
4. Asociarse con desarrolladores experimentados
La complejidad de la conexión a la red en 2026 favorece a los desarrolladores experimentados que entienden el panorama normativo y tienen relaciones establecidas con los operadores de red. Asociarse con dichos desarrolladores puede mejorar las posibilidades de asegurar y conservar las posiciones en la lista de espera.
Problema 2: Saturación del mercado de servicios complementarios: cómo mantener los ingresos tras el colapso de la respuesta de frecuencia
La situación
El mercado de la respuesta de frecuencia —que históricamente ha sido la principal fuente de ingresos para los activos de almacenamiento del Reino Unido— se ha visto saturado por la llegada masiva de nueva capacidad de sistemas de almacenamiento de energía por batería (BESS). Los ingresos procedentes de la respuesta de frecuencia se han desplomado desde su máximo histórico y ahora solo representan unos 20% de los ingresos medios por proyecto. La estructura de ingresos ha cambiado radicalmente:
| Flujo de ingresos | Participación de 2022 | Acciones 2026 | Cambia |
| Respuesta en frecuencia | 60–80% | ~20% | Colapsar |
| Arbitraje al por mayor + BM | ~8% | ~50% | Crecimiento masivo |
| Mercado de Capacidad | Significativo | Marginal | Colapsar |
| Otros (BM, comercio, etc.) | ~10% | ~30% | Crecimiento |
Por qué esto es importante para los clientes C&I
El modelo de ingresos que respaldó los proyectos de almacenamiento de 2020 a 2023 ya no funciona. Los proyectos diseñados en torno a los ingresos por respuesta de frecuencia tendrán un rendimiento significativamente inferior. Los nuevos proyectos deben diseñarse con modelos de ingresos que reflejen la realidad del mercado de 2026.
Cómo construir un modelo de ingresos sostenible en 2026
1. Priorizar el arbitraje mayorista
El arbitraje de precios mayoristas —cargar cuando los precios son bajos y descargar cuando los precios son altos— se ha convertido en la principal fuente de ingresos. La red eléctrica del Reino Unido, cada vez más dependiente de las energías renovables, crea patrones de precios predecibles:
- Precios bajosPor la noche (baja demanda), al mediodía (alta generación solar)
- Precios altosPico vespertino (alta demanda, energía solar en descenso)
Los activos de almacenamiento capaces de capturar este diferencial de forma sistemática pueden generar ingresos sustanciales. La clave es una optimización sofisticada que anticipe los movimientos de precios en lugar de reaccionar ante ellos.
2. Adoptar la participación en los mecanismos de balance
El Mecanismo de Balance ofrece precios prémium por la flexibilidad durante los períodos de tensión en el sistema. Aunque la participación en el MB requiere sofisticación técnica y registro en el NESO, el potencial de ingresos es significativo. Los activos con capacidades de respuesta rápida y disponibilidad fiable pueden captar estos ingresos.
3. Apilar flujos de valor BTM
Para los clientes comerciales e industriales (C&I), el valor detrás del medidor suele ser más predecible y fiable que los ingresos de la red:
- Reducción de la tarifa a la demandaEvitar los cargos por capacidad mediante la reducción de la importación en hora punta
- Optimización del autoconsumoMaximizar el uso de la generación solar in situ
- Elusión de cargos de redReducción de los cargos de DUoS (particularmente los cargos de Triad durante los picos de invierno)
4. Considere el almacenamiento de mayor duración
A medida que disminuyen los ingresos por respuesta de frecuencia, aumenta el valor del almacenamiento de mayor duración (4 horas o más). Los activos de mayor duración pueden participar en el arbitraje mayorista en diferenciales de precios más amplios y capturar valor de las diferencias de precios de varias horas. El mecanismo LDES (Sección 2.4) proporciona apoyo adicional para estos activos.
Problema 3: Demanda Comercial y Cargos por Capacidad: Cómo Reducirlos con Precisión
La situación
Para los clientes comerciales e industriales del Reino Unido con cargas eléctricas superiores a 100 kVA, los cargos por capacidad representan un coste significativo:
- Cargo por capacidadAproximadamente £7,26/kVA/mes
- Cargo por exceso de capacidadSe aplica cuando el consumo supera la capacidad contratada o los límites acordados
- Limitación de exportación G100Restringe aún más la capacidad máxima de importación/exportación
En el régimen de cobro de capacidad, cada vez más enfocado en reflejar los costos, las superaciones repetidas comprimen significativamente el rendimiento de las inversiones y aumentan los costos operativos.
Por qué esto es importante para los clientes C&I
Las tarifas de capacidad son un coste fijo que se aplica independientemente del consumo real de energía. Para los clientes con perfiles de demanda variables, las tarifas de capacidad pueden representar entre el 30 y el 50% del coste total de la electricidad. Reducir las tarifas de capacidad mediante el almacenamiento es una de las fuentes de valor más directas y fiables que existen.
Cómo el almacenamiento reduce los cargos por capacidad
1. Reducción de picos de demanda
El almacenamiento puede descargarse durante los períodos de alta demanda para reducir el nivel máximo de importación. Si la demanda máxima de un cliente es de 500 kVA, pero el almacenamiento puede reducirla a 400 kVA, el cliente ahorra 726 £ al mes (7,26 £ × 100 kVA) en cargos por capacidad.
2. Desplazamiento de carga
El almacenamiento puede trasladar las cargas que no son críticas para el tiempo (por ejemplo, HVAC, calentamiento de agua, carga de vehículos eléctricos) a períodos de menor demanda, suavizando el perfil de demanda general y reduciendo los requisitos de pico.
3. Gestión de exportaciones
Para los clientes con generación in situ (fotovoltaica solar) que supera la demanda local, el almacenamiento puede absorber la generación excedente y evitar las restricciones de exportación. Bajo los esquemas de limitación de exportación G100, el almacenamiento permite que el sitio opere dentro de los límites de exportación mientras maximiza el autoconsumo.
Cálculo del ROI del almacenamiento para la reducción del cargo por capacidad
Un marco sencillo para evaluar el valor del almacenamiento para la reducción del cargo por capacidad:
| Parámetro | Valor de ejemplo |
| Demanda máxima sin almacenamiento | 500 kVA |
| Demanda máxima con almacenamiento | 400 kVA |
| Reducción del cargo por capacidad | 100 kVA × 7,26 £/mes = 726 £/mes |
| Ahorro anual | £8,712 |
| Costo del sistema de almacenamiento (asumir 200 kWh/100 kW) | ~£50.000–£70.000 |
| Periodo de recuperación simple (solo cargos por capacidad) | 5,7–8,0 años |
Nota: Este cálculo considera únicamente la reducción del cargo por capacidad. Al combinarse con otros flujos de valor (arbitraje mayorista, autoconsumo solar, evasión de cargos de red), el período de recuperación general suele acortarse a 3–5 años.
Problema 4: La aprobación de seguridad contra incendios añade de 4 a 8 meses: cómo acelerar los plazos del proyecto
La situación
El Reino Unido carece de un reglamento de seguridad contra incendios unificado para las instalaciones de BESS. Las aprobaciones de los bomberos locales añaden entre 4 y 8 meses a los plazos de los proyectos. El panorama normativo está evolucionando:
Principales novedades normativas:
| Regulación | Fecha | Requisitos clave |
| umbral de 1 MWh de iones de litio | Actual | La señal de planificación más clara específica para BESS en Inglaterra |
| Modificación 4 de la norma BS 7671 | Abril de 2026 | Nuevos requisitos de puntos de aislamiento de CA y CC; etiquetado de seguridad para bomberos |
| Guía de planificación de BESS a escala de red de NFCC | 2026 | Normas de seguridad contra incendios más estrictas |
Por qué esto es importante para los clientes C&I
Los retrasos en la aprobación de seguridad contra incendios prolongan los plazos de los proyectos, aumentan los costes de desarrollo y generan incertidumbre. Los proyectos que encuentran objeciones en materia de seguridad contra incendios pueden necesitar modificaciones de diseño significativas o enfrentarse a un rechazo total. Para los clientes con requisitos urgentes (por ejemplo, la sustitución de equipos defectuosos o el cumplimiento de los objetivos corporativos de sostenibilidad), estos retrasos pueden resultar costosos.
Cómo acelerar la aprobación de seguridad contra incendios
1. Involucrar a las autoridades de bomberos con antelación
Póngase en contacto con la autoridad local de bomberos durante la fase de diseño inicial, no después de que los planos estén finalizados. La participación temprana permite incorporar las consideraciones de seguridad contra incendios en el diseño desde el principio, lo que reduce la probabilidad de objeciones posteriores.
2. Superar los estándares mínimos
Diseñar sistemas que superen los mínimos reglamentarios:
- Sistemas de extinción de incendiosInstalar sistemas automáticos de extinción de incendios (por ejemplo, sistemas basados en aerosol) incluso cuando no sean estrictamente obligatorios
- Cerramientos ignífugosUtilice productos con mayor resistencia al fuego
- Monitoreo y detección tempranaInstalar sistemas de detección de gas que puedan identificar problemas potenciales antes de que se produzca una fuga térmica
- Capacidad de aislamientoAsegúrese de que los puntos de aislamiento de CA y CC estén claramente marcados y sean accesibles, cumpliendo con los requisitos de la Enmienda 4 de la norma BS 7671.
3. Utilice productos con credenciales de seguridad demostradas
Algunos productos incorporan funciones de seguridad avanzadas que pueden simplificar la aprobación:
- Refrigeración líquidaReduce el estrés térmico en las celdas de la batería, lo que disminuye el riesgo de incendio
- Monitoreo a nivel de celdaProporciona una alerta temprana de posibles problemas
- Supresión de incendios integradaLos sistemas de supresión integrados reducen la necesidad de medidas externas de protección contra incendios
- Certificaciones de seguridadLos productos con certificaciones UL 9540A o equivalentes demuestran el cumplimiento de las normas de seguridad contra incendios
4. Considere las implementaciones por debajo del umbral
Para algunas aplicaciones, implementar múltiples sistemas más pequeños (cada uno por debajo del umbral de 1 MWh) puede ser preferible a un único sistema más grande que active un escrutinio adicional. Si bien esto puede aumentar la complejidad, puede reducir significativamente los plazos de aprobación.
Problema 5: Permiso de planificación — Los proyectos grandes (>50 MW) requieren aprobación NSIP
La situación
Los proyectos de almacenamiento a gran escala (normalmente >50 MW) se clasifican como Proyectos de Infraestructura de Importancia Nacional (NSIP, por sus siglas en inglés) y requieren una Orden de Consentimiento de Desarrollo (DCO). El proceso de la DCO puede añadir años a los plazos de los proyectos. Incluso para los proyectos más pequeños, la sensibilidad al ruido puede descartar posibles emplazamientos antes de que siquiera comience el diseño de ingeniería.
Por qué esto es importante para los clientes C&I
Para los clientes que consideran implementaciones de almacenamiento a gran escala, el proceso de planificación representa una barrera significativa. El proceso de DCO incluye:
- Evaluación del impacto ambiental
- Consulta pública
- Revisión gubernamental
- Posibles desafíos legales
El plazo para la aprobación de la DCO suele oscilar entre 2-5 años, durante el cual el proyecto no puede avanzar hacia la construcción.
Cómo navegar por el panorama de la planificación
1. Ajustar el tamaño de los proyectos para evitar los requisitos de NSIP
Para la mayoría de las aplicaciones comerciales e industriales (C&I), las necesidades de almacenamiento se pueden satisfacer con proyectos muy por debajo del umbral de 50 MW. Un sistema de 1 a 10 MW es suficiente para la mayoría de las instalaciones industriales y comerciales. Mantenerse por debajo del umbral de la NSIP evita por completo el proceso de DCO.
2. Abordar las preocupaciones sobre el ruido de manera proactiva
El ruido de los sistemas de refrigeración, inversores y transformadores puede generar objeciones. Aborde el ruido de forma proactiva mediante:
- Refrigeración líquidaPor lo general, más silencioso que los sistemas enfriados por aire
- Recintos acústicosCajas insonorizadas que reducen el ruido externo
- Selección del sitio: Ubicación del almacenamiento lejos de receptores sensibles al ruido (zonas residenciales, oficinas)
- Modelización de ruidoRealización de evaluaciones acústicas durante la fase de diseño para demostrar el cumplimiento
3. Considere las instalaciones de interior
Para aquellos lugares con limitaciones de espacio o sensibilidad al ruido, las instalaciones de almacenamiento en interiores pueden ser preferibles. Los sistemas de interior se pueden colocar dentro de edificios existentes, eliminando el impacto visual y reduciendo las emisiones de ruido. Los productos diseñados para ofrecer flexibilidad en interiores y exteriores (por ejemplo, Alpha ESS Storion G3 con protección IP55) pueden adaptarse a ambas configuraciones.
4. Almacenamiento combinado con energía solar fotovoltaica
Los proyectos de almacenamiento ubicados junto con energía solar fotovoltaica a menudo se benefician de procesos de planificación simplificados. El almacenamiento se considera un accesorio de la instalación solar en lugar de un desarrollo independiente, lo que simplifica el proceso de aprobación.
Problema 6: El Reino Unido carece de fabricación nacional de celdas: cómo asegurar la cadena de suministro
La situación
A partir de 2026, el Reino Unido no cuenta con ninguna superfábrica de celdas a gran escala operativa para el mercado de almacenamiento detrás del medidor (BTM). No se espera que la gigafábrica de Tata (Agratas) en Somerset (con 40 GWh planificados) produzca celdas de almacenamiento BTM hasta 2028-2029 como pronto. En consecuencia:
- 70–80% de la valeur de la celda es importado (China, Corea del Sur y, cada vez más, proveedores europeos)
- Los integradores del Reino Unido suelen tener solo 4–8 semanas de inventario de celdas
- Las interrupciones en la cadena de suministro pueden retrasar la entrega de proyectos por meses
Por qué esto es importante para los clientes C&I
La vulnerabilidad de la cadena de suministro es un riesgo crítico para los proyectos de almacenamiento. Los retrasos en la entrega de celdas pueden prolongar los plazos de los proyectos, aumentar los costos y poner en peligro los acuerdos de financiación. Los clientes que no logran asegurar un suministro confiable de celdas pueden ver sus proyectos retrasados indefinidamente.
Cómo garantizar la fiabilidad de la cadena de suministro
1. Asociarse con proveedores establecidos
Trabaja con proveedores que hayan demostrado resiliencia en la cadena de suministro:
- fabricantes de primer nivelEmpresas con bases de fabricación diversificadas y redes logísticas establecidas
- Estrategias de múltiples fuentesProveedores que pueden obtener celdas de múltiples fabricantes
- Integración verticalLas empresas que controlan su cadena de suministro de extremo a extremo
2. Considerar químicas de celdas alternativas
Las celdas de fosfato de hierro y litio (LFP) se han convertido en la química dominante para el almacenamiento estacionario, ofreciendo:
- Menor costo: Las celdas LFP suelen ser entre 20 y 30% más baratas que las alternativas de NMC
- Mayor seguridadLFP tiene mayor estabilidad térmica, lo que reduce el riesgo de incendio
- Mayor vida útilLas celdas LFP suelen alcanzar entre 6000 y 8000 ciclos
- Sin cobaltoEliminación de la dependencia de la cadena de suministro de cobalto (concentrada en la República Democrática del Congo)
3. Construir reservas de inventario
Para proyectos críticos, considere comprar celdas adicionales o sistemas completos antes de necesitarlos. Aunque esto inmoviliza capital, proporciona un seguro contra interrupciones en la cadena de suministro.
4. Considere los sistemas en contenedores
Los sistemas de almacenamiento en contenedores (por ejemplo, soluciones de contenedores de 20 o 40 pies) se pueden adquirir a través de múltiples proveedores y entregarse como unidades completas. Este enfoque reduce la complejidad de la integración y ofrece flexibilidad en la cadena de suministro.
Problema 7: Colapso del precio del mercado de capacidad: Cómo responder a la caída de £75/kW a £5/kW
La situación
Los precios de liquidación del mercado de capacidad han descendido 93% a lo largo de cuatro ciclos de subasta:
| Año de subasta | Precio de compensación (£/kW) | Valor del contrato a 15 años (por MW) |
| 2022/23 | £75 | £1,125,000 |
| 2023/24 | £40 | £600,000 |
| 2024/25 | £18 | £270,000 |
| 2025/26 | £10 | £150,000 |
| 2026/27 | £5 | £75,000 |
Si bien los activos de sistemas de almacenamiento de energía en baterías (BESS) de nueva construcción todavía reciben contratos de 15 años, la contribución a los ingresos se ha reducido a niveles casi insignificantes.
Por qué esto es importante para los clientes C&I
El colapso del Mercado de Capacidad significa que los proyectos de almacenamiento ya no pueden depender de los ingresos del Mercado de Capacidad para respaldar su modelo de negocio. Los proyectos diseñados con los ingresos del Mercado de Capacidad como un componente significativo tendrán un rendimiento inferior. Los nuevos proyectos deben diseñarse con expectativas realistas sobre el valor del Mercado de Capacidad.
Cómo adaptarse al colapso del mercado de capacidad
1. Considere el Mercado de Capacidad como un ingreso adicional, no como un ingreso principal
Economía del proyecto de diseño suponiendo cero Ingresos del Mercado de Capacidad. Cualquier ingreso del Mercado de Capacidad debe tratarse como un beneficio adicional en lugar de una base de referencia. Esto crea una economía de proyecto conservadora que es robusta ante futuros descensos del Mercado de Capacidad.
2. Centrarse en las cadenas de valor con potencial de crecimiento
Identifique las fuentes de ingresos que probablemente crezcan en lugar de disminuir:
- Arbitraje al por mayorEl aumento de la penetración de energías renovables genera una mayor volatilidad de precios
- Mecanismo de equilibradoLas necesidades de flexibilidad del sistema crecerán a medida que aumente la proporción de energías renovables
- Valor BTMLa reducción del término de capacidad y la optimización del autoconsumo son fiables y predecibles
- Servicios de flexibilidadLos productos emergentes (por ejemplo, mercados de flexibilidad local, gestión de restricciones) ofrecen nuevas oportunidades de ingresos
3. Reconsiderar el dimensionamiento del proyecto
Con la reducción de los ingresos del Mercado de Capacidad, la capacidad de almacenamiento óptima para un emplazamiento determinado puede cambiar. Los sistemas más pequeños que se centran en el valor detrás del contador (BTM) pueden ofrecer mejores rendimientos que los sistemas más grandes que dependen de los ingresos de la red.
Problema 8: Cambio en la competencia comercial e industrial (C&I) hacia un enfoque "orientado a soluciones": cómo diferenciarse
La situación
El mercado de almacenamiento C&I del Reino Unido ha pasado de la competencia basada en precios a la diferenciación orientada a soluciones. Los integradores compiten en:
- Calidad del diseño del sistema
- Financiación de la innovación (PPAs, leasing)
- Optimización del servicio de red
- Soporte técnico y mantenimiento
Mientras tanto, los proveedores de celdas chinos (CATL, BYD, EVE Energy) venden cada vez más directamente a los integradores del Reino Unido, eludiendo a los distribuidores tradicionales y comprimiendo los márgenes para los actores de nivel medio.
Por qué esto es importante para los clientes C&I
El cambio hacia la competencia orientada a soluciones crea tanto oportunidades como riesgos:
- OportunidadLos clientes pueden acceder a soluciones más sofisticadas adaptadas a sus necesidades específicas.
- RiesgoLa proliferación de proveedores de soluciones dificulta distinguir a los proveedores genuinamente competentes de aquellos con una diferenciación superficial.
Cómo navegar por el mercado orientado a soluciones
1. Evalúe el costo total de vida útil, no el precio inicial
El sistema más barato puede no ser el más barato durante su vida útil. Considere:
- Vida útil y tasas de degradación
- Requisitos de mantenimiento
- Pérdidas de eficiencia
- Fiabilidad y tiempo de inactividad
- Términos y condiciones de la garantía
2. Evaluar la sofisticación técnica
Busca proveedores que demuestren:
- Capacidades de optimización en tiempo real
- Integración con sistemas de gestión de energía
- Analítica predictiva
- Monitoreo y resolución de problemas remotos
- Actualizaciones y mejoras periódicas de software
3. Exigir flexibilidad de financiación
Los mejores proveedores ofrecen múltiples opciones de financiamiento:
- Compra directa
- Contratos de arrendamiento
- Acuerdos de Compra de Energía
- modelos de almacenamiento como servicio
4. Verificar las relaciones de la cadena de suministro
Pregunte a los proveedores sobre sus proveedores de celdas y sus estrategias de abastecimiento. Los proveedores con relaciones establecidas con fabricantes de celdas de Nivel 1 (CATL, BYD, EVE, etc.) están mejor posicionados para garantizar una entrega confiable.
Problema 9: ¿Pueden los productos de gabinetes para exteriores cumplir con las restricciones climáticas y de sitio del Reino Unido?
La situación
El clima del Reino Unido, caracterizado por condiciones húmedas y lluviosas e inviernos fríos, impone exigencias específicas a los equipos de almacenamiento exterior. Los requisitos clave incluyen:
- Altas calificaciones de protección IP: IP55 o superior para resistir la lluvia, la humedad y el polvo
- Operación a baja temperaturaRendimiento a temperaturas inferiores a 0 °C
- Eficiencia de espacioLos sitios C&I a menudo tienen espacio limitado
- Gestión de ruidoLa proximidad a edificios ocupados requiere bajas emisiones de ruido
Por qué esto es importante para los clientes C&I
Seleccionar equipos de almacenamiento que no sean adecuados para las condiciones del Reino Unido puede provocar:
- Rendimiento y eficiencia reducidos
- Mayores requisitos de mantenimiento
- Falla prematura del equipo
- Peligros de seguridad
- Problemas de cumplimiento normativo
Panorama actual de productos
El mercado ha respondido a estos desafíos con productos diseñados específicamente para las condiciones del Reino Unido:
| Producto | Capacidad | Huella | Características principales |
| SOCOMEC SMARTSYS C260 | 125 kVA/261 kWh a 1 MVA/2 MWh | 1,35 m² | Gabinete exterior integrado refrigerado por líquido LFP, instalación <2 horas por gabinete |
| LONGi Hi-MO One Pro | 261 kWh modular | No especificado | La tecnología de seguridad predictiva iCCS detecta gases anormales con 25 minutos de antelación |
| LONGi OmniCube L233 | 233 kWh/125 kW | 1,35 m² | vida útil de 8.000 ciclos, alta densidad energética |
| Sunwoda OASIS A200 | 200 kWh | No especificado | LFP enfriado por aire, IP55, Nivel 1 de BNEF T2 2026 |
| Alpha ESS Storion G3 | No especificado | No especificado | Doble uso interior/exterior, protección IP55, diseño integrado |
Cómo seleccionar equipo para exteriores para las condiciones del Reino Unido
1. Priorizar una protección IP55 o superior
Para instalaciones exteriores en el clima húmedo del Reino Unido, IP55 es la clasificación mínima aceptable. IP65 o IP66 ofrecen protección adicional para ubicaciones particularmente expuestas.
2. Considerar la refrigeración líquida
Los sistemas refrigerados por líquido ofrecen múltiples ventajas para aplicaciones en el Reino Unido:
- Control de la temperaturaMantiene la temperatura celular óptima tanto en condiciones de frío como de calor
- Reducción de ruidoPor lo general, más silencioso que los sistemas enfriados por aire
- Diseño compactoUna mayor densidad energética permite tamaños más compactos
- Vida útil mejoradaUna mejor gestión de la temperatura prolonga la vida útil de la batería
3. Evaluar la eficiencia de la huella
Los productos que ofrecen una alta densidad de energía por metro cuadrado son cada vez más importantes para los sitios comerciales e industriales con limitaciones de espacio. El LONGi OmniCube L233 y el SOCOMEC SMARTSYS C260 ofrecen entre 233 y 261 kWh en apenas 1,35 m², lo que representa el estado del arte actual.
4. Busque funciones de seguridad predictiva
Las características de seguridad avanzadas, como la tecnología de seguridad predictiva iCCS de LONGi (que puede detectar gases anormales 25 minutos antes de la fuga térmica), proporcionan una capa adicional de protección y pueden agilizar las aprobaciones de seguridad contra incendios.
5. Matriz técnica de productos: Armarios para exteriores y sistemas en contenedores
El mercado de almacenamiento C&I en el Reino Unido en agosto de 2026 ofrece una amplia gama de soluciones técnicas. Esta sección ofrece una comparación estructurada de los productos de armarios para exteriores y los sistemas en contenedores disponibles actualmente, centrándose en las especificaciones relevantes para las condiciones de implantación en el Reino Unido.
5.1 Soluciones de armarios para exteriores
Los sistemas de gabinetes para exteriores son la solución preferida para muchas aplicaciones comerciales e industriales (C&I), ya que ofrecen huellas compactas, instalación rápida y escalabilidad modular.
Tabla Comparativa: Productos de Gabinetes para Exteriores (2026)
| Especificación | SOCOMEC SMARTSYS C260 | LONGi OmniCube L233 | Sunwoda OASIS A200 | Alpha ESS Storion G3 |
| Rango de potencia | 125 kVA – 1 MVA | 125 kilovatios | No especificado | No especificado |
| Rango de capacidad | 261 kWh – 2 MWh | 233 kWh | 200 kWh | No especificado |
| Huella | 1,35 m² | 1,35 m² | No especificado | No especificado |
| Refrigeración | Líquido (LFP) | Líquido (LFP) | Aire (LFP) | No especificado |
| Grado de protección IP | Apto para exteriores | Apto para exteriores | IP55 | IP55 |
| Ciclo de vida | No especificado | 8000 ciclos | No especificado | No especificado |
| Tiempo de instalación | <2 horas/gabinete | No especificado | No especificado | No especificado |
| Interior/exterior | Al aire libre | Al aire libre | Al aire libre | De doble uso |
| Características destacadas | Diseño completamente integrado | Alta densidad energética | BNEF Tier 1 Q2 2026 | Diseño integrado |
5.2 Soluciones en contenedores
Para aplicaciones comerciales e industriales más grandes, los sistemas de almacenamiento en contenedores ofrecen una mayor densidad energética y un despliegue rápido.
Productos clave en el segmento de contenedores:
Contenedor ESS de refrigeración por aire de 40 pies, 1 MWh / 2 MWh
Esta categoría representa el pilar fundamental del mercado de almacenamiento C&I, ofreciendo:
- Diseño premontado y probado en fábrica
- Gestión térmica por aire adecuada para las condiciones climáticas del Reino Unido
- Despliegue rápido (en días en lugar de semanas)
- Escalable desde configuraciones de 1 MWh hasta multi-MWh
- Adecuado para instalaciones industriales, centros logísticos y grandes superficies comerciales
Contenedor ESS de refrigeración líquida de 20 pies y 3 MWh / 5 MWh
Esta categoría representa la última generación de almacenamiento en contenedores:
- La refrigeración líquida permite una mayor densidad energética (hasta 5 MWh en un contenedor de 20 pies)
- La gestión térmica mejorada prolonga la vida útil del ciclo
- Reducción del consumo de energía auxiliar
- Adecuado para aplicaciones que requieren gran capacidad en espacio limitado
- Ideal para microrredes industriales e instalaciones comerciales e industriales (C&I) a gran escala
Tabla de comparación: Soluciones en contenedores
| Especificación | Contenedor de 40 pies refrigerado por aire | Contenedor de 20 pies refrigerado por líquido |
| Capacidad | 1–2 MWh | 3-5 MWh |
| Refrigeración | Refrigerado por aire | Refrigerado por líquido |
| Huella | contenedor de 40 pies | contenedor de 20 pies |
| Densidad de energía | Baja | Más alto (3 veces por huella) |
| Instalación | Premontado, probado en fábrica | Premontado, probado en fábrica |
| Aplicaciones adecuadas | Industrial, logística, comercial | Aplicaciones industriales a gran escala, de microrredes y de alta densidad |
| Mantenimiento | Más sencillo (refrigeración por aire) | Más complejo (refrigeración líquida) |
| Ruido | Mayor (ruido del ventilador) | Bajar (refrigeración líquida más silenciosa) |
5.3 Soluciones integradas de energía solar y almacenamiento
Para los clientes comerciales e industriales (C&I) que buscan maximizar el autoconsumo de energía solar fotovoltaica y al mismo tiempo beneficiarse del almacenamiento, las soluciones integradas de energía solar más almacenamiento ofrecen un valor óptimo. Sistema solar híbrido comercial de 500 kW representa el punto óptimo para muchas aplicaciones comerciales e industriales de medianas a grandes:
- fotovoltaica solar de 500 kW que genera aproximadamente entre 450 y 500 MWh/año (condiciones del Reino Unido)
- Almacenamiento integrado dimensionado para coincidir con el exceso de generación y la demanda máxima
- Gestión inteligente de la energía optimización del autoconsumo, reducción de la tarifa por demanda y arbitraje en el mercado mayorista
- Punto único de responsabilidad para el diseño, suministro y puesta en marcha
Esta clase de solución es especialmente adecuada para:
- Instalaciones de manufactura con operaciones diurnas
- Centros de distribución y centros logísticos
- Instalaciones de procesamiento de alimentos y almacenamiento en frío
- Campuses de oficinas comerciales
- Centros de salud
6. Preguntas frecuentes
Esta sección aborda las preguntas más frecuentes de los profesionales de toda la cadena de valor fotovoltaica y de almacenamiento de energía, proporcionando respuestas prácticas y viables basadas en las condiciones de mercado de agosto de 2026.
P1: ¿Cuál es la duración óptima de almacenamiento para aplicaciones comerciales e industriales (C&I) en el Reino Unido en 2026?
La duración óptima depende de los flujos de valor principales:
| Aplicación | Duración recomendada | Justificación |
| Reducción de la tarifa a la demanda | 2-4 horas | Suficiente para recortar los periodos de máxima demanda |
| Autoconsumo solar | 4–6 horas | Satisface la demanda vespertina después del pico solar |
| Arbitraje al por mayor | 4–8 horas | Captura diferenciales de precios de múltiples horas |
| Respaldo/resiliencia | 4–8 horas | Ofrece una protección significativa contra interrupciones |
| Participación en LDES | más de 8 horas | Elegible para mecanismos de apoyo de LDES |
Para la mayoría de las aplicaciones comerciales e industriales (C&I), un sistema de 4 horas representa el punto óptimo, equilibrando el costo, el potencial de acumulación de valor y la flexibilidad operativa.
P2: ¿Cuál es el período de recuperación de la inversión realista para el almacenamiento comercial e industrial (C&I) en el Reino Unido en 2026?
Los periodos de recuperación de la inversión varían significativamente según el tamaño del sistema, la aplicación y los factores específicos del sitio. Los datos actuales del mercado sugieren:
| Tamaño del sistema | Periodo de recuperación típico | Principales impulsores de valor |
| 100 kWh – 500 kWh | 5-8 años | Reducción de la tarifa por demanda, autoconsumo solar |
| 500 kWh – 1 MWh | 4 a 7 años | Valor combinado de BTM + arbitraje mayorista |
| 1 MWh – 5 MWh | de 5 a 9 años | Arbitraje mayorista + participación en el mercado de balance + valor de BTM |
| 5 MWh+ | 6–10 años | Apilamiento de valores complejos, oportunidades de LDES |
Nota: Estas cifras se basan en los precios de mercado y las condiciones normativas actuales. La exención del IVA (hasta marzo de 2027) mejora significativamente la rentabilidad; si no se prorroga la exención, los plazos de amortización se incrementarán en aproximadamente 20%.
Q3: ¿Debo elegir sistemas de almacenamiento refrigerados por aire o por líquido?
Ambas tecnologías tienen mérito y la elección depende de factores específicos de la aplicación:
| Factor | Refrigeración por aire | Refrigerado por líquido |
| Costo | Menor coste inicial | Mayor costo inicial |
| Mantenimiento | Más simple | Más complejo |
| Ruido | Más alto | Baja |
| Densidad de energía | Baja | Mayor (2–3x) |
| Ciclo de vida | Bien | Mejor (control de temperatura mejorado) |
| Eficiencia de espacio | Baja | Más alto |
| Apto para | Sistemas más pequeños, sitios con menos limitaciones | Sistemas más grandes, sitios con espacio limitado o sensibles al ruido |
Recomendación: Para aplicaciones comerciales e industriales (C&I) en el Reino Unido donde hay espacio disponible y el ruido no es una preocupación principal, los sistemas enfriados por aire ofrecen un rendimiento rentable. Para aplicaciones con limitaciones de espacio o sensibles al ruido, los sistemas enfriados por líquido ofrecen un valor superior a pesar de un costo inicial más alto.
Q4: ¿Cuál es el tamaño mínimo del sistema para un proyecto de almacenamiento C&I viable?
El tamaño mínimo viable del sistema depende de la demanda de electricidad del cliente y de los flujos de valor disponibles:
- Pequeño C&I (demanda de 50–100 kVA)Los sistemas de 50 a 100 kWh pueden proporcionar una reducción significativa de los cargos por demanda.
- C&I Mediano (demanda de 100 a 500 kVA)Los sistemas de 100–500 kWh son apropiados
- Gran C&I (demanda de 500+ kVA)Sistemas de 500 kWh–2 MWh o más grandes
Como regla general, el sistema debe dimensionarse para:
- Reducir la demanda máxima en un 10–20% (para reducir el cargo por demanda)
- Almacenar entre 50 y 1001 TP3T de la generación solar media diaria (para autoconsumo)
- Proporcionar más de 4 horas de funcionamiento a potencia nominal
P5: ¿Cómo ha afectado la reforma "Listo para Conectar" a los proyectos de almacenamiento C&I?
La reforma "Listo para Conectar" afecta a los proyectos C&I de varias maneras:
Efectos positivos:
- La racionalización de colas reduce la congestión, lo que potencialmente acorta los plazos de conexión
- Las fechas de conexión son más confiables
- Los proyectos especulativos ya no desplazan a los proyectos genuinos
Efectos negativos:
- Mayores costos de desarrollo (cargos CMP470)
- Requisitos más estrictos para la retención en cola
- Posible eliminación de proyectos que no puedan demostrar preparación
Evaluación netaPara los clientes comerciales e industriales que se toman en serio el despliegue de almacenamiento y pueden demostrar la madurez del proyecto, la reforma es netamente positiva. Elimina la competencia de proyectos especulativos y crea un proceso de conexión más eficiente.
P6: ¿Cuáles son las diferencias clave entre el almacenamiento comercial e industrial (C&I) del Reino Unido y el almacenamiento a escala de red?
| Factor | Almacenamiento C&I | Almacenamiento a gran escala |
| Tamaño del sistema | 100 kWh – 10 MWh | 10 MW – 500 MW+ |
| Conexión | Nivel de distribución (detrás del contador o DNO) | Nivel de transmisión |
| Valor principal | Valor detrás del contador (cargos por demanda, autoconsumo) | Arbitraje mayorista, BM, servicios auxiliares |
| Certeza de ingresos | Mayor (el valor de BTM es predecible) | Menor (los ingresos de la red son volátiles) |
| Complejidad de planificación | Inferior (típicamente dentro del desarrollo permitido) | Superior (NSIP para >50 MW) |
| Financiamiento | Más sencillo (financiación de activos, arrendamientos operativos) | Complejo (financiación de proyectos, inversión institucional) |
¿Cómo evalúo la calidad de un proveedor de sistemas de almacenamiento?
Criterios clave para evaluar proveedores de sistemas de almacenamiento:
| Criterio | Qué buscar |
| Proveedor de células | Fabricantes de nivel 1 (CATL, BYD, EVE, etc.) |
| Calidad de integración | Sistemas probados en fábrica, procesos de calidad documentados |
| Garantía | Términos de garantía claros que cubren el rendimiento y los defectos |
| Presencia en el Reino Unido | Soporte técnico local, disponibilidad de repuestos |
| Historial | Demostración de despliegues de proyectos en condiciones del Reino Unido/Europa |
| Certificaciones de seguridad | UL 9540A, IEC 62619, cumplimiento específico para el Reino Unido |
| Capacidad de software | Monitoreo en tiempo real, algoritmos de optimización, resolución de problemas remota |
| Estabilidad financiera | Empresa consolidada con un modelo de negocio sostenible |
P8: ¿Cuáles son los requisitos de seguridad contra incendios para el almacenamiento comercial e industrial en el Reino Unido?
Los requisitos de seguridad contra incendios continúan evolucionando. Consideraciones clave a partir de agosto de 2026:
| Requisito | Detalles |
| Aprobación de planeamiento | Requerido para sistemas >1 MWh (iones de litio) |
| BS 7671 Enmienda 4 (abril de 2026) | Puntos de aislamiento de CA/CC, etiquetado de seguridad para bomberos |
| Guía de planificación de BESS a escala de red de la NFCC (2026) | Normas de seguridad contra incendios más estrictas |
| Aprobación de la autoridad de bomberos local | Agrega de 4 a 8 meses a los cronogramas del proyecto |
| Características de seguridad recomendadas | Supresión de incendios, detección de gas, monitoreo térmico, capacidad de aislamiento |
Q9: ¿Puedo combinar energía solar fotovoltaica y almacenamiento en un solo proyecto?
Sí, y de hecho, este es el enfoque recomendado para la mayoría de las aplicaciones comerciales e industriales (C&I). La combinación de solar más almacenamiento ofrece:
| Beneficio | Explicación |
| Autoconsumo mejorado | El almacenamiento captura el exceso de generación solar para su uso posterior |
| Conexión a red única | La conexión compartida reduce los costos |
| Planificación optimizada | Los proyectos combinados a menudo se benefician de procesos de aprobación simplificados |
| Economía mejorada | La acumulación de valores combinados mejora los rendimientos generales del proyecto |
| Punto único de responsabilidad | Un solo proveedor para diseño, suministro y puesta en marcha |
Para aplicaciones comerciales e industriales (C&I) de medianas a grandes, un Sistema solar híbrido comercial de 500 kW con almacenamiento integrado representa una arquitectura de solución comprobada.
Q10: ¿Qué sucede después de que expire la exención de IVA en marzo de 2027?
El futuro de la exención del IVA es incierto. Tres escenarios:
| Escenario | Implicación |
| Excepción ampliada | Sin cambios; los costes de almacenamiento siguen siendo 20% más bajos |
| Exención reemplazada por tipo reducido | Aumento parcial del coste (p. ej., 5–10%) |
| La exención terminó | Aumento total del coste de 20%; los plazos de amortización se alargan en aproximadamente 20% |
Recomendación: Los clientes comerciales e industriales (C&I) que estén considerando proyectos de almacenamiento deben tener en cuenta esta incertidumbre en su planificación. Los proyectos que puedan completarse antes de marzo de 2027 se beneficiarán de la exención actual. Los proyectos planeados para después de esta fecha deben incluir un margen de contingencia para posibles aumentos de costos.
P11: ¿Cómo elijo entre gabinetes para exteriores y sistemas en contenedores?
| Factor | Gabinete para exteriores | Sistema en contenedores |
| Rango de capacidad | 100 kWh – 2 MWh | 1 MWh – 5 MWh+ |
| Huella | Más pequeño (1,35 m² por armario) | Mayor (huella del contenedor) |
| Velocidad de instalación | Rápido (<2 horas por mueble) | Rápido (premontado) |
| Escalabilidad | Modular, agregue gabinetes según sea necesario | Añada contenedores según sea necesario |
| Restricciones de espacio | Mejor para espacios reducidos | Requiere más espacio |
| Sensibilidad al ruido | Opciones con refrigeración líquida disponibles | Opciones de refrigeración por aire o por líquido |
| Mantenimiento | Mantenimiento a nivel de gabinete | Mantenimiento a nivel de contenedor |
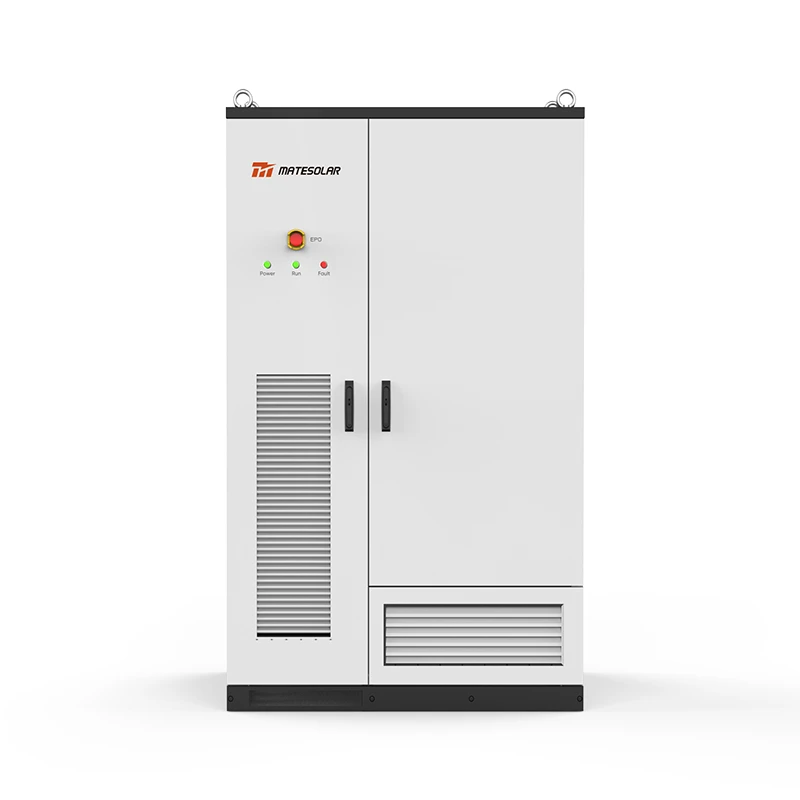
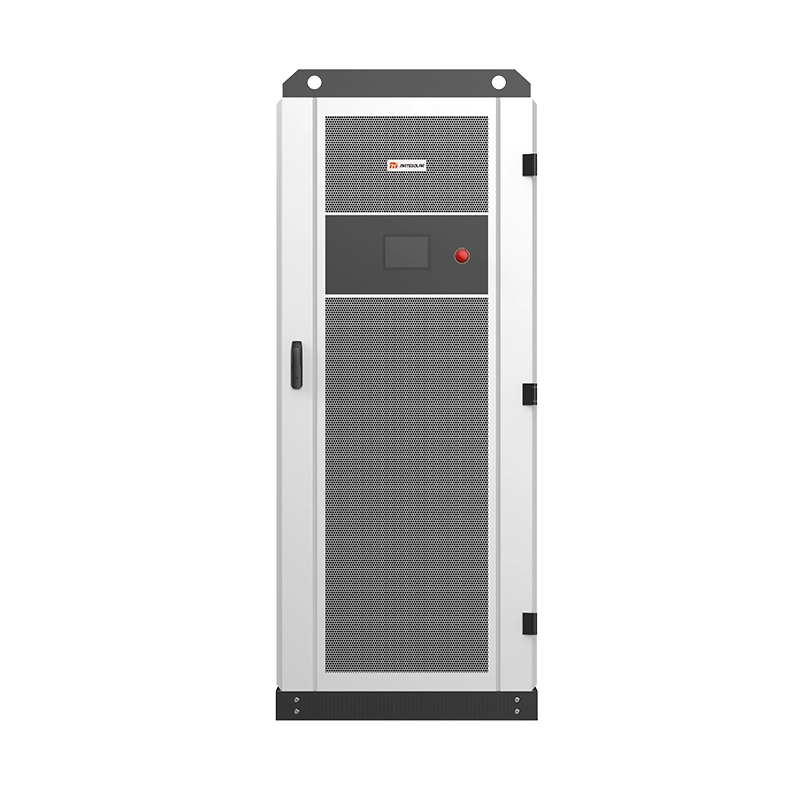
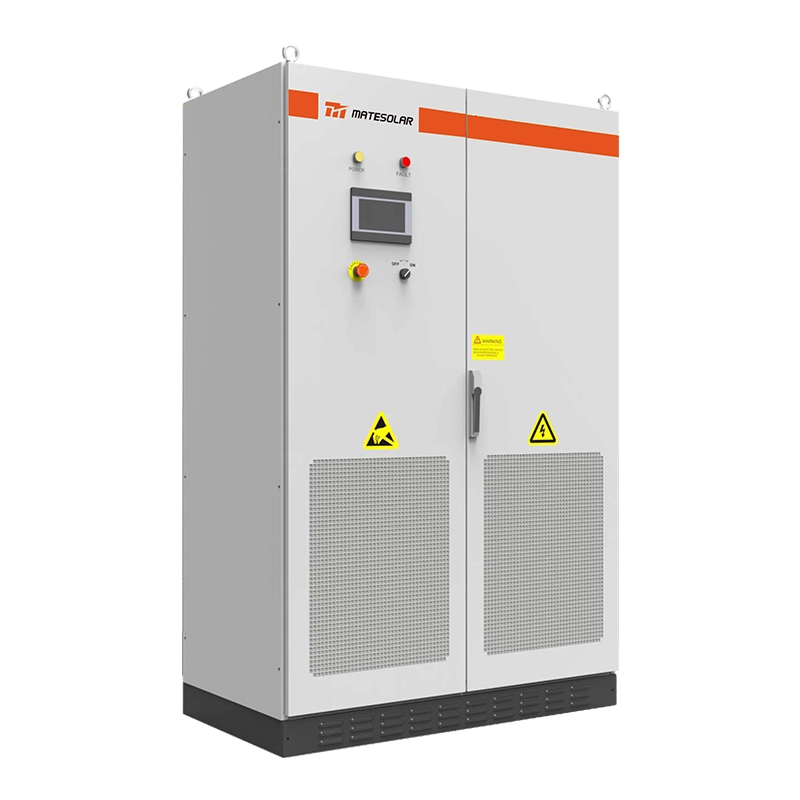
Para los clientes que buscan un despliegue rápido en entornos con espacio reducido, los productos de gabinetes para exteriores como Sistema de almacenamiento de energía en gabinete exterior refrigerado por líquido de 125 kW/261 kWh ofrezca un valor convincente. Para aplicaciones más grandes que requieren de 1 a 5 MWh, las soluciones en contenedores como la 40 pies 1MWh/2MWh Contenedor ESS refrigerado por aire o el Sistema de almacenamiento de energía en contenedores de refrigeración líquida de 20 pies 3MWh/5MWh proporcione un rendimiento comprobado.
P12: ¿Cuál es el estado actual del soporte de LDES para proyectos C&I?
El mecanismo de "límite máximo y mínimo" (cap and floor) del LDES (Sección 2.4) apoya a los proyectos de almacenamiento de larga duración:
- Duración elegible: Normalmente más de 6 horas
- Primera ventana (2026): 16 proyectos apoyados (7,6 GW / 137 GWh)
- Desafío Ultra-LDES£28 millones para tecnologías de más de 100 horas
- Oportunidad comercial e industriallos sistemas de 4 a 8 horas representan un mercado de entre 20 y 30 mil millones de libras esterlinas
EvaluaciónPara proyectos comerciales e industriales (C&I) con capacidad de duración de 8 o más horas, el mecanismo LDES proporciona un apoyo significativo a los ingresos. Sin embargo, para la mayoría de las aplicaciones de C&I (con una duración de 4 horas), el apoyo de LDES no es directamente aplicable.
Q13: ¿Qué tan importante es la capacidad de software y optimización para el almacenamiento C&I?
La capacidad de software es fundamental, y cada vez más el principal diferenciador entre proyectos exitosos y no exitosos:
| Capacidad | Importancia | Justificación |
| Optimización en tiempo real | Esencial | Maximiza el valor del arbitraje mayorista y de los flujos BTM |
| Analítica predictiva | Alta | Anticipa los patrones de demanda y los movimientos de precios |
| Monitoreo remoto | Esencial | Permite la rápida identificación y resolución de problemas |
| Integración con EMS | Alta | Permite el funcionamiento coordinado con los sistemas del edificio |
| Despacho automatizado | Esencial | Responde a las señales del mercado sin intervención manual |
| Informes y análisis | Importante | Demuestra valor y apoya la toma de decisiones |
Q14: ¿Cuál es la perspectiva para los precios de los sistemas de almacenamiento en 2026-2027?
| Componente | Precio 2026 | Proyección 2027 | Tendencia |
| Celdas LFP | 60–80 £/kWh | £50–70/kWh | Rechazando |
| Sistemas completos (gabinete) | £180–250/kWh | £160–220/kWh | Rechazando |
| Sistemas completos (contenedor) | £150–220/kWh | £140–200/kWh | Rechazando |
| Instalación (C&I) | 30–60 £/kWh | 30–55 £/kWh | Estable |
Nota: Los precios son orientativos y varían en función del tamaño del sistema, las especificaciones y el proveedor. La exención del IVA (si no se prorroga) supondrá un aumento de los precios efectivos del 20% a partir de abril de 2027.
P15: ¿Cuáles son los errores más comunes en los proyectos de almacenamiento C&I?
| Error | Consecuencia | Cómo evitar |
| Sobredimensionamiento del sistema | Economía pobre, período de recuperación prolongado | Realice un análisis de carga detallado antes del dimensionamiento |
| Ignorar los requisitos de seguridad contra incendios | Retrasos en el proyecto, costos de rediseño | Contacte a las autoridades de bomberos con anticipación |
| Subestimar el impacto del ruido | Objeciones de planificación, rechazo del proyecto | Realice una evaluación acústica temprana |
| Ignorar el valor de BTM | Diseño de sistemas subóptimo, menores rendimientos | Modela todos los flujos de valor, no solo los ingresos de la red |
| Elegir la tecnología de refrigeración incorrecta | Rendimiento reducido, mayor mantenimiento | Adaptar la tecnología de refrigeración a las condiciones del emplazamiento |
| Software inadecuado | Despacho subóptimo, ingresos reducidos | Priorizar la capacidad del software en la selección de proveedores |
7. Conclusión: El camino a seguir para el almacenamiento C&I en el Reino Unido
El mercado de almacenamiento de energía comercial e industrial del Reino Unido se encuentra en agosto de 2026 en un punto de inflexión. El mercado ha madurado más allá de su infancia, con 12,7 GW de capacidad instalada, un régimen reformado de conexión a la red y modelos de ingresos que se han reestructurado fundamentalmente. El camino a seguir requiere un nuevo enfoque: uno que reconozca el colapso de los ingresos por respuesta de frecuencia, la racionalización de la cola de la red y el cambio hacia una competencia orientada a soluciones.
Para los clientes comerciales e industriales (C&I), la oportunidad es clara: el almacenamiento desplegado detrás del contador ofrece un valor predecible y fiable mediante la reducción de los cargos por demanda, la optimización del autoconsumo solar y el evitar los cargos de red. El reto es igualmente claro: navegar por un panorama regulatorio complejo, seleccionar la tecnología adecuada y construir modelos de ingresos que sean sólidos frente a la evolución del mercado.
Los nueve problemas críticos descritos en esta guía —desde el desajuste entre la cola de 91 GW y el objetivo de 29 GW hasta el plazo de aprobación de la seguridad contra incendios— no son insuperables. Requieren preparación, sofisticación técnica y las asociaciones adecuadas. Los clientes que se comprometan desde el principio, dimensionen adecuadamente sus proyectos y prioricen la calidad de las soluciones por encima del precio inicial tendrán éxito. Aquellos que se retrasen, inviertan poco en la capacidad de optimización o seleccionen tecnología inadecuada tendrán dificultades.
El mercado seguirá evolucionando. La decisión sobre el CMP470, prevista por Ofgem para agosto de 2026, remodelará aún más la lista de espera para la conexión. El destino de la exención del IVA más allá de marzo de 2027 sigue siendo incierto. El mecanismo LDES madurará. Y la cadena de suministro continuará diversificándose a medida que la capacidad de fabricación europea y británica entre en funcionamiento.
Lo que no cambiará es la propuesta de valor fundamental del almacenamiento para los clientes comerciales e industriales: la capacidad de controlar los costos de energía, maximizar el valor de la generación solar in situ y contribuir a un sistema eléctrico descarbonizado. Los productos y soluciones disponibles hoy en día —desde armarios exteriores compactos que ofrecen entre 233 y 261 kWh en 1,35 m² hasta sistemas en contenedores que ofrecen hasta 5 MWh en una superficie de 20 pies— proporcionan la base técnica para el éxito. El desafío restante es la ejecución.
Para las organizaciones que buscan implementar soluciones comerciales de energía solar con almacenamiento, MateSolar ofrece soporte integral como proveedor único de soluciones fotovoltaicas y de almacenamiento de energía. Desde el diseño del sistema y la selección de productos hasta la coordinación de la cadena de suministro y la orientación técnica, MateSolar apoya a los clientes en cada fase del desarrollo del proyecto, asegurando que las inversiones en almacenamiento C&I ofrezcan el máximo valor en el mercado británico en constante evolución.
MateSolar es un proveedor integral de soluciones fotovoltaicas y de almacenamiento de energía que ofrece una amplia gama de productos solares fotovoltaicos y de almacenamiento en baterías adaptados a las necesidades de los clientes comerciales e industriales. Nuestra cartera de productos incluye sistemas solares híbridos comerciales, soluciones de almacenamiento en armarios para exteriores con refrigeración líquida y sistemas en contenedores con refrigeración por aire o líquida para aplicaciones que van desde 100 kWh hasta 5 MWh y más. Apoyamos a los clientes durante todo el ciclo de vida del proyecto —desde el diseño del sistema y la selección de productos hasta la coordinación de la cadena de suministro y la orientación técnica— garantizando una implementación exitosa en el dinámico mercado energético del Reino Unido.