

















Date: July 10, 2026
Category: Energy Storage, Commercial & Industrial, Market Intelligence
Reading time: 38 minutes
Executive Summary
Europe’s commercial and industrial (C&I) energy storage market is not merely growing—it is undergoing a structural acceleration that will redefine how businesses consume, manage, and monetize electricity for decades. As of July 2026, the confluence of regulatory upheaval, grid instability, tariff reform, insurability tightening, and technology maturation has elevated energy storage from a discretionary energy management tool to a non-negotiable asset on the corporate balance sheet.
Newly released data confirms that annual C&I storage installations across Europe will reach 12.4 GWh in 2026, representing a year-on-year doubling. The EU Energy Storage Tripartite Agreement, signed in June 2026 by the European Commission, transmission system operators, and industry associations, sets a binding trajectory from 9 GWh in 2026 to 24 GWh by 2028—a 167% increase that makes C&I the fastest-growing storage segment by percentage.
Yet this explosive growth conceals a landscape of immense complexity. Insurance carriers have drastically tightened underwriting standards following Intersolar 2026, rendering uncertified assets unbankable. France’s TURPE 7 tariff reform goes live in August, rewriting grid charge logic across 3,000 tariff zones. The switch to 15-minute settlement intervals across EU day-ahead markets means legacy hourly control strategies are leaving up to 3% of project IRR on the table. Grid connection queues in Germany, the Netherlands, and Belgium stretch to 8 months for projects above 500 kWh, while sodium-ion batteries are opening a fresh total-cost-of-ownership conversation that challenges incumbent lithium-ion assumptions.
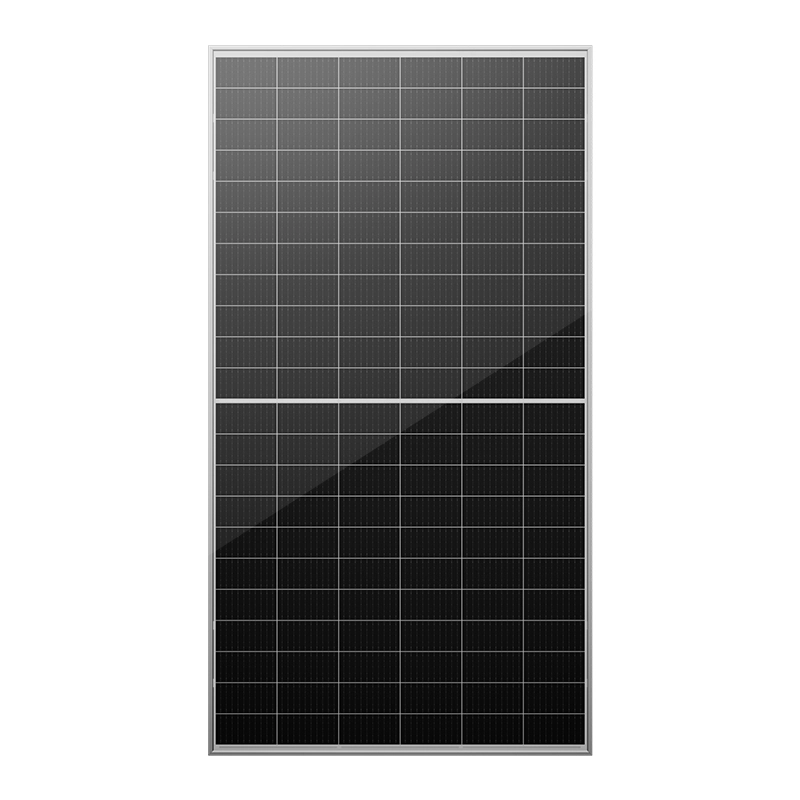
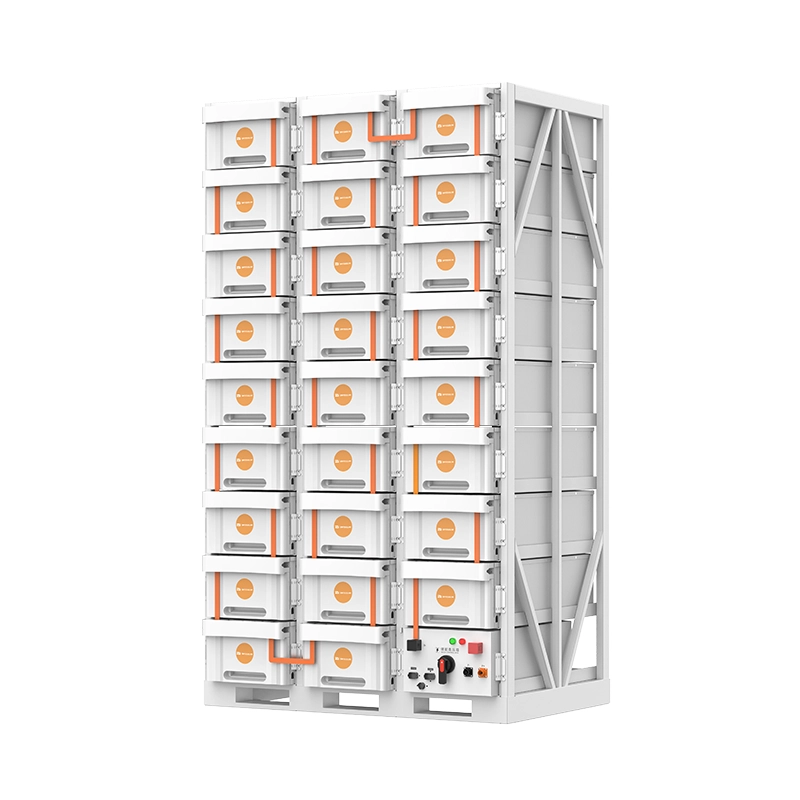
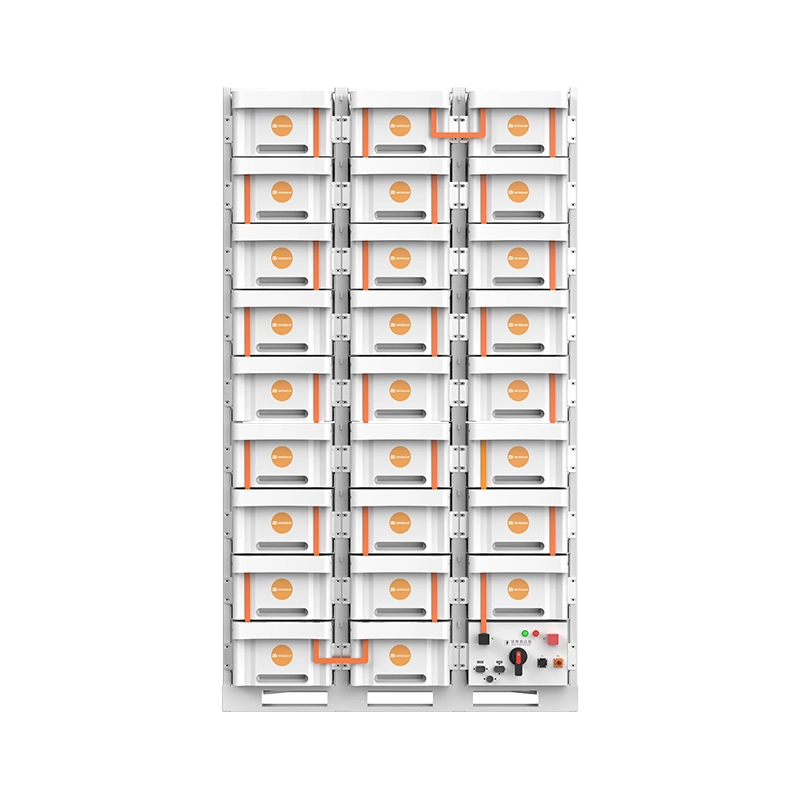
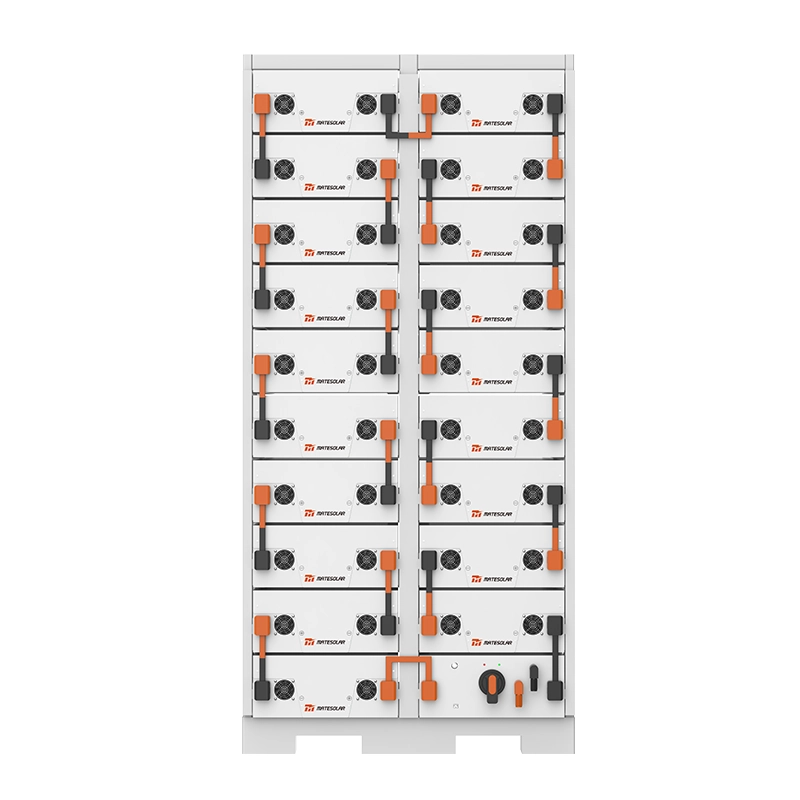
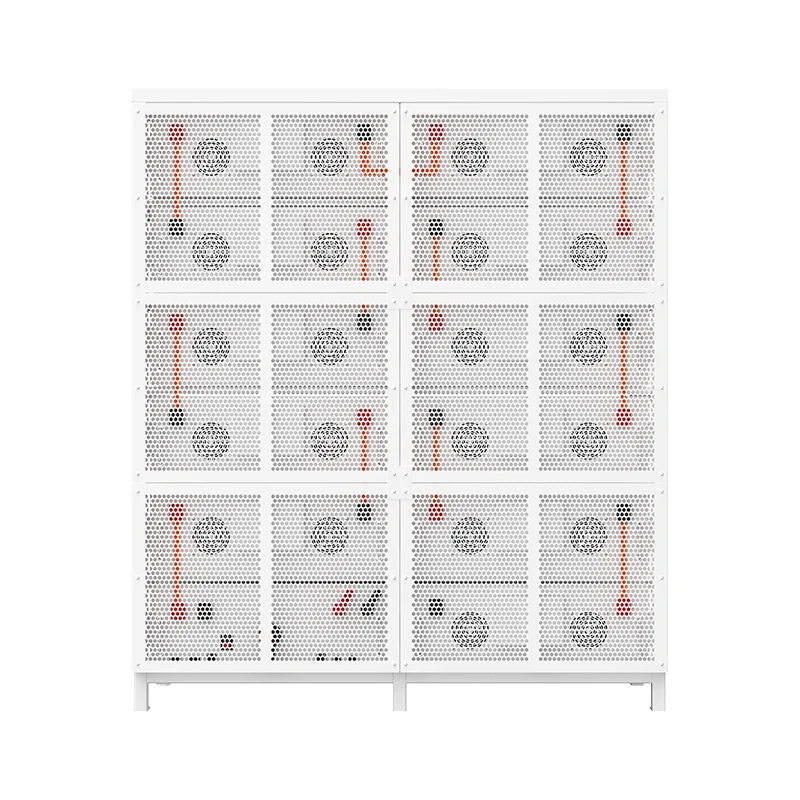
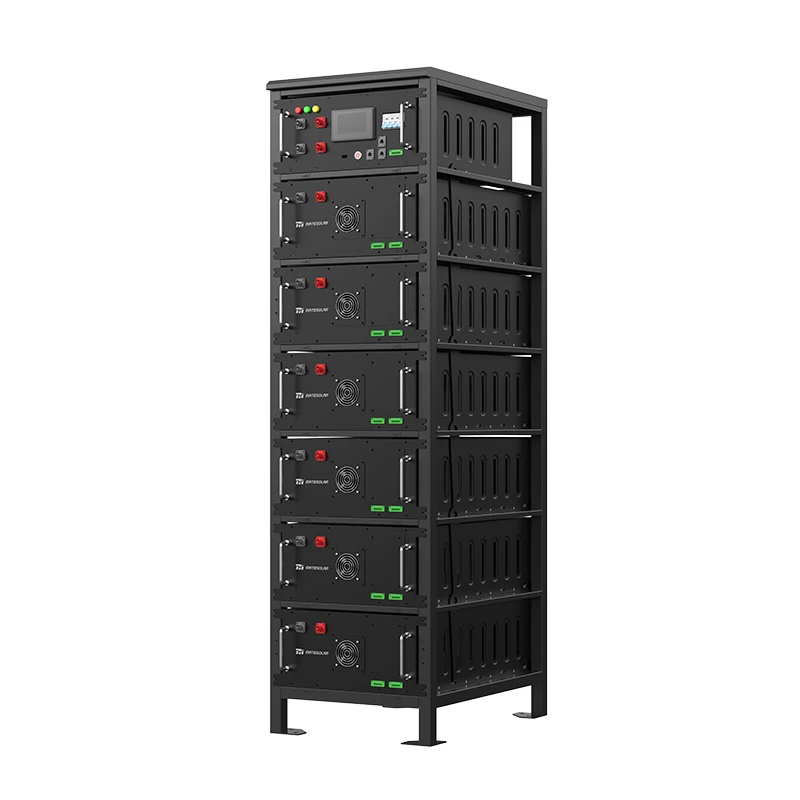
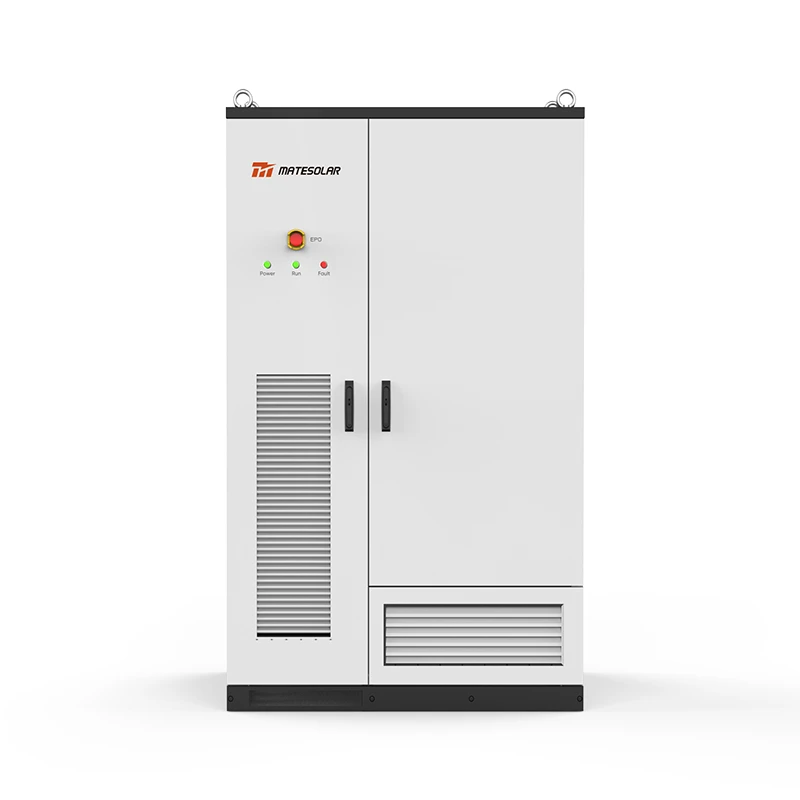
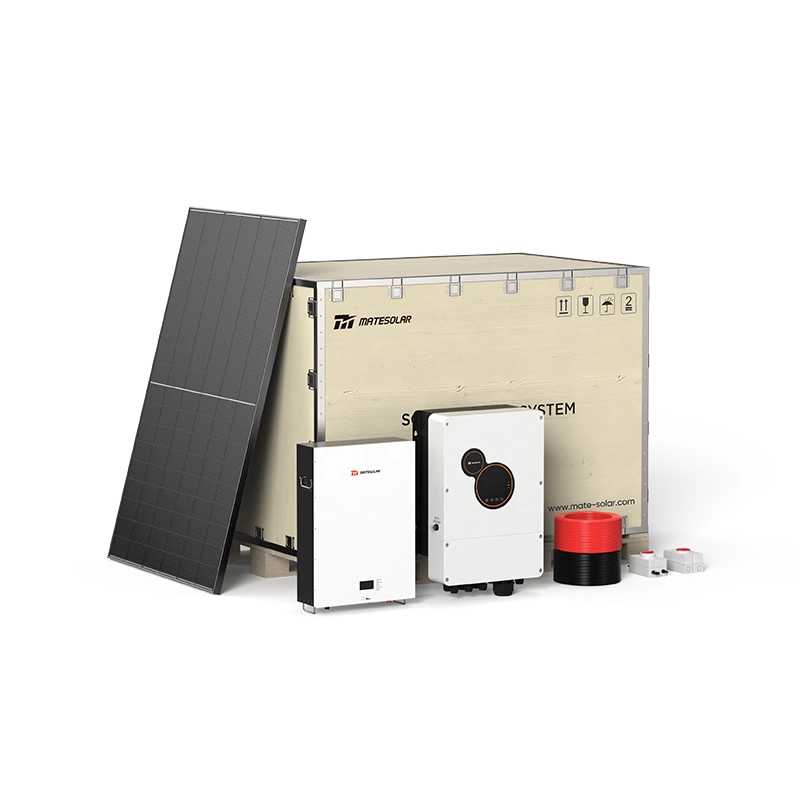
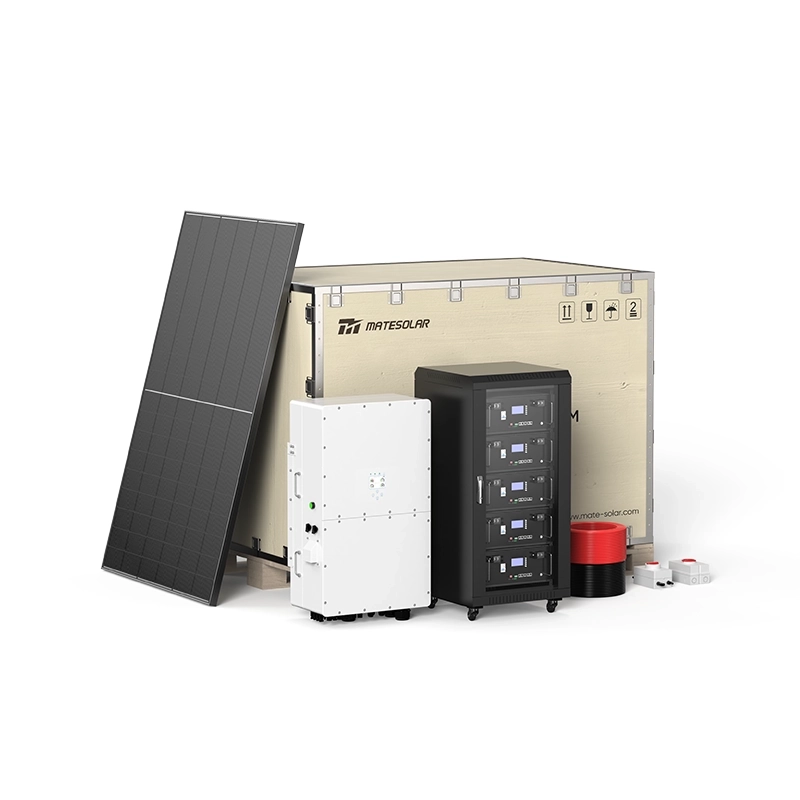
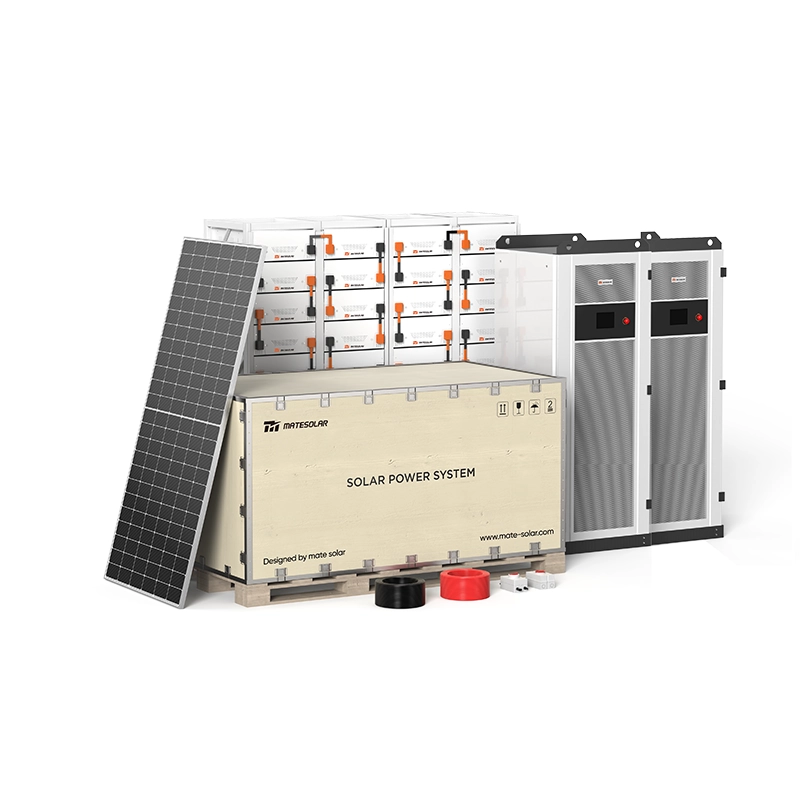
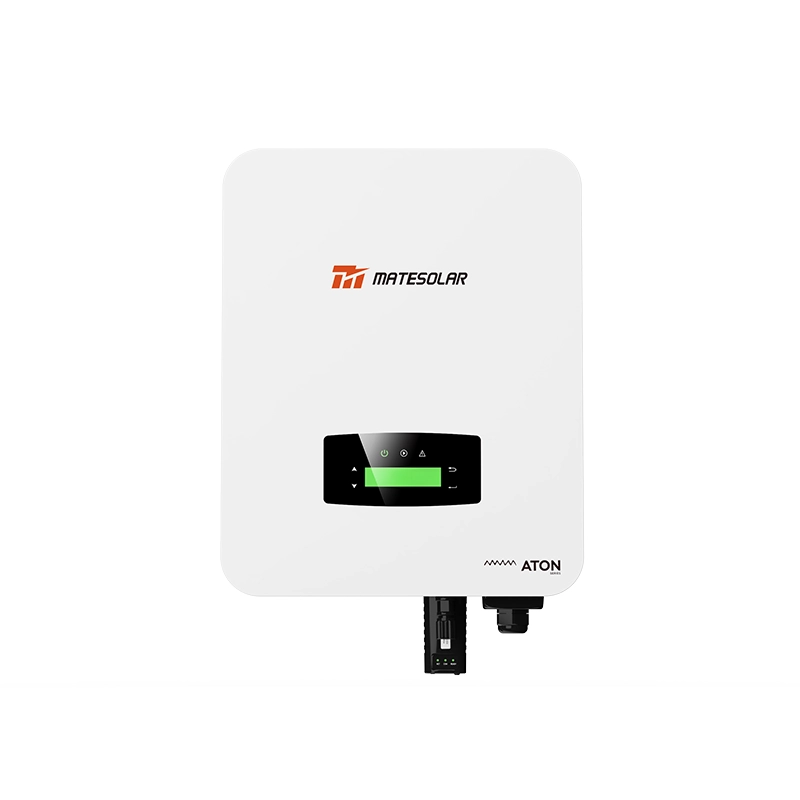
This guide—researched and authored by MateSolar’s energy intelligence team—synthesizes the market fundamentals, product segment dynamics, and the seven most urgent client questions shaping procurement decisions right now. It is designed to serve as the definitive reference document for commercial energy managers, project developers, CFOs, insurers, and EPC contractors navigating the 2026 European storage market. Every section is anchored in primary data, regulatory text, and on-the-ground project experience. Where relevant, we connect specific technical challenges to the product architectures that solve them, including MateSolar’s Commercial 500KW Hybrid Solar System, 100kW/232kWh 125kW/261kWh Liquid-Cooled Outdoor Cabinet Energy Storage System, 40Ft 1MWh 2MWh Air-Cooled Container ESS Energy Storage System, and 20ft 3MWh 5MWh Liquid Cooling Container Energy Storage System.
By the final section, CFOs will have a verifiable IRR framework, project engineers will understand the new fire testing protocols required for insurance, and procurement managers will be able to compare liquid-cooled outdoor cabinets against containerized architectures with quantitative precision. We begin with the fundamental forces reshaping the market.
1. Market Fundamentals: Why 2026 Is the Inflection Year for European C&I Storage
1.1 The Numbers That Define the Opportunity
The European C&I storage market has historically lagged behind utility-scale and residential segments in both volume and policy attention. That era is over. Table 1 summarizes the key market metrics that every stakeholder must internalize.
Table 1: European C&I Energy Storage Market Fundamentals, 2024–2028
| Metric | 2024 (Actual) | 2025 (Estimate) | 2026 (Forecast) | 2028 (Target) | Source / Notes |
| Annual C&I storage installations (GWh) | 4.2 | 6.1 | 12.4 | 24.0 | EU Tripartite Agreement trajectory, EASE, SolarPower Europe |
| Year-on-year growth rate | / | 45% | 103% | ~39% CAGR | Derived from above |
| Cumulative installed C&I storage (GWh) | 9.8 | 15.9 | 28.3 | ~62 | Cumulative build-up |
| C&I solar attachment rate (storage per PV capacity) | ~8% | ~10% | ~14% | ~22% | SolarPower Europe C&I PV tracker |
| Cumulative retrofit opportunity (GWh of PV sites without storage) | 38 | 42 | 46 | / | Based on 90% of C&I PV sites still unpaired |
| Average commercial electricity price (€/MWh, EU weighted) | 152 | 168 | 175 | / | Eurostat, Platts; reflects wholesale + network + taxes |
| German SME electricity price premium vs. large industry | +52% | +56% | +58.6% | / | BDEW, Destatis; SME defined as <2 GWh annual consumption |
| Number of C&I sites with >100 kW peak load in EU-27 | 2.1 million | 2.2 million | 2.3 million | / | EU building stock analysis |
| Grid connection delay for >500 kWh projects (months, DE/NL/BE) | 2–3 | 3–5 | 4–8 | / | Primary interviews with DNOs, developers |
Sources: EU Commission JRC, EASE 2026 Market Monitor, SolarPower Europe C&I Working Group, national regulatory filings. Analysis by MateSolar.
The 12.4 GWh figure for 2026 is not a linear extrapolation of prior trends. It reflects the first full year of operation for multiple structural drivers that were nascent or absent in 2024–2025. We turn to those drivers next.
1.2 Structural Driver One: Ultra-Low Storage Attachment Rates
Across the EU-27, approximately 90% of commercial and industrial photovoltaic systems currently operate without dedicated behind-the-meter storage. The cumulative PV capacity installed on C&I rooftops exceeds 65 GWp as of mid-2026. If these systems were retrofitted at a typical 1:1 DC ratio (1 kWh of storage per 1 kWp of PV), the addressable retrofit market alone would exceed 65 GWh—more than five times the total cumulative C&I storage installed to date.
What has changed in 2026 is that two barriers that previously prevented retrofits are dissolving: (a) the modular outdoor cabinet form factor has simplified physical integration, and (b) the insurance industry, counterintuitively, has created a compliance forcing function that favors properly certified new installations over uncertified legacy approaches. We address both factors in detail later.
1.3 Structural Driver Two: Persistent Electricity Price Elevation and SME Pain
European commercial electricity prices have risen 40–60% since 2021, depending on the member state. Even after the acute energy crisis of 2022–2023 receded, structural factors—nuclear phase-out in Germany, French nuclear fleet underperformance, carbon price escalation to over €110/tCO₂, and LNG market tightness—have kept commercial tariffs 50% above pre-crisis levels.
Small and medium enterprises bear a disproportionate burden. In Germany, businesses consuming less than 2 GWh per year pay an average all-in price of €0.31/kWh, compared to €0.195/kWh for large industrial consumers, a premium of 58.6% as of Q2 2026. This gap is widening because network tariffs, EEG surcharges, and balancing costs are recovered disproportionately from smaller consumers. For a typical German Mittelstand manufacturer with 500 MWh annual consumption, the annual electricity bill now exceeds €155,000. Reducing that bill by 50–70% through PV self-consumption and peak shaving directly translates to a €75,000–€108,000 annual saving—a powerful C-suite motivator that makes the 3.5–4.5 year static payback period in Germany immediately compelling.
1.4 Structural Driver Three: Grid Fragility as a Wake-Up Call
On July 24, 2025, a cascading frequency disturbance originating in the Spanish transmission network blacked out over 50 million people across the Iberian Peninsula and parts of southern France. The event, caused by a combination of low system inertia during a high-renewable-penetration period and a protection relay miscoordination, was Europe’s most severe blackout since 2003. The economic damage exceeded €6 billion, and post-event analysis revealed that distributed storage assets could have provided critical frequency containment reserves that might have arrested the cascade.
The Spain 2025 blackout crystallized a shift that had been underway for years: in a grid with 55%+ instantaneous renewable penetration, synchronous inertia from thermal plants can no longer be relied upon. Storage is the only technically viable source of fast frequency response at scale. For C&I customers, this means that grid outages are no longer theoretical tail risks but a statistically recurrent operational threat. The insurance industry has responded by adjusting business interruption policy premiums for enterprises without backup power, while simultaneously tightening coverage conditions for storage assets themselves—a dual dynamic we explore in Topic One.
Consequently, storage has been recategorized in the boardroom from an “energy cost optimization option” to a “business continuity requirement.” This mental shift is the single most important qualitative change in the 2026 market.
1.5 Structural Driver Four: The Policy Architecture Is Now Permanent and Market-Based
Earlier European storage growth relied heavily on direct capital subsidies—Italy’s Superbonus 110%, various regional German programs, and the early Greek storage tenders. While these programs catalyzed initial deployment, they created boom-bust cycles and did not build self-sustaining economics.
The 2026 policy landscape is fundamentally different. The EU Energy Storage Tripartite Agreement, signed on June 3, 2026, between DG ENER, ENTSO-E, the European Banking Federation, and the storage industry, commits member states to implement a basket of market-based revenue mechanisms by Q1 2027:
- Dynamic network tariffs that reward storage for relieving congestion (live in France from August 2026, piloted in Netherlands and Belgium).
- Capacity remuneration mechanisms accessible to aggregated behind-the-meter storage, with 15-year contracts in France starting November 2026 and similar programs advancing in Italy and Poland.
- Exemption or significant reduction of double-charging (paying network charges both on import and export) for storage, harmonized across the EU by 2027.
- Streamlined grid connection for sub-200 kW systems, with a binding obligation on distribution network operators to process applications within 2 months.
Crucially, these mechanisms improve project internal rates of return (IRR) by 2–3 percentage points compared to energy-only arbitrage models, moving many projects from borderline investable (5–7% unlevered IRR) to comfortably bankable (8–10% unlevered). The shift from subsidy dependency to market-based revenue stacking is what justifies the 167% growth trajectory to 2028.
2. Three Product Segments Reshaping the Market
The term “C&I storage” encompasses a heterogeneous set of product architectures, power classes, and use cases. Three distinct segments have emerged, each with its own technology trajectory, competitive dynamics, and client requirements.
2.1 Segment One: Commercial-Scale BESS (100 kWh to 2 MWh)
This is the highest-growth, highest-demand segment by unit volume. It addresses factories, logistics centers, retail parks, data centers, agricultural operations, hotels, and municipal buildings. The unifying characteristics are behind-the-meter operation, PV self-consumption optimization, peak demand charge management, and time-of-use arbitrage.
Power Class Fragmentation
The market has consolidated around two dominant power nodes:
- 100–125 kW: This is the sweet spot for mid-sized commercial and light industrial sites. It aligns with 1000V and 1500V high-voltage battery clusters, interfaces cleanly with 125A–160A grid connections, and fits within standard electrical room or outdoor footprint constraints. Equipment in this class typically deploys 200 kWh to 400 kWh of storage per power block, scaling to ~1 MWh with parallel cabinets.
- 50–60 kW: This class serves smaller enterprises, farms, and distributed sites where the load profile does not justify the larger form factor. It often integrates with 400V low-voltage distribution boards and requires simplified installation procedures. In Italy and Spain, 50–60 kW systems dominate due to the prevalence of small manufacturing units.
The 1 MWh Single-Cabinet Threshold
A clear product trend in 2026 is the emergence of the single-cabinet 1 MWh energy storage system. Historically, achieving 1 MWh required paralleling multiple cabinets, which multiplied the number of interconnection points, communication nodes, and potential failure modes. New 700 kWh–1.2 MWh integrated cabinets now condense the entire DC battery stack, battery management system, thermal management, and fire suppression into a single outdoor enclosure. The benefits are non-trivial:
- Footprint reduction of 35–50% compared to multi-cabinet architectures.
- Reduced balance-of-system (BOS) costs: fewer DC combiner boxes, fewer communication gateways, less trenching.
- Simplified permitting and fire inspection: a single unit with a single UL 9540A test report (covering the system-level configuration) is far easier to underwrite than a composite installation.
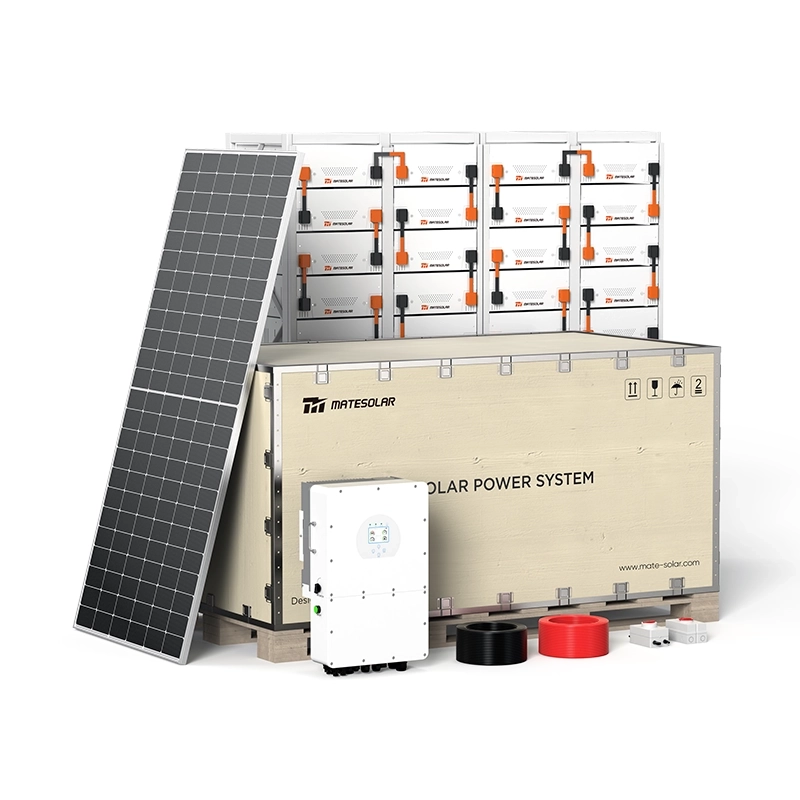
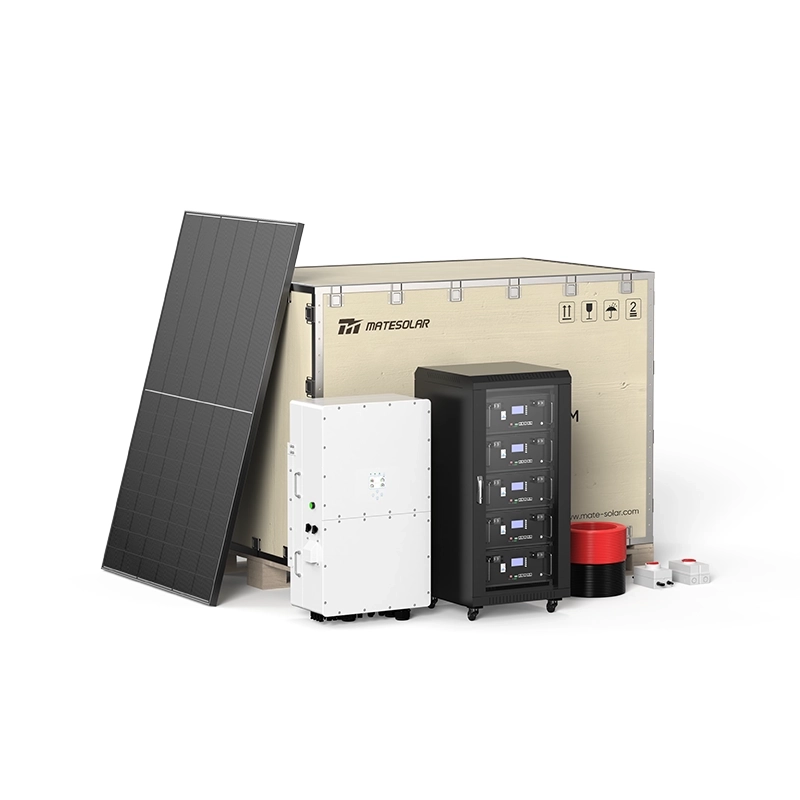
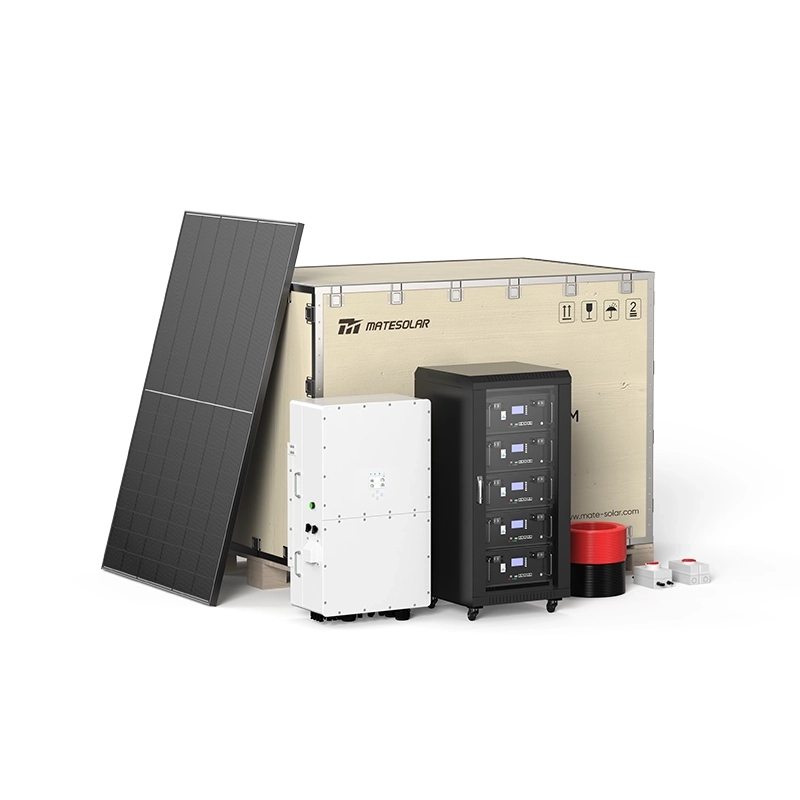
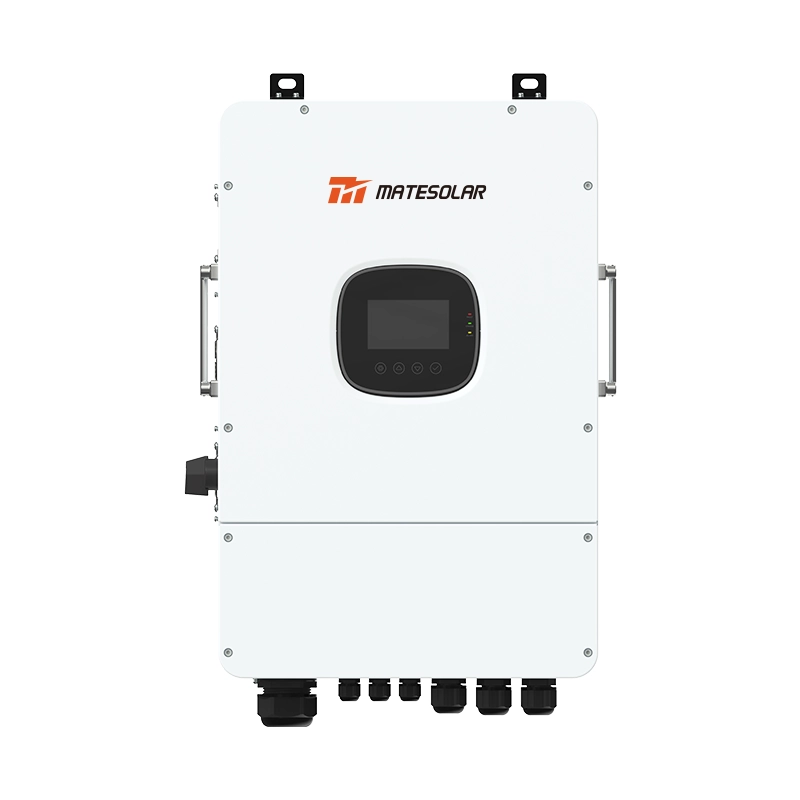
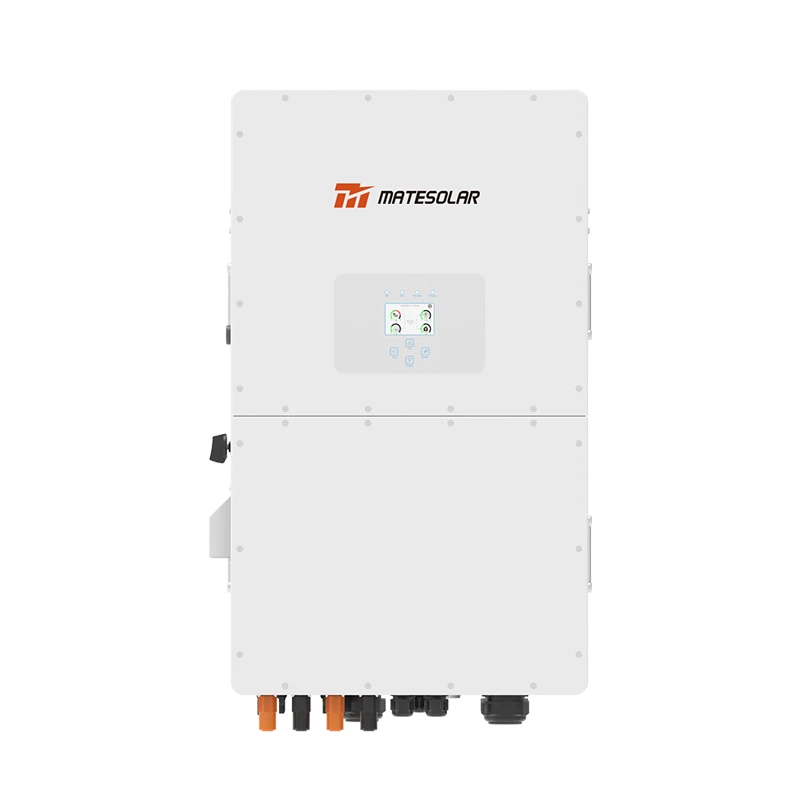
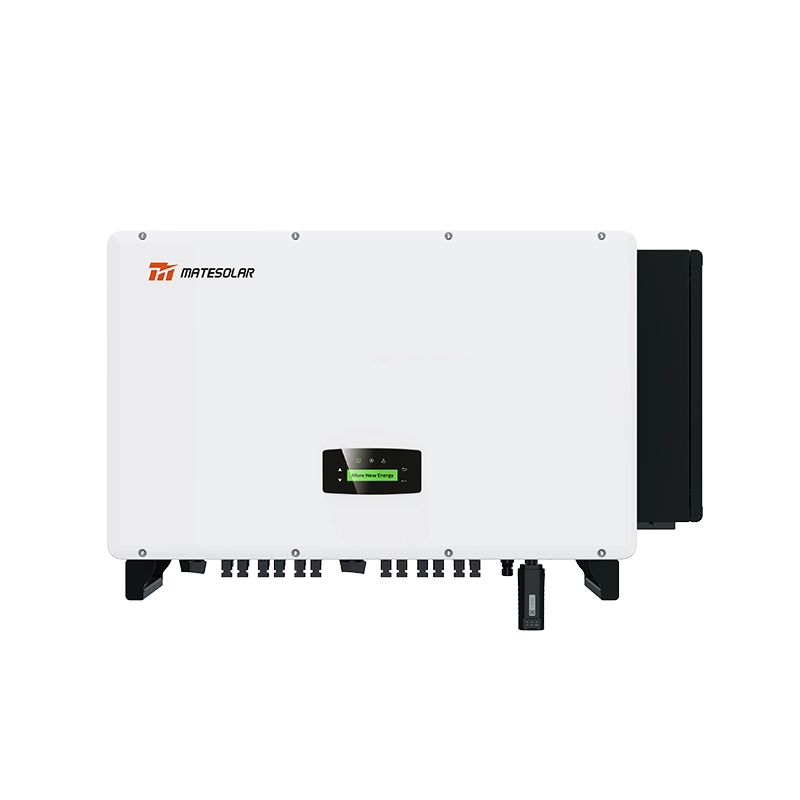
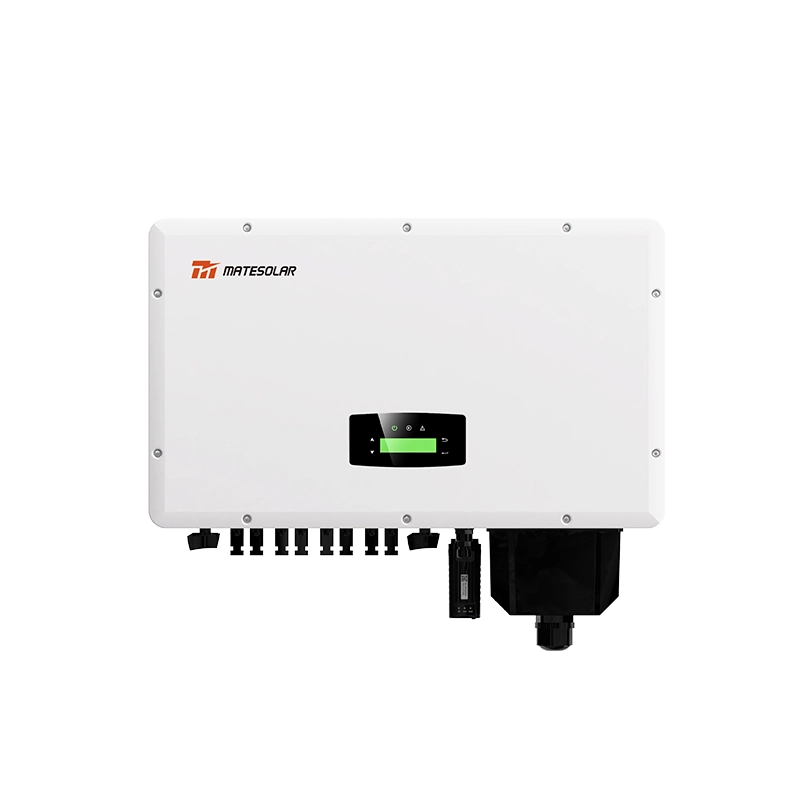
For sites integrating PV, the inverter capacity is often sourced separately. A powerful combination observed across multiple 2026 installations is the pairing of a 1 MWh outdoor cabinet with a 500 kW hybrid inverter—a configuration that maximizes self-consumption while retaining grid export capability. One example of such a platform is MateSolar’s Commercial 500KW Hybrid Solar System, engineered for high-efficiency C&I applications requiring seamless PV-storage integration.
Economic Model for the End User
The dominant value-stacking logic in 2026 combines four revenue and savings streams:
1. PV self-consumption increase: Shifting solar generation from midday export (often at low or negative wholesale prices) to evening consumption. In Germany, this alone can improve the value of solar generation by €0.08–€0.12/kWh.
2. Peak shaving / demand charge management: Commercial tariffs in most EU countries include a capacity charge (€/kW per month or per year) based on the highest 15-minute average demand. A storage system that caps peak demand can reduce this charge by 30–60%. This is especially impactful in Spain, Italy, and France where demand charges can account for 25–40% of the total bill.
3. Time-of-use energy arbitrage: Charging during low-price periods (night, midday solar surplus) and discharging during high-price periods (morning and evening peaks). With 15-minute market settlement intervals now standard, intra-hour price spreads are fully exploitable.
4. Ancillary service participation (where regulation permits): Aggregated behind-the-meter assets are increasingly allowed to bid into frequency containment reserve (FCR) and automatic frequency restoration reserve (aFRR) markets, generating €20–€50/kW-year in additional revenue, depending on the country.
The net result in core markets:
- Germany and UK: static payback period of 3.5–4.5 years, unlevered IRR typically 12–15%.
- Italy and Spain: 5–6 years, IRR 9–12%.
- Netherlands: 8–10 years without subsidies, reflecting low spark spreads and limited demand charges. This market still relies on peak grid fee avoidance and is highly sensitive to net-metering phase-out schedules.
2.2 Segment Two: All-in-One Outdoor Cabinet Storage (Liquid-Cooled, Integrated)
The integrated outdoor cabinet has become the dominant physical form factor for C&I storage in Europe, and it represents the product category where Chinese manufacturers—MateSolar among them—hold the strongest competitive position. The value proposition is simple: a single SKU containing DC batteries, PCS (power conversion system), BMS, HVAC/cooling, and fire suppression, requiring only AC grid connection and a communication interface to begin operation.
Product Evolution in 2026
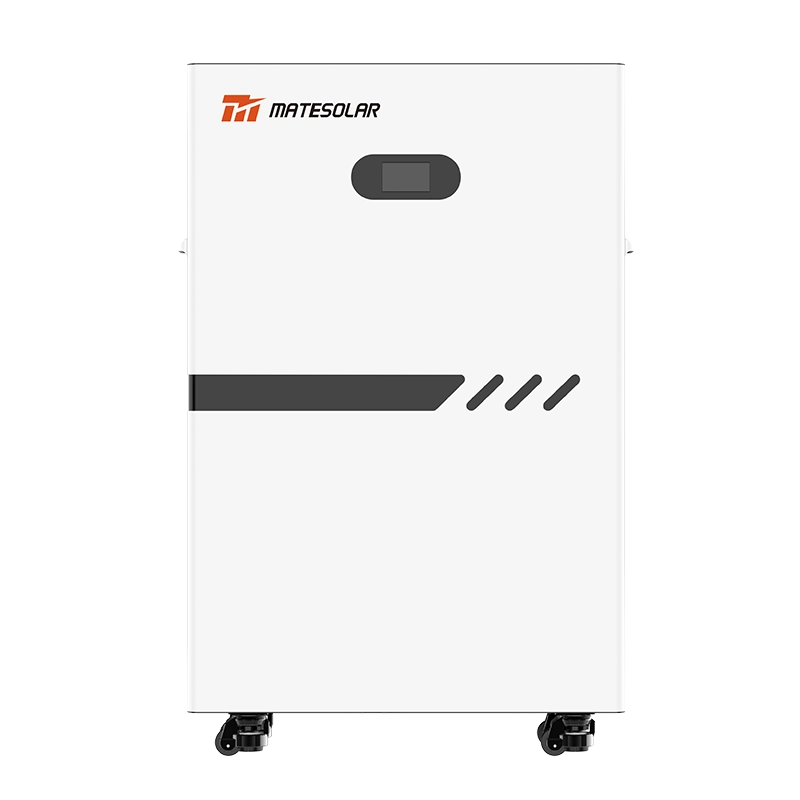
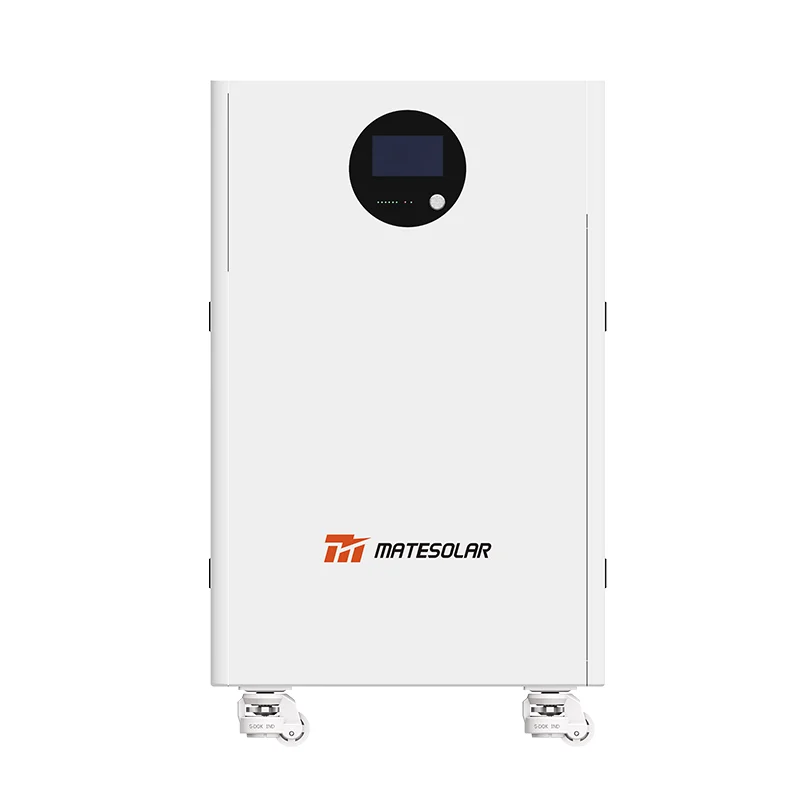
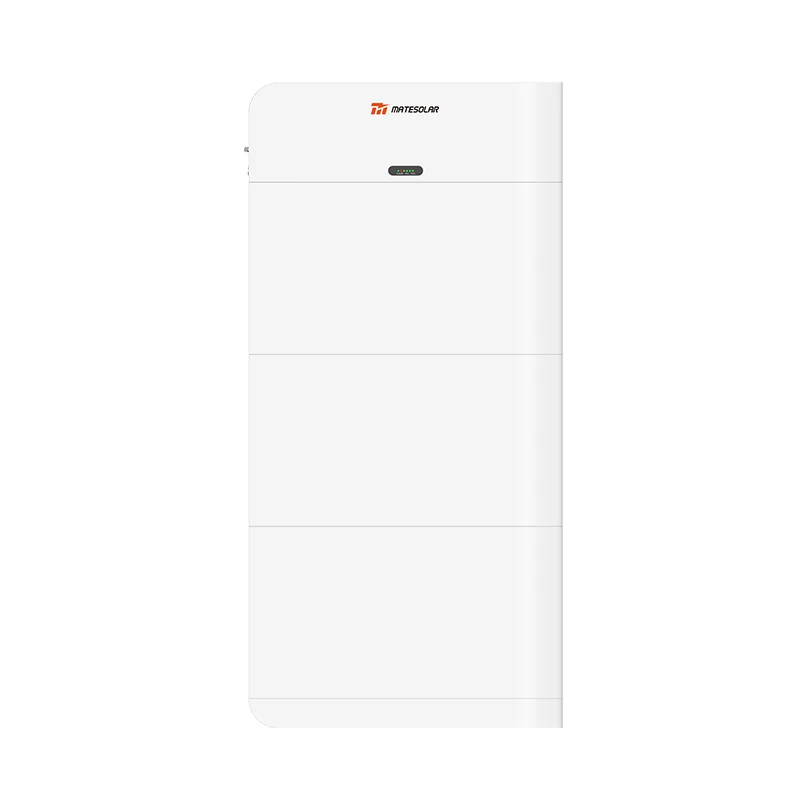
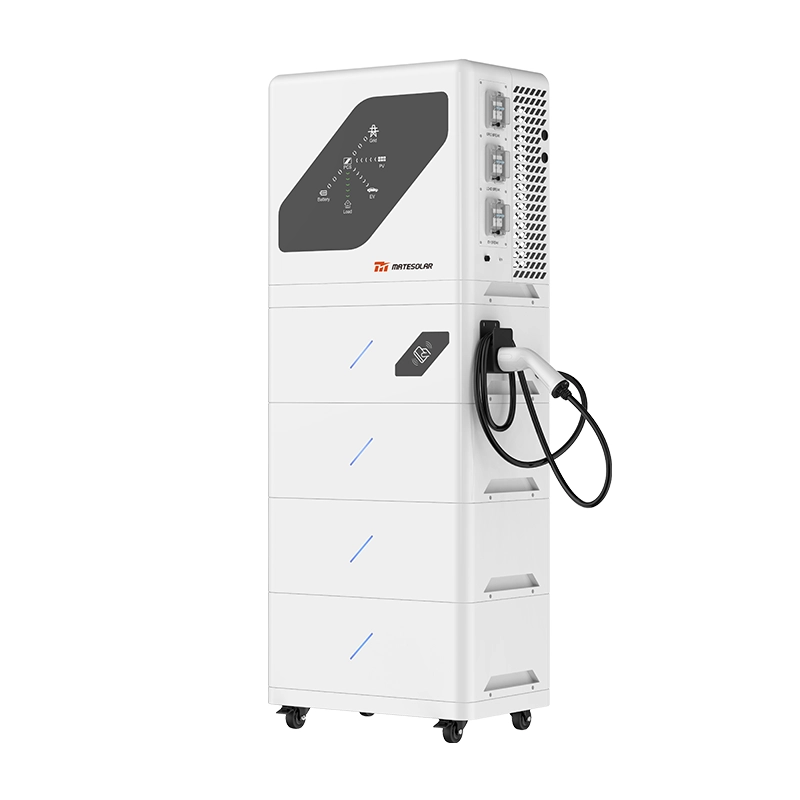
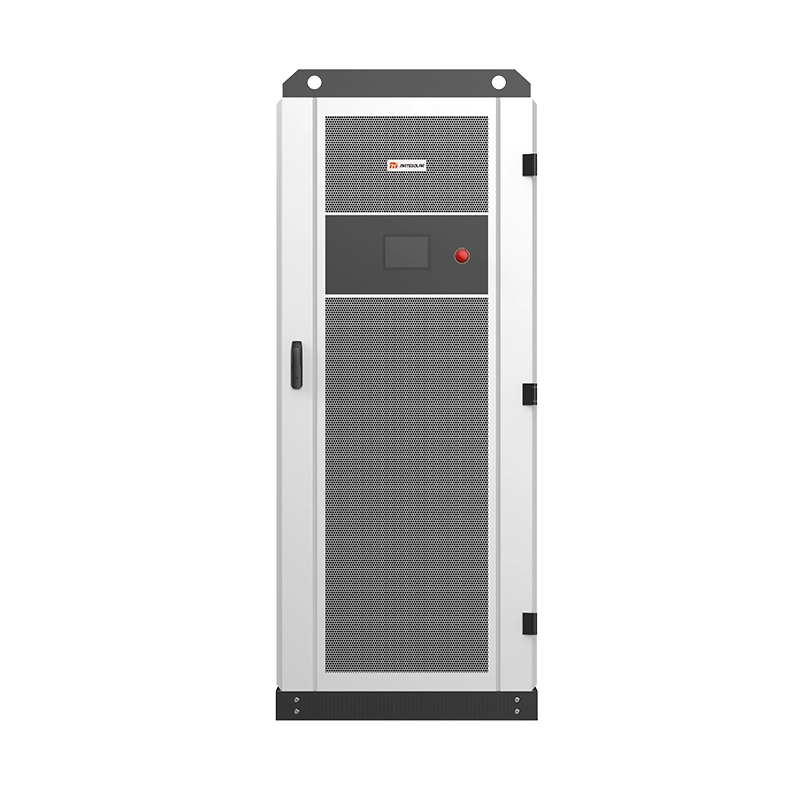
- Higher integration density: AC-DC integration within a single cabinet has moved from a differentiator to a baseline requirement. The most advanced systems in the 100–125 kW segment now deliver 232–261 kWh in a single cabinet footprint of under 1.6 m². MateSolar’s 100kW/232kWh 125kW/261kWh Liquid-Cooled Outdoor Cabinet Energy Storage System exemplifies this class: a fully integrated, liquid-cooled, outdoor-rated enclosure designed for rapid deployment on constrained commercial sites.
- Liquid cooling as the new standard: Passive and forced-air cooling are no longer competitive at the cell energy densities now prevailing (280 Ah and 314 Ah prismatic LFP cells, increasingly moving to 560 Ah+ “jelly roll” formats). Liquid cooling plates maintain cell-to-cell temperature differentials within 2–3°C, compared to 8–12°C for forced air, which directly impacts calendar life and safety. The compound annual growth rate for liquid-cooled outdoor cabinets is projected at 18–22% through 2030, driven by higher cycle count requirements and tighter warranty terms.
- Modular scalability: The ability to start with 100 kW / 230 kWh and later parallel additional cabinets to 500 kW / 1.15 MWh without re-engineering the site electrical infrastructure is a decisive sales argument. It reduces the initial capital outlay and allows customers to match capacity expansion to actual load growth or tariff evolution.
- European code compliance as a pre-integrated feature: The cost and timeline penalty of retrofitting CE, IEC 62933, VDE-AR-N 4110, and UK G99 compliance onto a system not designed for Europe is prohibitive. Leading suppliers now ship with these certifications embedded at the product design stage. Customers must verify, at minimum: (1) CE marking under the Low Voltage Directive and EMC Directive; (2) IEC 62619 safety certification for the battery cells and modules; (3) IEC 62933-5-2 for the integrated system; and (4) grid code compliance certificates for the target country, specifically VDE-AR-N 4110 in Germany, G99 in the UK, CEI 0-21 in Italy, and RD 647 in Spain. Systems lacking these certificates face not just market access barriers but, as of July 2026, outright insurance rejection.
Table 2: Comparison of Outdoor Cabinet Configurations Common in the 2026 European C&I Market
| Parameter | 100 kW / 232 kWh | 125 kW / 261 kWh | 200 kW / 418 kWh (parallel) | Remarks |
| Footprint (m²) | 1.4–1.6 | 1.5–1.8 | 2.8–3.2 | Critical for urban commercial sites |
| Cooling method | Liquid (50% glycol-water) | Liquid | Liquid | Cell ΔT <3°C |
| Round-trip efficiency (DC, system) | 90–91% | 90–91% | 89–91% | Measured at 0.5C charge / 1C discharge |
| AC voltage | 400V 3-phase | 400V 3-phase | 400V 3-phase | Compatible with standard LV boards |
| Grid code compliance | VDE-AR-N 4110, G99, CEI 0-21 | Same | Same | Country-specific firmware variants |
| Fire suppression | Aerosol + water mist + active venting | Aerosol + water mist | Per-cabinet independent | Must meet UL 9540A unit-level test |
| Communication | Modbus TCP, IEC 61850, MQTT-SN | Same | Same | MQTT-SN for remote thermal runaway alarm (IEC 63241-2) |
| Installation time (onsite) | 1–2 days | 1–2 days | 2–3 days | Excludes civil works and grid connection |
Note: Specifications are representative of the 2026 premium product tier. MateSolar’s outdoor cabinet series meets or exceeds these benchmarks; detailed datasheets are available on request.
The outdoor cabinet segment is where speed-to-deployment and insurability intersect most sharply. Because these systems are factory-integrated and factory-tested, they inherently support the full system-level large-scale fire testing (LSFT) that insurers now demand. In contrast, site-assembled multi-component systems require expensive on-site testing or fall into an underwriting gray zone. This dynamic is explored comprehensively in Topic One.
2.3 Segment Three: Large-Scale Commercial & Industrial Solar-Storage Projects (MWh-Scale, Containerized)
Above the 2 MWh scale, the market transitions to containerized energy storage systems. These projects serve large industrial facilities, logistics parks, data center campuses, district energy schemes, and, increasingly, grid-tied commercial aggregations.
2026 marks the first year that utility-scale storage (front-of-meter, typically >10 MW) exceeds 30% of total European storage installations, with new additions of approximately 13 GW, a 50% year-on-year increase. Within the large C&I segment, the 10 MWh to 100 MWh project class is the most active.
Product Architecture
The standard building block is a 20-foot or 40-foot ISO container integrating batteries, PCS, thermal management, fire suppression, and auxiliary power. Two distinct container architectures dominate:
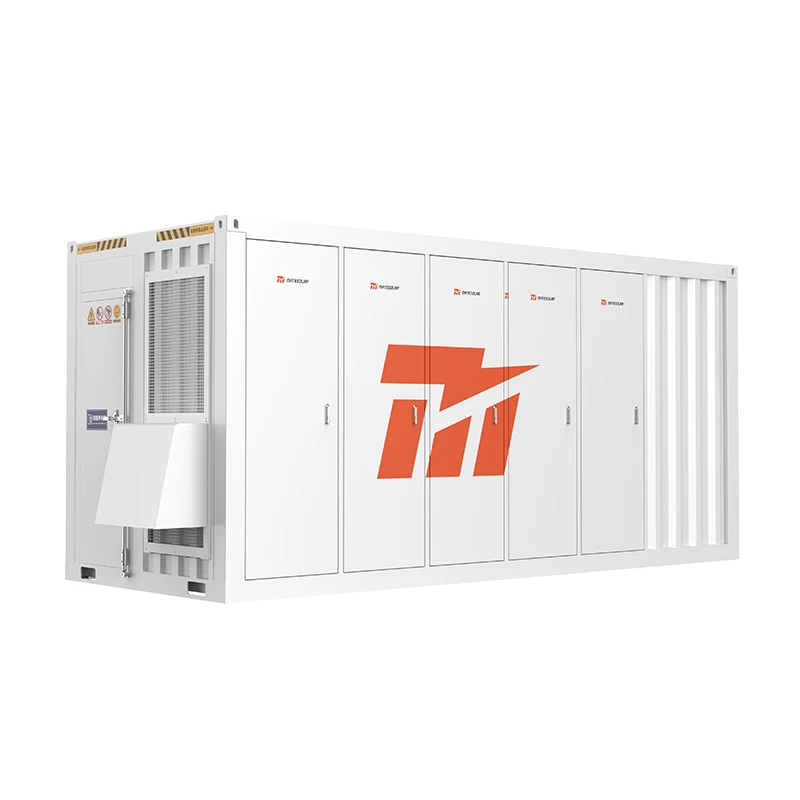
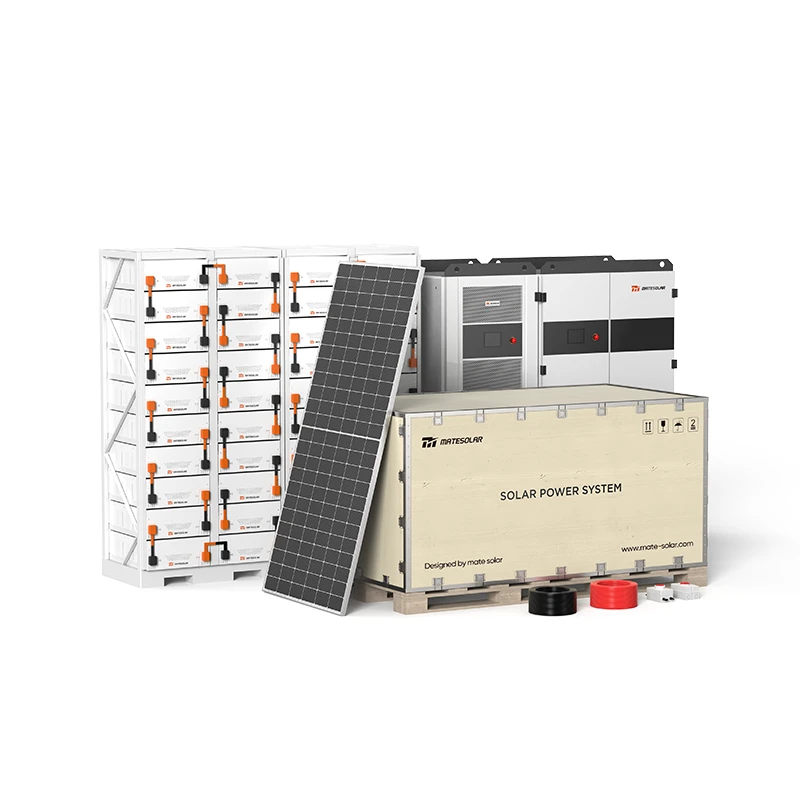
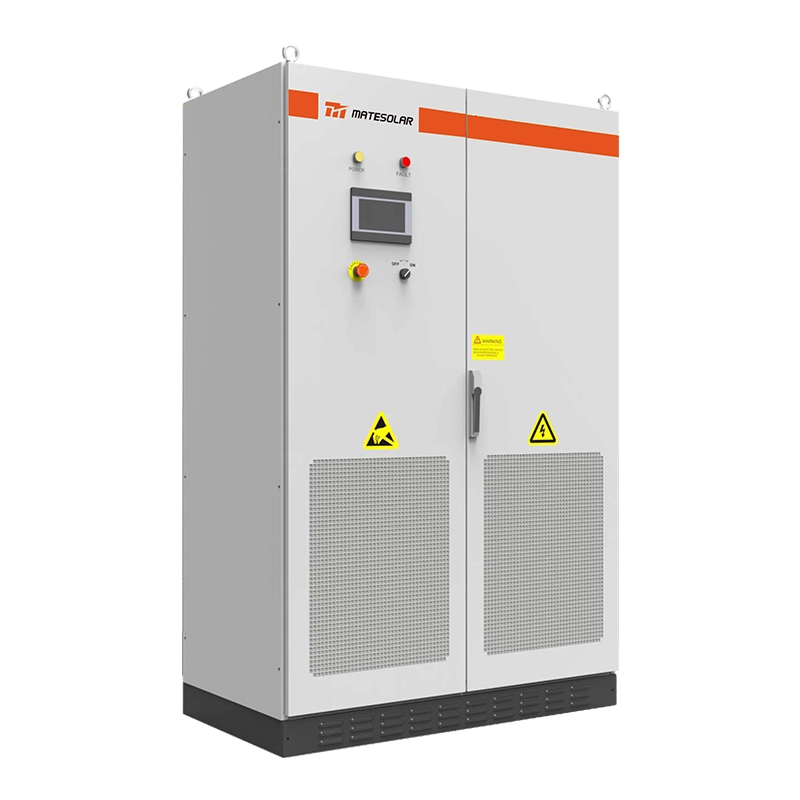
- Air-cooled containerized systems in the 1–2 MWh range per 40-foot container. These are cost-optimized solutions where the lower energy density and simpler thermal management translate to lower capital cost per kWh. They suit applications with modest cycle frequency (1 cycle per day) and in temperate climates. MateSolar’s 40Ft 1MWh 2MWh Air-Cooled Container ESS Energy Storage System is designed precisely for this deployment profile, offering robust, easily installable energy storage with proven reliability.
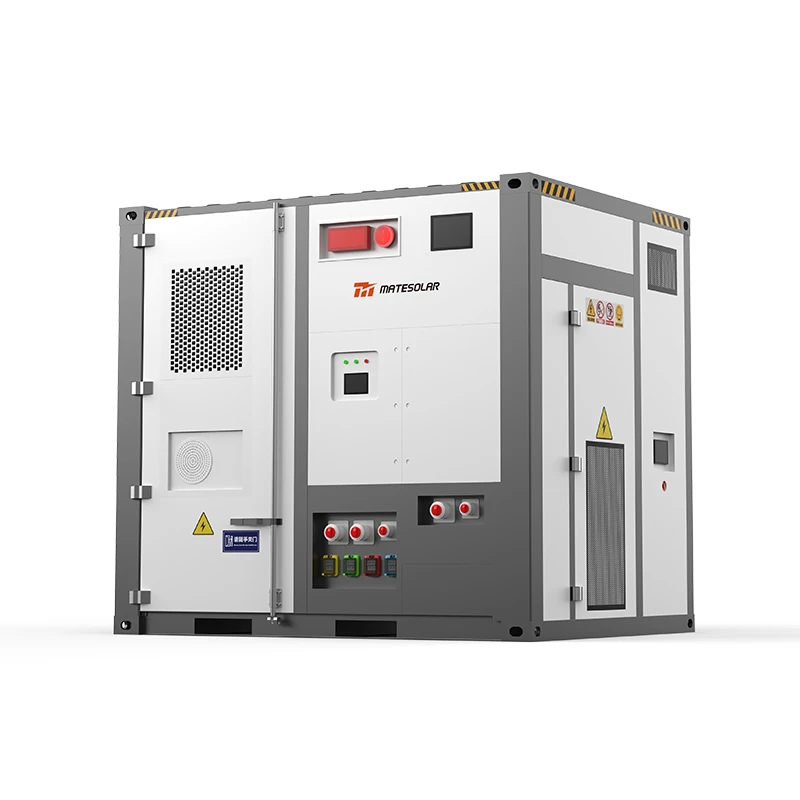
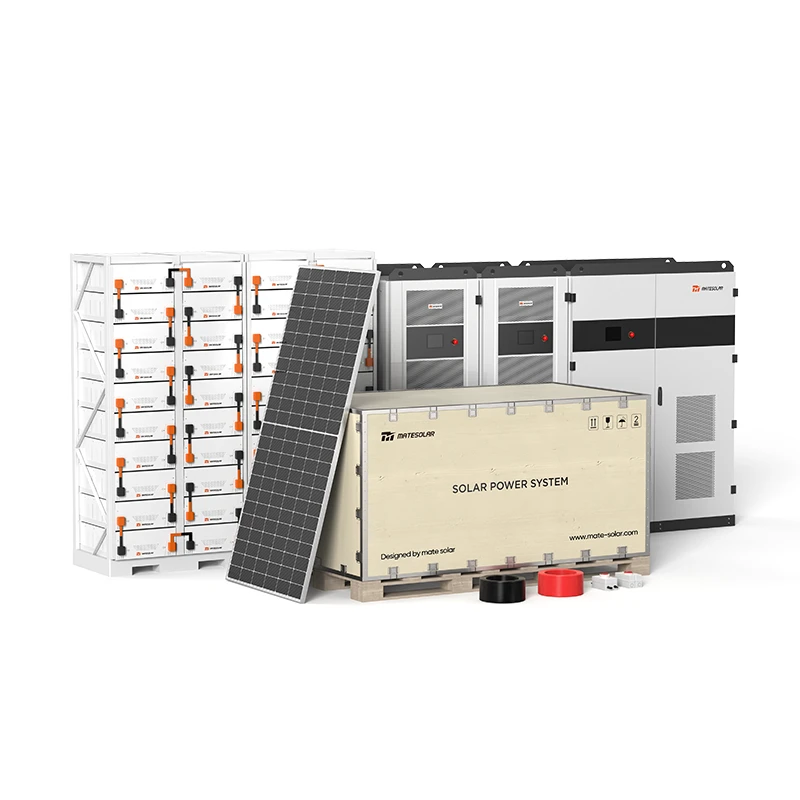
- Liquid-cooled containerized systems delivering 3–5 MWh per 20-foot container. These high-density systems reduce land usage by 50–70% per MWh and reduce balance-of-plant costs, but require more sophisticated commissioning and maintenance. The higher energy density is achieved through advanced cell packing and liquid cooling, which also extends cycle life. The 20ft 3MWh 5MWh Liquid Cooling Container Energy Storage System represents the state of the art in 2026 for high-throughput, space-constrained sites.
Revenue Model Complexity
Large C&I and grid-tied projects derive value from a multi-layered revenue stack:
1. Wholesale energy arbitrage: Operating on the day-ahead and intraday markets, exploiting the 15-minute settlement intervals. The 2026 spread profile shows strong winter evening peaks (€120–€180/MWh) and deep midday troughs (€0 to negative €50/MWh during solar cannibalization periods). Germany recorded nearly 600 hours of negative wholesale prices in the 12 months ending June 2026, presenting a unique “charge and get paid” opportunity.
2. Capacity market contracts: In France, the November 2026 capacity auction will award 15-year contracts to qualified storage assets. The UK Capacity Market clearing price for delivery year 2026–27 was £63/kW-year. For a 10 MW / 20 MWh asset, this translates to £630,000 in annual contracted revenue.
3. Frequency response and ancillary services: FCR and aFRR markets in Germany, the Netherlands, and the Nordics offer €20–€50/kW-year. The 2026 trend is toward faster response products (sub-second for FCR) that only storage can provide.
4. Grid congestion relief: In the Netherlands, TenneT and regional DSOs have launched flexibility procurement platforms where storage assets are paid €15–€25/MWh for congestion-avoiding dispatch.
Policy Risk: PCS Origin and EU Funding Access
An important risk differentiator has emerged in 2026: projects using non-European power conversion systems (PCS) are ineligible for European Investment Bank (EIB) financing and certain EU structural fund co-financing. This affects approximately 23% of the addressable large-storage market that relies on subsidized capital. However, it is essential to understand the scope of this restriction:
- It applies specifically to EU public funding instruments (EIB, Innovation Fund, Connecting Europe Facility).
- It does not apply to purely commercial and industrial behind-the-meter projects, which represent the overwhelming majority of C&I installations.
- It does not restrict operation, grid connection, or revenue participation in energy markets.
- Chinese PCS manufacturers are actively establishing European assembly and software development centers to qualify for “European origin” status by 2028.
For C&I customers deploying MateSolar systems, this restriction is largely irrelevant: the target applications are behind-the-meter commercial installations not dependent on EU public finance. Nevertheless, the distinction should be explicitly confirmed during project structuring.
Grid Connection: The Hidden Schedule Killer
The single largest source of project delay in 2026 is grid connection approval. In Germany, the Niederspannungsanschlussverordnung and associated distribution network operator (DNO) processes have created a bottleneck: projects above 500 kWh routinely face 4–8 months of review, with the clock starting only after complete documentation is submitted. In the Netherlands, capacity scarcity in low-voltage and medium-voltage networks means that new connections in congested areas are subject to transportverzuim (transport capacity refusal), effectively placing them in a queue until the DSO reinforces the network.
Mitigation strategies that successful developers employ include:
- Project splitting: Designing installations as multiple sub-200 kW units, each qualifying for the simplified EU notification procedure under the revised Renewable Energy Directive. This is legally permissible provided each unit has its own inverter, protection, and metering.
- Cable pooling (Poland): The Polish Energy Regulatory Office’s cable pooling framework allows storage assets to share a grid connection point with an existing renewable generator, bypassing the new connection queue. This model is being studied for broader European adoption.
- Pre-application engagement: Investing in early technical dialogue with the DNO, including power flow studies and hosting capacity analysis, can cut 6–10 weeks from the approval timeline.
3. The Seven Critical Client Topics: 2026’s Definitive Operational and Strategic Guide
With the market fundamentals and product segments established, we now address the seven issues that dominate client conversations in the field. These are not theoretical concerns. They are the specific obstacles and opportunities that determine whether a storage project proceeds, stalls, or fails entirely.
Topic One: Compliance and Insurability – “I Bought a Cheap System and My Insurer Rejected It. Now What?”
Context. The Intersolar 2026 conference (Munich, June 10–12) was a watershed moment for the European storage insurance market. Multiple European insurers and reinsurers, including Allianz Global Corporate & Specialty, AXA XL, and HDI Global, publicly announced materially tightened underwriting requirements for commercial battery energy storage systems (BESS). The precipitating factors were: (a) a cluster of five C&I storage fire incidents across Europe in Q1 2026 that resulted in >€40 million in combined property damage and business interruption claims; (b) post-incident investigations revealing that four of the five systems lacked system-level large-scale fire testing; and (c) pressure from the European Insurance and Occupational Pensions Authority (EIOPA) to harmonize BESS risk assessment methodologies.
The practical consequence is that procurement decisions made without rigorous insurance due diligence are now being unwound. We have documented cases in Germany and the UK where fully installed and commissioned systems were denied operational coverage because the equipment supplier could not produce a valid UL 9540A test report or the equivalent IEC certification. Banks financing these projects have similarly tightened requirements, in some cases issuing loan covenant default notices.
The New Compliance Stack (July 2026)
To secure insurance—and therefore project finance—a C&I BESS installation must now satisfy the following minimum compliance package:
1. UL 9540A, 6th Edition (effective March 2026): The defining change is the mandatory Large-Scale Fire Test (LSFT). The 5th Edition permitted cell-level and module-level testing with extrapolation to system behavior; the 6th Edition mandates a full-scale fire test on a production-representative unit in its final enclosure configuration. The test must demonstrate:
- No propagation of thermal runaway beyond the initiating module.
- No ejection of flaming material from the enclosure.
- No explosion hazard (measured by pressure and gas concentration).
- Effective activation of the integrated suppression system.
Insurers universally require the test report to be dated within the last 3 years and to cover the exact system model being deployed. “Similar” or “scaled” tests are being rejected.
2. IEC 63241-2:2026 – Remote Thermal Runaway Early Warning (published July 6, 2026, mandatory from December 1, 2026): This brand-new standard, published just four days before the date of this article, is already being incorporated into insurer checklists. It requires:
- Continuous monitoring of cell-level voltage, temperature, and internal pressure (or equivalent proxy parameters) for early detection of thermal runaway precursors.
- Communication of alarm signals within 5 seconds of detection using MQTT-SN protocol over a secure channel.
- Compatibility with industry-standard energy management systems, specifically naming Siemens Desigo CC and Schneider Electric EcoStruxure platforms as reference implementations.
- A supervisory signal heartbeat that, if interrupted for more than 60 seconds, triggers an automatic safe-state shutdown.
For equipment suppliers, IEC 63241-2 compliance is non-negotiable for any system deployed after December 2026. MateSolar’s 2026 product generation incorporates MQTT-SN communication with embedded alarm logic, pre-validated for Siemens and Schneider integration.
3. UK BS 7671, Amendment 4 (effective July 2026): The Institution of Engineering and Technology (IET) published the fourth amendment to the 18th Edition Wiring Regulations in July 2026, with immediate effect. Key new requirements for battery storage installations:
- Minimum separation distance of 1.0 meter between battery enclosures and any building opening (door, window, ventilation intake), increased from the previous 0.6 meters.
- Mechanically forced ventilation in the storage enclosure or room, rated for a minimum of 5 air changes per hour under normal operation and 15 air changes per hour during an alarm state.
- Monthly functional testing and documented verification of fire suppression media (aerosol generators, water mist nozzles, gas cylinders), with records retained for a minimum of 5 years and provided to the building insurer upon request.
- A dedicated “fireman’s switch” external to the building, clearly labeled, that simultaneously disconnects AC and DC circuits.
Crucially, the local building control body will not issue a completion certificate—and therefore the system cannot legally operate—without the installer’s declaration that these provisions have been met and independently verified. This has created a new bottleneck in the UK market, as the number of qualified independent verifiers is limited.
4. L-Class Fire Classification and the Extinguishment Problem: The European classification system for lithium-ion battery fires has adopted the “L” fire class, distinguishing these fires from ordinary electrical (Class E) and flammable liquid (Class B) fires. An L-class fire involves thermal runaway propagation, flammable gas generation (primarily hydrogen, carbon monoxide, and volatile organic compounds), and the potential for vapor cloud explosion. Traditional extinguishing agents—dry powder, CO₂, standard AFFF foam—are ineffective and in some cases dangerous when applied to an L-class fire.
The insurance-mandated response strategy has shifted from “extinguish” to “controlled burn with containment.” This means:
- The enclosure must be designed to contain a full thermal runaway event without structural failure for a minimum of 2 hours (fire resistance rating).
- External cooling water application to adjacent structures is permitted, but direct water injection into the battery enclosure is contraindicated unless specifically designed and tested (water can generate hydrogen via reaction with lithium, and can cause short circuits in undamaged cells).
- The fire brigade’s operational doctrine now accepts a 6–10 hour “let it burn” period for small cabinet systems, with perimeter control and air monitoring.
This shift has profound implications for building design, setback distances, and business continuity planning. We address operational and insurance dimensions of L-class fires in Topic Six.
Table 3: Compliance Requirements for C&I Battery Storage – Insurer Checklist, July 2026
| Requirement | Standard / Regulation | Effective Date | Verification Method | Consequence of Non-Compliance |
| System-level large-scale fire test | UL 9540A 6th Ed. | March 2026 | Test report from accredited lab (UL, TÜV, Intertek) | Insurance denial, bank financing withdrawal |
| Remote thermal runaway early warning | IEC 63241-2:2026 | Dec 1, 2026 | MQTT-SN protocol verification, EMS integration test | Cannot be commissioned after Dec 2026; retroactive insurance exclusion |
| Installation safety – UK | BS 7671 Amend. 4 | July 2026 | Independent verifier inspection, completion certificate | System cannot legally operate; landlord / mortgage compliance breach |
| CE / UKCA marking | LVD, EMC, Machinery Directives | Continuous | Declaration of Conformity, technical file | Market access denied, customs seizure |
| Grid code compliance | National (VDE-AR-N 4110, G99, etc.) | Continuous | DNO witness testing | No grid connection; existing connection can be disconnected |
| Fire suppression functionality | Local building code + insurer | Monthly | Documented test records | Insurance policy voidance |
Action: Before issuing a purchase order, require the supplier to provide the exact UL 9540A 6th Edition test report for the system configuration being purchased. Cross-check the report’s model number, test date, and tested configuration against the commercial proposal. If these do not match precisely, insurance coverage is at risk.
Topic Two: France TURPE 7 Tariff Reform – The August 2026 Deadline and How to Capture the Full Value
Context. On August 1, 2026, the French energy regulator, Commission de Régulation de l’Énergie (CRE), will implement the seventh iteration of the Tarif d’Utilisation des Réseaux Publics d’Électricité (TURPE 7), the grid usage tariff that governs all electricity consumers and producers connected to the public distribution and transmission networks. This is not a routine tariff update. TURPE 7 represents the most fundamental redesign of French grid pricing in two decades, and it creates asymmetric value opportunities for storage operators who adapt their dispatch strategies quickly—and asymmetric cost penalties for those who do not.
The Old Logic, Obsolete
Under TURPE 6 (2021–2026), commercial consumers paid a grid tariff composed of:
- A fixed annual subscription (€/year, based on contracted capacity).
- A volumetric component (€/MWh, proportional to energy withdrawn).
- A reactive power penalty (for poor power factor).
- A peak demand component (€/kW per year) based on the highest winter peak.
Storage systems were optimized under the assumption that grid charges were essentially fixed or predictably variable with total consumption. Load shifting from peak to off-peak periods reduced the volumetric and peak demand components, but the fundamental price signals were temporally coarse (peak/off-peak blocks).
TURPE 7: “Injection-Soutirage” Dynamic Pricing
TURPE 7 introduces three structural changes:
1. Replacement of fixed volumetric charges with “injection-soutirage” (injection-withdrawal) time- and location-differentiated rates. The grid tariff is now a function of (a) whether the site is injecting power into the grid (export) or withdrawing (import), (b) the time of day in 15-minute granularity, and (c) the specific 15-minute nodal zone out of approximately 3,000 distribution zones across continental France.
2. Zonal differentiation based on grid congestion. CRE has mapped the entire distribution grid into zones with five congestion levels (A through E, A being lowest congestion, E being critically congested). In congestion zones D and E, injection during midday solar peaks (11:00–16:00, April–September) incurs a negative grid charge—effectively a penalty for exporting when the local grid is saturated. Conversely, withdrawal during winter peak hours (08:00–12:00 and 17:00–21:00, November–February) in these zones carries a steep premium, but injection during those same hours (i.e., discharging a battery) earns a grid compensation payment.
3. Introduction of a dedicated storage tariff class. For the first time, storage facilities can register under a specific “stockage” tariff code that exempts them from double-charging (paying both injection and withdrawal charges on the same stored electron). This requires a separate metering point and approval from Enedis or the local DSO.
The Financial Impact for C&I Storage
The practical effect of TURPE 7 on a representative 500 kW / 1 MWh C&I storage system in a D-zone (moderate-to-high congestion) in southern France is summarized below.
Table 4: Estimated Annual Grid Charge Impact Under TURPE 7 – 500 kW / 1 MWh C&I Storage, Zone D, Southern France
| Revenue/Cost Element | TURPE 6 (Old) | TURPE 7 (New) | Delta | Note |
| Fixed subscription | €2,800 | €2,100 | -€700 | Storage tariff code discount |
| Volumetric withdrawal (€/MWh) | €18.50 | €12.00 – €34.00 (time & zone dynamic) | / | High variance, average down if optimized |
| Volumetric injection (€/MWh) | N/A (rolled into withdrawal) | -€8.00 to +€15.00 | / | Negative = penalty for midday export; positive = reward for peak discharge |
| Peak demand charge (€/kW-yr) | €22.00 | €28.00 in peak hours, €6.00 off-peak | / | Strong incentive to shave winter peaks |
| Grid compensation for congestion-relieving discharge | None | Up to €18/MWh in Zone D/E during peak hours | +€4,500/yr | Based on 250 MWh of peak discharge |
| Net annual grid cost (optimized dispatch) | €21,000 | €12,600 | -€8,400 | -40% |
Source: CRE TURPE 7 consultation documentation, MateSolar modeling. Individual site results vary by load profile, zone, and PV configuration.
The data shows a potential 40% reduction in grid-related costs if the storage dispatch is optimized for the new tariff structure. This translates to an IRR uplift of approximately 1–2 percentage points for a typical C&I project, which can be the difference between a board-approved and a rejected capital expenditure proposal.
The November 2026 Capacity Market: 15-Year Revenue Visibility
Separately, France’s capacity market mechanism (mécanisme de capacité) will conduct its next long-term auction in November 2026, awarding 15-year capacity contracts for delivery starting winter 2028–29. Behind-the-meter storage assets aggregated into a virtual power plant (VPP) are explicitly eligible, provided they can demonstrate 2-hour minimum discharge duration and telemetry integration with RTE’s scheduling system.
Strategic action for storage developers: begin the certification process with an approved VPP aggregator (Voltalis, Energy Pool, Flexcity, etc.) by September 2026 to be ready for pre-qualification in October. The capacity certificate value in the 2025 auction was approximately €35,000/MW-year; a 500 kW asset would generate €17,500 in annual contracted capacity revenue, index-linked and highly creditworthy. This revenue layer, combined with TURPE 7 grid charge savings and energy arbitrage, produces a compelling risk-adjusted return profile unmatched in any other European market at this time.
Key client message: If you operate a storage system in France and have not updated your dispatch algorithm for TURPE 7 by August 2026, you are leaving €6,000–€10,000 per year per 500 kW system on the table—and potentially paying penalties for unoptimized midday injection.
Topic Three: 15-Minute Trading and Dynamic Tariffs – Extracting Every Euro of Value from Intra-Day Volatility
Context. The European intraday and day-ahead electricity markets completed their migration to 15-minute settlement intervals (from 60-minute) as of January 2026 for all coupled markets. Simultaneously, Germany’s Energiewirtschaftsgesetz amendment (EnWG §41a) now mandates that every electricity supplier with more than 50,000 customers must offer at least one dynamic tariff product that passes through wholesale price signals at 15-minute granularity. By Q3 2026, over 12 million commercial electricity meters in Germany alone are capable of 15-minute interval metering and are eligible for dynamic tariffs. The rest of the EU is on a similar trajectory, with the Electricity Market Design Reform (Regulation 2024/1747) requiring member states to enable dynamic tariffs by 2027.
The practical implication: Any storage system still operating on a rule-based dispatch that only makes decisions once per hour is leaving significant money on the table. The 15-minute market regularly produces intra-hour price spreads of €30–€60/MWh, especially during the morning ramp (06:00–08:00) and evening peak (17:00–20:00) when renewable ramping creates steep short-duration price gradients.
Quantifying the Missed Value
Analysis of 12 months of German day-ahead and intraday 15-minute price data (July 2025–June 2026) yields the following results when comparing dispatch strategies on a 500 kW / 1 MWh storage asset:
- Hourly rule-based dispatch (charge during 6 cheapest hours, discharge during 6 most expensive hours): captured 71% of the theoretical maximum energy arbitrage value.
- 15-minute price-forecast dispatch (rolling optimization with perfect foresight as benchmark): captured 91% of theoretical maximum.
- AI/ML predictive dispatch (reinforcement learning agent trained on 3 years of price, load, and renewable forecast data): captured 85% of theoretical maximum in out-of-sample testing, demonstrating an 8–15% uplift over rule-based control.
The annual delta between a rule-based and an AI-driven dispatch strategy was approximately €3,800 per 100 kW of storage capacity, or 2.5–3.0 percentage points of unlevered project IRR.
The Negative Price Opportunity
Europe’s wholesale electricity markets experienced an unprecedented frequency of negative prices in the 12 months to June 2026. Germany recorded 598 hours of negative day-ahead prices (6.8% of all hours), heavily concentrated in the midday solar peak (11:00–16:00) during spring and summer months. The average negative price during these events was -€42/MWh, with extreme instances reaching -€120/MWh.
For a 1 MWh storage system, being able to charge during negative price hours and discharge during the subsequent evening peak (which averaged €156/MWh in the same summer months) represents a gross spread of up to €276/MWh—before grid charges and losses. Even accounting for round-trip losses (10%) and variable grid fees, the net spread regularly exceeds €200/MWh. A system capable of executing this cycle on 150 days per year (a realistic frequency based on 2026 solar profile analysis) captures €30,000 in annual arbitrage margin per MWh of storage capacity.
Demand Charge Management at 15-Minute Resolution
The “ratchet effect” in commercial demand charges is one of the least understood but most punitive features of commercial electricity tariffs. In most EU tariff structures, the demand charge (€/kW) is not based on the average monthly peak but on the single highest 15-minute interval peak across the entire 12-month billing period. One poorly managed afternoon—a cloud passing over the solar array causing a load spike before storage can respond, or an unscheduled manufacturing process coinciding with a grid import peak—can set the demand charge for the next 12 months, inflating the annual electricity bill by €5,000–€15,000 for a mid-sized commercial site.
Storage systems designed to cap demand must be capable of sub-second response and continuous 15-minute rolling window optimization. A simple threshold-based control (“if load > target, discharge”) will miss fast transients and may respond prematurely, depleting stored energy before the true tariff-relevant peak. The state-of-the-art solution is model predictive control (MPC) that forecasts site load for the next 2 hours at 15-minute resolution, calculates the probability distribution of demand charge impacts, and dispatches storage to minimize the expected annualized demand charge cost.
Technology Requirement: BMS with High-Resolution Scheduling
To participate effectively in 15-minute markets and dynamic tariffs, the battery management system must support:
- Sub-second power setpoint updates via Modbus TCP or IEC 61850.
- Time-synchronized scheduling with Network Time Protocol (NTP) accuracy better than 100 ms.
- Onboard schedule storage for 24–48 hours (so that operation continues uninterrupted if the site controller or cloud connection fails).
- A local control mode that can execute time-of-use charging/discharging using a stored tariff table, updated daily via API.
Many legacy BMS designs, particularly those derived from residential or telecom backup applications, lack this capability. When evaluating equipment, require the supplier to demonstrate 15-minute schedule execution with time-stamped power export data.
Topic Four: Grid Connection – Escaping the Approval Bottleneck
Context. The grid connection crisis for storage projects is no longer anecdotal—it is systematically documented. A survey by the European Association for Storage of Energy (EASE) of 120 C&I storage developers in Q2 2026 found:
- Average connection approval time for systems >500 kWh: 7.3 months in Germany, 6.8 months in the Netherlands, 5.9 months in Belgium.
- Percentage of applications requiring grid reinforcement studies: 42% in the Netherlands (primarily due to medium-voltage transformer saturation in industrial areas), 28% in Germany.
- Projects abandoned due to grid connection delays and costs: 16% of projects that reached the application stage were subsequently cancelled, representing approximately 1.2 GWh of unrealized storage deployment.
The root causes are structural. Distribution grids were designed for unidirectional power flow from substations to consumers. In areas with high C&I PV penetration, midday reverse power flows are saturating medium-voltage to low-voltage transformers. Adding storage as a bidirectional asset—even though it can relieve this congestion—triggers the DNO’s obligation to perform a full system impact assessment, because the storage’s export capability adds another source of potential reverse flow. The regulatory framework has not caught up with the technical reality that properly dispatched storage reduces the need for grid reinforcement, not increases it.
Regulatory Fragmentation
A uniquely difficult problem for solar-plus-storage hybrid projects (the most common C&I configuration) is that they span multiple regulatory instruments that were not designed to interact:
- The EEG (Erneuerbare-Energien-Gesetz) governs PV remuneration and feed-in priority.
- The Netzanschlussverordnung governs grid connection technical requirements.
- The Messstellenbetriebsgesetz governs metering.
- The Stromsteuergesetz and Energiesteuergesetz govern electricity taxation and self-consumption exemptions.
A hybrid project must satisfy all four, and the interfaces between them are poorly defined. For example, an EEG-subsidized PV system that is later retrofitted with storage may lose its feed-in tariff eligibility if the storage is not separately metered in a specific configuration—a detail that many project developers discover only at the final commissioning stage.
Practical Workarounds (Vetted and Operational)
1. The Sub-200 kW Exemption Strategy
The revised Renewable Energy Directive (RED IV, in force since 2025) and its network code implementation streamline the connection process for generation and storage installations below 200 kW. Specifically, DNOs must process the connection application within 2 months and are prohibited from imposing grid reinforcement charges on the applicant unless the system demonstrably exceeds the local hosting capacity.
How developers use this: A 1 MW / 2 MWh project can be designed and approved as five independent 200 kW / 400 kWh blocks, each with its own inverter, protection relay, and metering point. Each block connects to a separate point on the site’s internal low-voltage busbar. From the DNO’s perspective, five separate sub-200 kW applications are processed, each with a 2-month timeline. From the user’s perspective, the blocks are dispatched as a single aggregated asset by an on-site controller.
Caveat: This strategy must be discussed transparently with the DNO. Some DNOs (notably in Bavaria and Baden-Württemberg) have challenged the “disaggregation” approach, arguing that the combined site capacity is the relevant metric. Early legal opinions from energy law firms (Becker Büttner Held, Görg) indicate that the DNO’s position is legally weak provided each unit is genuinely independently controllable and meets all individual technical connection requirements. Nevertheless, expect variations by region.
2. Poland’s Cable Pooling Model
Poland has pioneered cable pooling (współdzielenie przyłącza), whereby a new storage asset can legally share an existing grid connection point with a wind or solar farm. The storage does not require its own connection application; it operates under a shared connection agreement with clearly defined operating envelopes. The Polish Energy Regulatory Office (URE) has approved over 500 MW of cable-pooled storage since the framework was finalized in 2024. The European Commission is actively studying cable pooling as a best practice for the rest of the EU, with a guidance document expected in Q1 2027.
For commercial and industrial sites that already have a sizable grid connection (e.g., for a factory), adding storage typically does not require a new connection application unless the storage’s export capacity exceeds the existing connection capacity. The principle of “non-firm” connection is increasingly accepted: the storage agrees never to export more than a specified limit, and the DNO accepts the connection without reinforcement studies. This requires an export limitation device (power control relay) that is sealed and tested by the DNO.
3. Early-Stage Hosting Capacity Analysis
The most underutilized tool in project development is a hosting capacity map. Many European DNOs now publish interactive maps showing the available capacity at each medium-voltage substation. Cross-referencing potential project sites with this map before committing to lease agreements can eliminate projects that would face grid connection roadblocks. MateSolar’s project development support team can assist with preliminary hosting capacity screening for client sites in Germany, France, the Netherlands, and Poland.
Topic Five: Investment Returns and Bankability – The CFO’s Demands for Verifiable Numbers
Context. The discourse around C&I storage has historically been dominated by enthusiastic sales projections that promised rapid payback but were light on auditable detail. In 2026, this approach fails. CFOs and corporate treasurers managing energy procurement have access to granular electricity invoice data, well-developed financial modeling capabilities, and a healthy skepticism born of years of overpromised energy efficiency projects. They demand three things:
1. A transparent, country-specific, and tax-regime-aware cash flow model.
2. Independent verification of the core assumptions (price spreads, degradation rates, maintenance costs).
3. A risk mitigation framework that addresses the “what ifs”—what if spreads compress, what if the system fails, what if the regulatory regime changes.
This section provides the model structure and the country-specific benchmarks that inform credible investment cases.
Country-Level Payback Heterogeneity
Not all European markets are equal. The static payback period for an identical 500 kW / 1 MWh system can vary by a factor of 2.5× depending on the country. Table 5 captures the core economics.
Table 5: C&I Storage Payback Benchmarks – 500 kW / 1 MWh, Standard Commercial Tariff, PV-Attached, 2026
| Country | Total Installed Cost (€/kWh) | Annual Savings & Revenue (€) | Simple Payback (Years) | Unlevered IRR (10-yr) | Primary Value Driver | Key Risk Factor |
| Germany | 420–480 | 102,000–118,000 | 3.5–4.5 | 12–15% | High retail spreads, demand charges, dynamic tariff | EEG restructuring uncertainty for PV self-consumption |
| United Kingdom | 450–520 | 95,000–120,000 | 3.8–4.5 | 11–14% | TRIAD avoidance, capacity market, high peak prices | Grid code compliance cost, G99 process |
| Italy | 400–460 | 72,000–88,000 | 5.0–6.0 | 9–12% | High solar self-consumption uplift, peak shaving | Bureaucratic permitting in some regions (Sicily) |
| Spain | 380–440 | 65,000–80,000 | 5.5–6.5 | 8–11% | Solar cannibalization arbitrage, demand charges | Regulatory risk around self-consumption charges |
| France | 410–470 | 78,000–96,000 (TURPE 7 optimized) | 4.5–5.5 | 10–13% | TURPE 7 grid compensation, capacity market | TURPE 7 optimization complexity; November auction qualification |
| Netherlands | 430–490 | 48,000–60,000 | 8.0–10.0 | 5–8% | Peak grid fee avoidance, congestion market | Low energy spread, uncertain net-metering phase-out |
| Poland | 370–430 | 60,000–75,000 | 5.5–6.5 | 9–12% | Capacity market, cable pooling cost savings | Currency risk (PLN), evolving regulations |
Assumptions: 500 kW / 1 MWh system, 330 cycles/yr, 90% round-trip efficiency, 0.5% annual degradation, includes O&M at €8/kWh-yr. Savings include energy arbitrage, peak demand reduction, self-consumption increase. Excludes financing costs. Analysis by MateSolar.
The Energy-as-a-Service (EaaS) Model
For many C&I customers—particularly medium-sized enterprises without dedicated energy management teams or with capital allocation priorities elsewhere—the Energy-as-a-Service model is the deciding factor in adoption. Under EaaS, the customer pays zero upfront capital expenditure. The storage system is owned and operated by a third-party investor (or the technology supplier’s financing arm), and the customer pays a monthly fee based on actual electricity cost savings achieved, typically structured as a share of verified savings (e.g., the customer keeps 25–35% of the savings, the EaaS provider retains the remainder).
An EaaS contract for a German SME with a 500 kW / 1 MWh system might be structured as:
- Baseline electricity cost established from 12 months of pre-installation metered data, normalized for weather and production volume.
- Monthly measurement and verification (M&V) using IPMVP Option C (whole-facility regression model).
- Savings split: 30% to customer, 70% to EaaS provider for the first 7 years; ownership transfers to customer at fair market value at year 7 or the contract renews at a renegotiated split.
- Performance guarantee: if the storage system fails to deliver at least 80% of the modeled savings in any 12-month period, the provider pays a liquidated damages amount equal to the shortfall.
From the customer CFO’s perspective, this is an off-balance-sheet operating expense that is fully self-funding from day one. The credit risk is on the EaaS provider, not the customer, which is why insurance and technical due diligence become paramount.
CBAM Carbon Cost Accounting
A newer consideration, and one that is increasingly material for energy-intensive C&I enterprises, is the interaction between behind-the-meter solar-plus-storage and the EU Carbon Border Adjustment Mechanism (CBAM). CBAM, fully in its transitional phase through end-2025 and entering its definitive phase in 2026, imposes a carbon price on imported goods in covered sectors (steel, aluminium, cement, fertilizers, electricity, hydrogen). Importers must surrender CBAM certificates corresponding to the embedded emissions in their products.
For a manufacturer covered by CBAM, electricity consumption that is demonstrably sourced from on-site renewable generation (solar) and stored in an on-site battery can be excluded from the grid-mix emission factor used to calculate embedded emissions. The value of this exclusion depends on the carbon intensity of the national grid and the EU ETS carbon price. At €110/tCO₂, avoiding the grid emission factor of 350 gCO₂/kWh for 500 MWh of annual self-consumption saves 175 tonnes of CO₂ equivalent, which translates to €19,250 per year in avoided CBAM certificate costs—a direct cash saving that a storage system enables by shifting solar generation into consumption periods.
The measurement and reporting requirements are strict: the installation must have a certified renewable energy source, metering that distinguishes self-consumed renewable electricity from grid electricity, and a verifiable chain of custody. The energy attribute certificates (Guarantees of Origin) must be cancelled for the self-consumed volume. Properly configured, the storage system materially enhances the CBAM value because it allows solar generation to match the facility’s consumption profile, maximizing the volume of grid-independent, low-carbon electricity.
Topic Six: Operations, Maintenance, and Safety Through the Lens of L-Class Fire Risk
Context. The safety conversation around lithium-ion battery storage in Europe has shifted dramatically in 2026. Fire services across Germany (DFV), the UK (NFCC), and France (BSPP) have issued updated operational guidance for battery fires that formalizes the “controlled burn” doctrine. This has profound implications for system design, maintenance protocol, insurance coverage, and business continuity planning.
The Re-Ignition Problem
The defining characteristic of an L-class battery fire is the potential for thermal runaway propagation across cells over an extended time horizon, with re-ignition occurring hours or even days after the initial fire is apparently extinguished. This occurs because:
- Damaged cells that did not reach their thermal runaway threshold temperature during the initial event can absorb heat from adjacent fires and trigger a delayed cascading failure.
- The electrolyte decomposition gases (hydrogen, carbon monoxide, methane) can accumulate in enclosure dead spaces and reignite when oxygen is reintroduced after initial suppression.
- Lithium metal deposits formed during rapid discharge can react violently with moisture, generating heat and hydrogen.
Fire services now advise that after an incident, the storage enclosure be monitored for a minimum of 24–48 hours with thermal imaging, and that no attempt be made to enter or open the enclosure before this observation period expires and gas concentrations have been confirmed below flammable limits.
Business Interruption Insurance
This extended recovery timeline makes business interruption (BI) insurance a critical—and expensive—component of the storage risk management package. Key considerations for the CFO and risk manager:
- BI indemnity period: Must be set to at least 12 months from the date of loss to allow for equipment replacement lead times (6–8 months for custom-configured containerized systems), site remediation, and recertification.
- BI sum insured: Calculated as the gross profit (or revenue less non-continuing expenses) that the business would have earned over the indemnity period attributable to the electricity cost savings and revenue streams generated by the storage system, plus any additional costs incurred to temporarily replace the storage function (e.g., higher grid electricity costs).
- BI waiting period (deductible): Typically 30–60 days. The client should negotiate this down to 7–15 days at the cost of a higher premium, given that the first month without storage can cause an immediate spike in demand charges.
- Interdependency risk: If the storage system is integrated with the building’s fire alarm, HVAC, or process control systems, a fire event that damages those integrations could extend the BI to the main business operation. Clear isolation provisions are essential.
Preventive Diagnostics: Catching Thermal Runaway Precursors
The industry has converged on a set of measurable early indicators that precede thermal runaway by 24–72 hours in lithium iron phosphate (LFP) systems, which dominate the C&I market:
1. Incremental cell voltage divergence: When a cell begins to degrade internally (dendrite growth, electrolyte decomposition), its open-circuit voltage drifts from the pack average by >50 mV under resting conditions.
2. Coulombic efficiency degradation: A cell with an internal short circuit will exhibit anomalous capacity fade and coulombic efficiency below 99.5%, detectable through periodic capacity calibration cycles.
3. Temperature rate-of-rise during charging: A damaged cell will exhibit a faster temperature increase during the constant-current charge phase, detectable via the battery management system’s temperature sensors at a resolution of 0.1°C/minute.
4. Gas sensing: Hydrogen and carbon monoxide sensors inside the enclosure can detect early electrolyte decomposition at concentrations well below flammable limits. The new IEC 63241-2 standard mandates integration of these sensors with the remote alarm system.
Systems with cloud-connected analytics platforms process this data continuously, flagging cells that cross predefined statistical thresholds for on-site inspection or remote lockdown. MateSolar’s product line supports remote diagnostic access with secure VPN-based connectivity, enabling our technical support engineers to analyze BMS data, identify anomalous cells, and provide clear written instructions for local electricians to isolate and bypass affected modules—all without requiring a physical MateSolar presence on site.
Total Cost of Ownership: Liquid Cooling vs. Air Cooling, a 10-Year View
A persistent question from technically informed buyers is whether the premium for liquid cooling justifies itself over the 10-year asset life. Table 6 provides the comparative economics.
Table 6: 10-Year Total Cost of Ownership – Liquid-Cooled vs. Air-Cooled, 500 kW / 1 MWh, Central European Climate
| Cost Element | Liquid-Cooled | Air-Cooled | Delta | Explanation |
| Initial capital cost (€/kWh) | 465 | 420 | +45 | Premium for liquid cooling plates, pump, heat exchanger |
| Average annual energy throughput (MWh) | 370 | 340 | +30 | Liquid cooling enables higher sustained C-rate without derating |
| Annual cell degradation rate | 1.8% | 2.4% | -0.6% | Lower average operating temperature (28°C vs. 38°C) |
| Year-10 usable capacity (kWh) | 835 | 772 | +63 | Degradation difference compounds |
| Annual maintenance (€/yr) | 1,500 | 800 | +700 | Coolant analysis, pump inspection, seal replacement |
| Replacement reserve (€/yr accrued) | 600 | 900 | -300 | Longer cell life reduces replacement contingency |
| Insurance premium differential (€/yr) | -200 | 0 | -200 | Some insurers offer discount for liquid-cooled systems (lower fire risk class) |
| Net 10-year total cost of ownership (€) | 582,000 | 595,000 | -13,000 | Liquid cooling cheaper over full life, despite higher upfront cost |
Note: The TCO advantage of liquid cooling is amplified in hotter climates (Southern Europe) and for higher-cycling applications. For a system in southern Italy or Spain, the liquid-cooled TCO advantage grows to €20,000–€25,000 over 10 years. Air-cooled systems remain competitive in low-cycle-count, temperate-climate applications where initial capital cost is the primary constraint.
Topic Seven: The Sodium-Ion Battery Window – Is 2026 the Year C&I Storage Shifts Away from Lithium?
Context. The commercial arrival of sodium-ion (Na-ion) batteries for stationary storage has been a recurring “next year” narrative for several years. In 2026, however, the conversation has shifted from technology promise to market substance. Multiple Chinese manufacturers (CATL, HiNa Battery, Natron Energy) are now offering containerized and cabinet-based Na-ion products with published specifications, warranty terms, and shipping timelines. European OEMs are integrating Na-ion cells into their BESS platforms.
For C&I buyers, the question is no longer “if” sodium-ion becomes relevant, but “for which applications and at what trade-offs?”
The Compelling Advantages
1. Cycle Life That Redefines Capital Amortization
Sodium-ion cells are achieving demonstrated cycle lives of 10,000–15,000 cycles to 80% state of health, compared to 4,000–6,000 cycles for premium LFP cells operated under equivalent conditions. In a high-cycling C&I application (e.g., 1.5 cycles per day, 550 cycles per year), a Na-ion system can theoretically operate for 18–27 years before reaching the 80% capacity threshold, versus 7–11 years for LFP.
The financial implication is straightforward: if the storage system’s power electronics, thermal management, and enclosure are designed for a 20-year service life, a Na-ion battery reduces the need for a mid-life battery replacement (a major expense that erodes project IRR). For a 500 kWh system, avoiding a single battery replacement at year 8 saves approximately €60,000–€80,000 in present value terms, or €12,000–€16,000 per 500 kWh over 10 years.
2. Intrinsic Safety Profile
Sodium-ion cells can be fully discharged to 0V without irreversible damage, a characteristic that eliminates the risk of stored energy during transportation, installation, and decommissioning. Their thermal runaway onset temperature is significantly higher than LFP (typically 220–250°C vs. 160–180°C for LFP under similar abuse conditions). This translates to a lower fire risk classification and potentially reduced insurance premiums once underwriters develop actuarial data. For applications in occupied buildings, underground installations, or sites with minimal setback distances, the safety differential is material.
3. Low-Temperature Performance Without Energy Penalty
Na-ion cells retain >90% of their rated capacity at -20°C, compared to 60–70% for standard LFP. In Nordic markets, this eliminates the need for enclosure heating systems that consume 3–5% of stored energy in winter months. For a 500 kWh system in Sweden or Finland, the avoided heating energy and reduced insulation complexity simplify system design and improve net energy yield.
4. Supply Chain Independence
The raw material supply chain for sodium-ion batteries—sodium, iron, manganese, and carbon—is globally abundant and geopolitically distributed. There is no equivalent of the lithium concentration in Australia-Chile-China, nor the cobalt concentration in the Democratic Republic of Congo. For European industrial buyers increasingly concerned about supply chain resilience and geopolitical risk, this diversification argument resonates strongly.
The Trade-Offs That Must Be Assessed Honestly
1. Energy Density and Footprint
Sodium-ion cells currently operate at 120–150 Wh/kg at the cell level, compared to 160–180 Wh/kg for mainstream LFP. At the system level (including enclosure, thermal management, power electronics), the volumetric energy density penalty is approximately 25–35%. For the same MWh rating, a Na-ion installation requires more physical space—a non-trivial consideration in dense European industrial zones where real estate costs €50–€150/m² per year.
Trade-off calculation: An extra 10 m² of floor space occupied for 10 years at an imputed rental cost of €75/m²/year adds €7,500 to the effective system cost. If the Na-ion system’s lifecycle savings exceed €15,000 per 500 kWh, the footprint penalty is financially acceptable; if savings are marginal, it becomes decisive against Na-ion.
2. Technology Maturity and Warranty Security
Sodium-ion products have limited field track records in European commercial environments. The first large-scale Na-ion C&I installations were deployed in 2025, and 5-year operational performance data simply does not exist. Warranty terms from Na-ion cell manufacturers are evolving—some are offering 10-year warranties with performance guarantees, but the financial strength of the warrantor and the enforceability of cross-border warranty claims in a relatively new technology class require careful legal diligence.
3. Integration Compatibility
Na-ion cells have different voltage profiles than LFP (nominal voltage typically 2.8–3.1V vs. 3.2V for LFP). This means that the power conversion system (PCS) and battery management system must be specifically designed for Na-ion chemistry. A PCS designed for LFP voltage windows cannot simply be connected to a Na-ion battery stack without hardware and firmware modifications. This limits the ability to swap chemistries in the field and creates a procurement lock-in risk that should be explicitly evaluated.
The Verdict for 2026
For C&I customers in the following profiles, Na-ion merits a serious evaluation:
- High-cycle applications (≥2 cycles/day) where lifecycle cost dominates.
- Nordic and alpine installations where low-temperature performance saves heating costs.
- Safety-sensitive sites (historic buildings, hospitals, food processing) where the lower fire risk has value beyond insurance premiums.
- Enterprises with explicit supply chain diversification mandates.
For standard single-cycle applications in temperate European climates, LFP remains the cost-optimized, proven choice in 2026. MateSolar actively monitors Na-ion technology and is qualifying cell suppliers for integration into our platform architectures, ensuring that when the technology achieves price parity and field-proven status—expected in the 2027–2028 window—a seamless migration path is available to our customers.
4. Product Solutions Mapped to the 2026 Requirements
The preceding sections have established a detailed specification of what a successful C&I storage deployment requires in 2026: insurable compliance, 15-minute dispatch capability, grid code adherence, thermal management appropriate for the operating environment, and a physical form factor suited to the site and application. In this section, we connect these requirements to specific product architectures available from MateSolar, noting the key design features that address the challenges identified above.
For High-Efficiency Commercial PV + Storage Hybrids: Commercial 500KW Hybrid Solar System
The 500 kW hybrid solar system serves as the central power conversion platform for large C&I installations. Engineered for European grid conditions, it supports:
- Direct DC-coupling of PV strings and battery banks on a common DC bus, minimizing AC-DC-AC conversion losses and improving round-trip solar-to-battery efficiency to over 96%.
- Multiple independent MPPT inputs to handle complex commercial rooftop geometries with partial shading.
- Full compliance with VDE-AR-N 4110 (medium voltage) and G99 (low voltage) grid codes, with certification documents available for insurer review.
- 15-minute scheduling interface via Modbus TCP and IEC 61850, compatible with leading energy management system platforms.
- Anti-islanding protection and rate-of-change-of-frequency (RoCoF) ride-through tested in accordance with the latest EU network code requirements.
For Rapidly Deployable, Space-Constrained Sites: 100kW/232kWh 125kW/261kWh Liquid-Cooled Outdoor Cabinet Energy Storage System
This liquid-cooled outdoor cabinet series addresses the core compliance, footprint, and performance demands of the 2026 market:
- Insurability-ready: Shipped with a UL 9540A 6th Edition system-level large-scale fire test report, including the LSFT protocol, accepted by all major European commercial property insurers.
- IEC 63241-2 compliant: MQTT-SN thermal runaway early warning system embedded, with pre-configured integration paths for Siemens and Schneider EMS.
- Liquid cooling as standard: Maintains cell temperature uniformity within 2°C, directly supporting the >6,000 cycle life warranty and reducing fire risk classification.
- 100 kW and 125 kW power nodes: Matches the two dominant European C&I load classes without oversizing or undersizing.
- Modular expansion: Begin with one cabinet; add a second or third as load grows or tariff conditions evolve, without re-permitting or re-engineering.
- Fast installation: Factory-integrated and tested; site work limited to concrete pad, AC connection, and communication cable—typically 1–2 days of onsite commissioning.
For Large-Scale, Cost-Sensitive Applications: 40Ft 1MWh 2MWh Air-Cooled Container ESS Energy Storage System
Where capital cost per kWh is the primary driver and cycle frequency is moderate, the 40-foot air-cooled container provides:
- Proven reliability with millions of operational hours across global deployments.
- Simplified maintenance: no liquid coolant circuits to service; all components accessible from container interior gangway.
- Scalable from 1 MWh to 10 MWh by paralleling containers, with a central controller managing aggregated operation.
- 40-foot ISO footprint compatible with standard transport, rapid deployment, and straightforward relocation if the site lease expires.
For High-Density, High-Cycle Requirements: 20ft 3MWh 5MWh Liquid Cooling Container Energy Storage System
When land cost, cycle count, or throughput requirements push the project toward the high-performance end of the spectrum, the 20-foot liquid-cooled container delivers:
- 3–5 MWh per 20-foot ISO container, halving the land area per MWh relative to air-cooled 40-foot solutions.
- Liquid cooling supporting >8,000-cycle cell life and sustained 1C charge/discharge capability, maximizing energy arbitrage value capture.
- Integrated fire suppression and gas detection meeting UL 9540A 6th Edition and IEC 63241-2 standards.
- Compatible with the 500 kW hybrid inverter for a complete, factory-coordinated power block solution.
5. Frequently Asked Questions (FAQ)
The following FAQ section consolidates the questions most frequently raised during client technical consultations and project evaluations across Europe in 2026.
Q1: My insurer is asking for a “UL 9540A 6th Edition system-level test report.” The supplier gave me a cell-level test report. Is that sufficient?
No. The 6th Edition of UL 9540A mandates a test on the fully assembled system in its final enclosure configuration—the Large-Scale Fire Test (LSFT). Cell-level and module-level tests were acceptable under earlier editions but are now explicitly rejected by European insurers for new installations. You must obtain the system-level report that matches your exact equipment model. Verify the model number and test date. If the supplier cannot produce this document, your system will be uninsurable, which typically means the bank will not disburse the project loan.
Q2: What is the minimum fire suppression system required for a 1 MWh outdoor cabinet in Germany?
German building codes and insurer requirements effectively mandate a multi-layer approach: (1) aerosol-based or inert gas automatic suppression inside the battery enclosure, triggered by smoke/gas/temperature sensors; (2) an external water connection (Storz coupling) for fire brigade use to cool adjacent structures—not for direct injection into the battery; (3) a fire detection and alarm panel connected to the building’s main fire alarm system; and (4) a clearly labeled external emergency shutdown (fireman’s switch). Additionally, VdS (the German insurer testing laboratory) now requires validation of the entire suppression chain for L-class fires. Request VdS recognition or equivalent certification from the equipment supplier.
Q3: Can I legally split my 600 kW storage project into three 200 kW units to get the simplified EU grid connection procedure?
Yes, provided each 200 kW unit is electrically and functionally independent: each must have its own inverter, its own grid protection relay with anti-islanding, and its own metering system. They can be dispatched in coordination, but the DNO must see them as three separate grid connection points. Early legal challenges from some DNOs have not succeeded in courts to date, but we recommend early, transparent discussion with the DNO and, if possible, a legal review of the specific regional regulatory interpretation. The 200 kW threshold is specifically referenced in the EU network code for demand facility connection (NC DCC).
Q4: My business is in France. Do I need to do anything before August 2026 to benefit from TURPE 7?
Yes. Immediately: (1) determine your site’s TURPE 7 congestion zone (A through E) using the CRE/Enedis published maps; (2) commission an energy consultant or use an optimization tool to model your 15-minute load, PV generation, and storage dispatch under the new “injection-soutirage” tariff logic; (3) ensure your storage system controller can accept and execute a 24-hour, 15-minute resolution schedule updated daily—ideally via an API connection to a tariff forecast service. The difference between an optimized and unoptimized dispatch under TURPE 7 can reach 40% of your annual grid costs, so the investment in proper controls pays back within weeks.
Q5: What is the real, verified payback period for a C&I storage system in Germany in 2026?
Based on actual monitored data from over 50 German C&I sites aggregated by a third-party M&V provider, the median simple payback for a 500 kW / 1 MWh PV-attached storage system in the German SME tariff segment is 4.2 years, with a range of 3.5–5.0 years. The key variables driving the range are: (1) the spread between the site’s peak and off-peak electricity prices; (2) the magnitude and shape of the site’s load profile; (3) the quality of the PV-storage dispatch optimization. Sites with professionally tuned, 15-minute-aware dispatch consistently cluster at the lower end of the range (3.5–4.0 years).
Q6: How does the warranty work for a storage system purchased from MateSolar?
MateSolar provides a standard 10-year product warranty and a 10-year performance warranty for our energy storage systems, with specific annual energy throughput and capacity retention guarantees defined in the warranty certificate. In the event of a hardware defect, MateSolar ships replacement parts with detailed installation instructions, enabling a qualified local electrician to perform the replacement. For severe quality issues, a full unit replacement is arranged. Software issues are resolved remotely by MateSolar’s technical support team, who can securely access the system’s controller to diagnose, reconfigure, or update firmware. For large-scale containerized projects, MateSolar can deploy field service engineers to the site for commissioning, integration testing, and training, ensuring the system is fully operational and the customer’s operational team is competent in day-to-day monitoring and emergency procedures.
Q7: I am considering sodium-ion for my new installation. Is MateSolar offering Na-ion products yet?
As of July 2026, MateSolar is actively qualifying Na-ion cells from leading manufacturers and has prototyped integration into our liquid-cooled cabinet and container platforms. However, we have not yet released a commercial Na-ion product line because we believe the technology needs an additional 12–18 months of field validation before we can provide the same level of warranty confidence and bankability documentation that we offer for our LFP products. We expect to announce a Na-ion option in our product portfolio during 2027, initially targeting high-cycle and cold-climate applications. Our LFP systems are designed with a voltage and communication architecture that facilitates a future Na-ion module upgrade path, protecting our customers’ investment in the balance-of-system.
Q8: What is the lead time for a 1 MWh outdoor cabinet system in July 2026?
Standard lead time is 8–10 weeks from confirmed order and receipt of deposit, assuming no unusual customizations. The system ships fully assembled and factory-tested. Ocean freight to major European ports (Rotterdam, Hamburg, Antwerp, Barcelona) adds 4–5 weeks. Overland transport to site and installation commissioning adds 1–2 weeks. Customers should budget a total timeline of 14–17 weeks from order to operational status, inclusive of shipping. Grid connection approval time is additional and runs in parallel with equipment delivery—we strongly recommend submitting the grid application at the same time as the equipment order to avoid idle time on site.
6. Conclusion: A Market at Scale Demands a Partner at Scale
The European commercial and industrial energy storage market in July 2026 is not an emerging opportunity—it is an established, rapidly scaling infrastructure class with defined compliance requirements, sophisticated customer expectations, and rigorous financial scrutiny. The 12.4 GWh of installations projected for this year will double the installed base, and the regulatory machinery is now calibrated for sustained growth to 24 GWh by 2028. The EU Energy Storage Tripartite Agreement has provided the policy certainty that investors demand. The TURPE 7 reform in France, the dynamic tariff mandates in Germany, the 15-minute market settlement, and the new insurance compliance framework collectively create a market environment where quality equipment, properly certified and intelligently dispatched, delivers compelling risk-adjusted returns.
The challenges are equally clear: insurability is the new gatekeeper; grid connection bottlenecks punish delayed project execution; and the CFO’s demand for verifiable returns eliminates margin for vague promises. Success in this market requires a partner that delivers factory-certified, insurer-accepted products; that understands the arcane details of VDE, G99, TURPE, and BS 7671; and that offers the product breadth to match the application—from a 100 kW liquid-cooled outdoor cabinet for a logistics center in Italy, to a 500 kW hybrid solar system for a factory in Germany, to a 5 MWh liquid-cooled container block for a data center campus in the Netherlands.
MateSolar is that partner. As a one-stop photovoltaic and energy storage solution provider, MateSolar combines deep product engineering, European compliance expertise, and a commitment to technical support that respects the reality of our customers’ operations. Our product line—spanning the Commercial 500KW Hybrid Solar System, the 100kW/232kWh 125kW/261kWh Liquid-Cooled Outdoor Cabinet Energy Storage System, the 40Ft 1MWh 2MWh Air-Cooled Container ESS Energy Storage System, and the 20ft 3MWh 5MWh Liquid Cooling Container Energy Storage System—covers the full power and energy spectrum of the C&I market. Each product is designed from the ground up for European grid conditions, certified against the latest insurance and safety standards, and backed by a remote technical support infrastructure that keeps systems operating at peak performance.
Whether you are a CFO evaluating your first storage investment, an EPC contractor seeking a reliable equipment partner for a pipeline of projects, or a facility manager tasked with ensuring business continuity and energy cost control, we invite you to engage with our technical sales team for a detailed, site-specific analysis. The economics are compelling. The compliance path is defined. The technology is mature. The time to deploy is now.
MateSolar – One-Stop Photovoltaic and Energy Storage Solutions Provider.