

















Datum: 10. Juli 2026
Kategorie: Energiespeicherung, Gewerbe & Industrie, Marktintelligenz
Lesezeit: 38 Minuten
Zusammenfassung
Europas Markt für gewerbliche und industrielle (C&I) Energiespeicherung wächst nicht nur, sondern erfährt eine strukturelle Beschleunigung, die neu definieren wird, wie Unternehmen Strom über Jahrzehnte hinweg verbrauchen, verwalten und monetarisieren. Ab Juli 2026 hat das Zusammentreffen von regulatorischen Umwälzungen, Netzinstabilität, Tarifreformen, verschärften Versicherungsmöglichkeiten und technologischen Reifegrad Energiespeicher von einem optionalen Energiemanagementinstrument zu einem nicht verhandelbaren Vermögenswert in der Unternehmensbilanz gemacht.
Neu veröffentlichte Daten bestätigen, dass die jährlichen Speicherinstallationen im C&I-Bereich in ganz Europa im Jahr 2026 12,4 GWh erreichen werden, was einer Verdopplung gegenüber dem Vorjahr entspricht. Das im Juni 2026 von der Europäischen Kommission, den Übertragungsnetzbetreibern und den Branchenverbänden unterzeichnete Dreiparteienabkommen zur Energiespeicherung in der EU legt einen verbindlichen Zielpfad von 9 GWh im Jahr 2026 auf 24 GWh bis 2028 fest – ein Anstieg um 167%, der den C&I-Sektor prozentual zum am schnellsten wachsenden Speichersegment macht.
Hinter diesem explosiven Wachstum verbirgt sich jedoch eine äußerst komplexe Situation. Die Versicherungsgesellschaften haben ihre Zeichnungsstandards nach der Intersolar 2026 drastisch verschärft, wodurch nicht zertifizierte Anlagen für eine Finanzierung ungeeignet geworden sind. In Frankreich tritt im August die Tarifreform TURPE 7 in Kraft, die die Logik der Netzentgelte in 3.000 Tarifzonen neu regelt. Die Umstellung auf 15-Minuten-Abrechnungsintervalle auf den Day-Ahead-Märkten der EU bedeutet, dass mit herkömmlichen stündlichen Regelungsstrategien bis zu 3% der Projekt-IRR ungenutzt bleiben. Die Wartelisten für Netzanschlüsse in Deutschland, den Niederlanden und Belgien betragen bei Projekten über 500 kWh bis zu 8 Monate, während Natrium-Ionen-Batterien eine neue Debatte über die Gesamtbetriebskosten anstoßen, die die bisherigen Annahmen zu Lithium-Ionen-Batterien in Frage stellt.
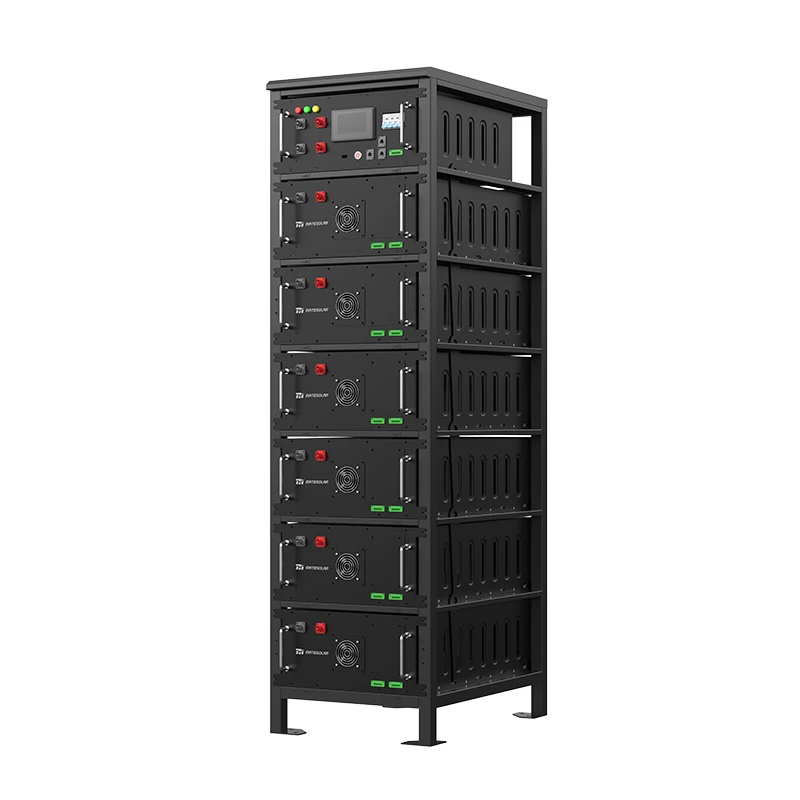
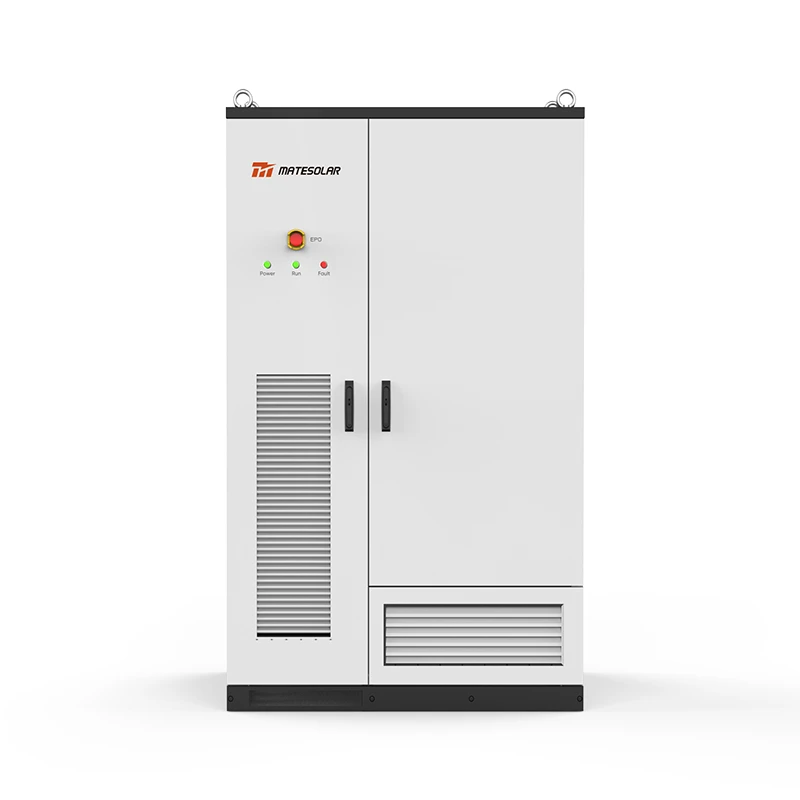
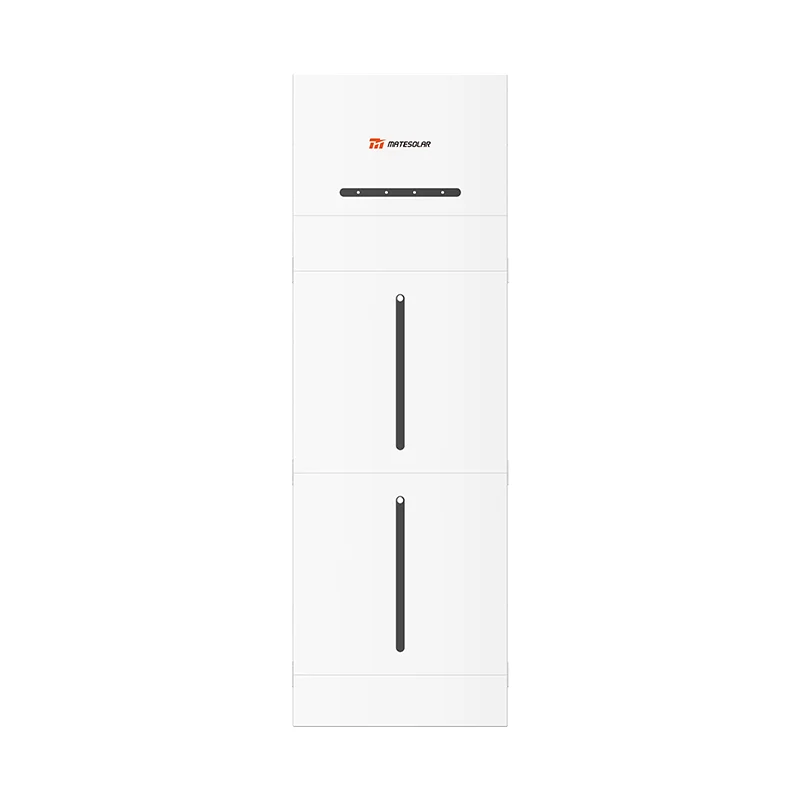
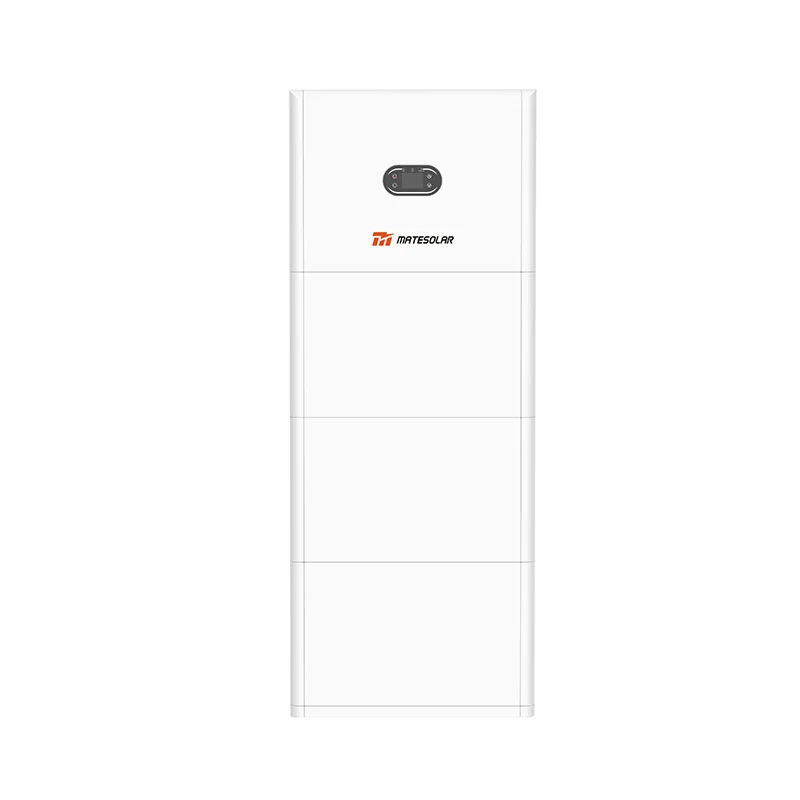
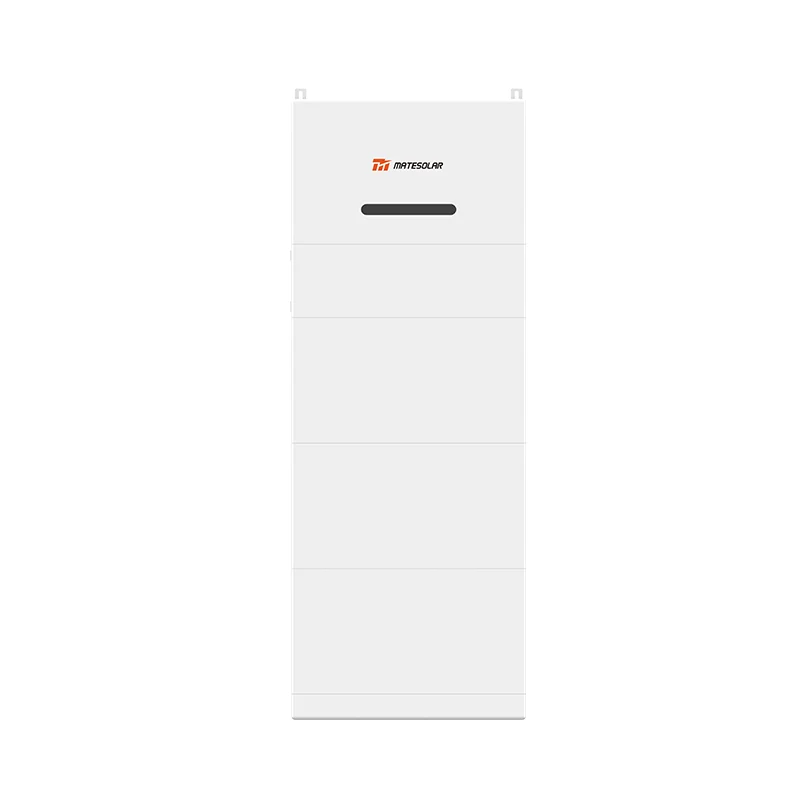
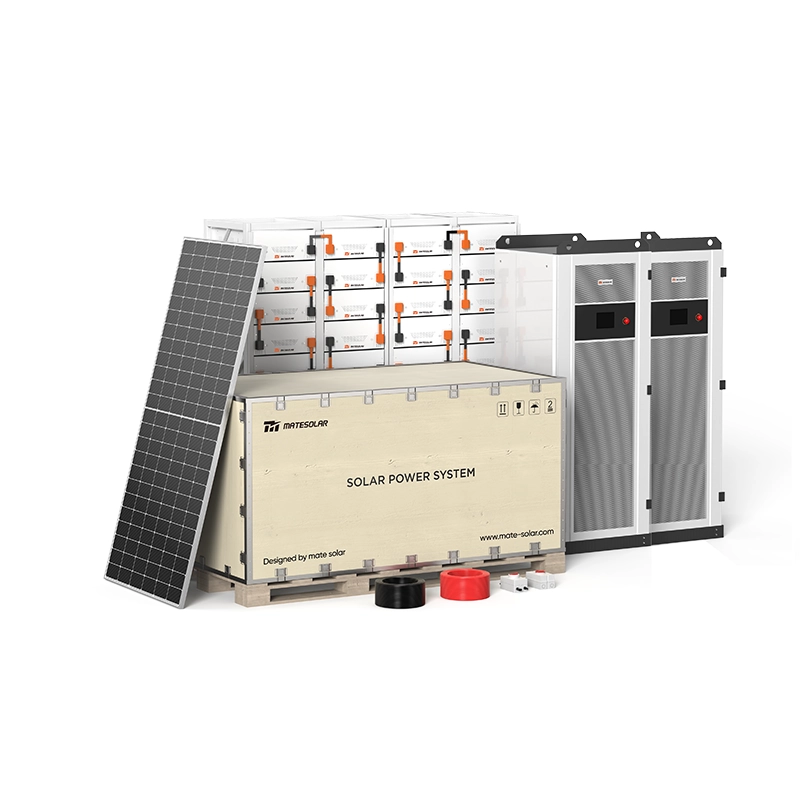
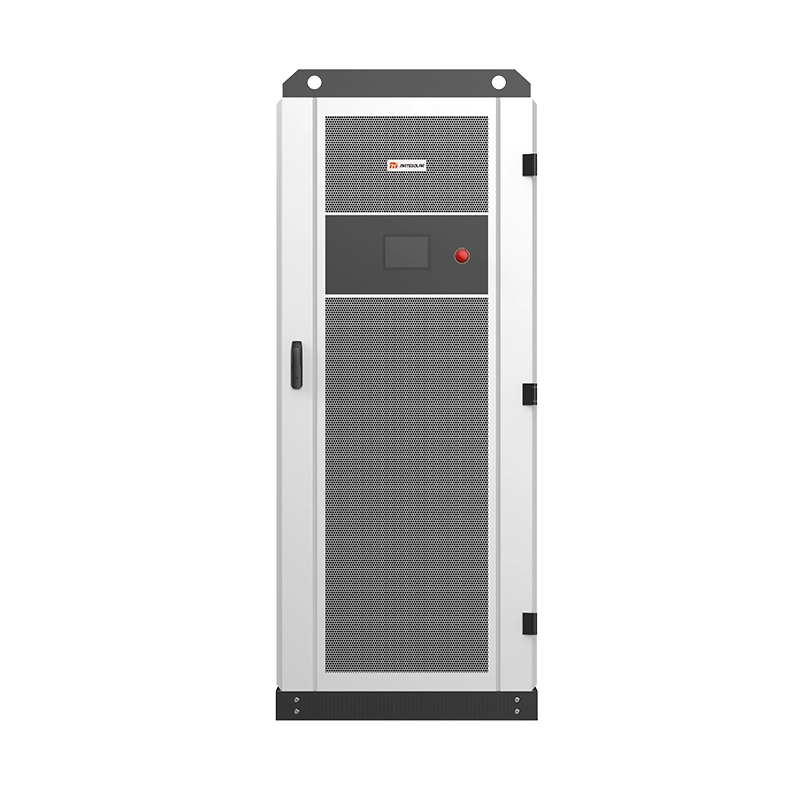
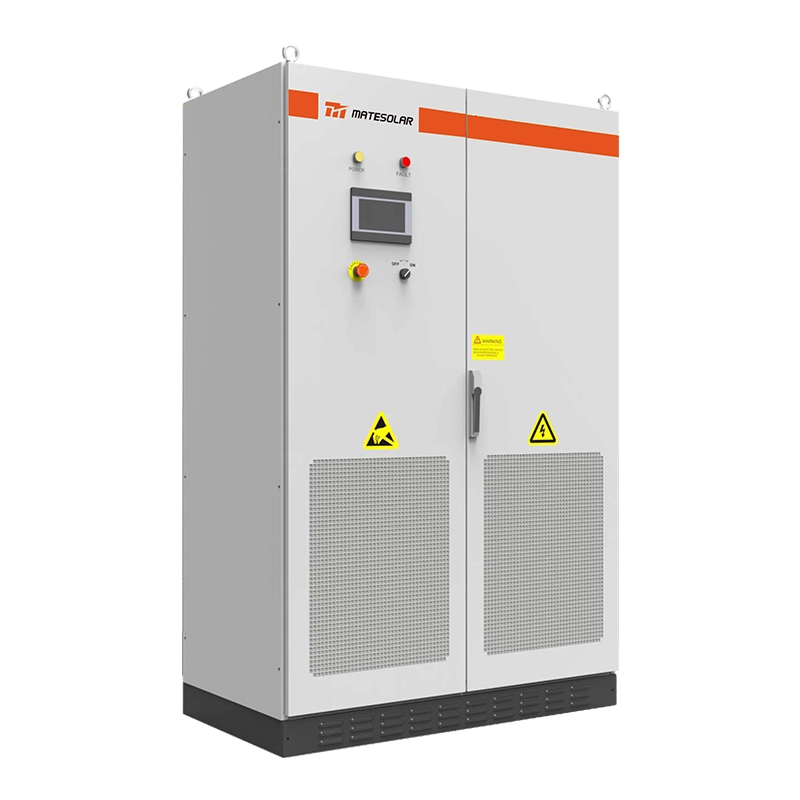
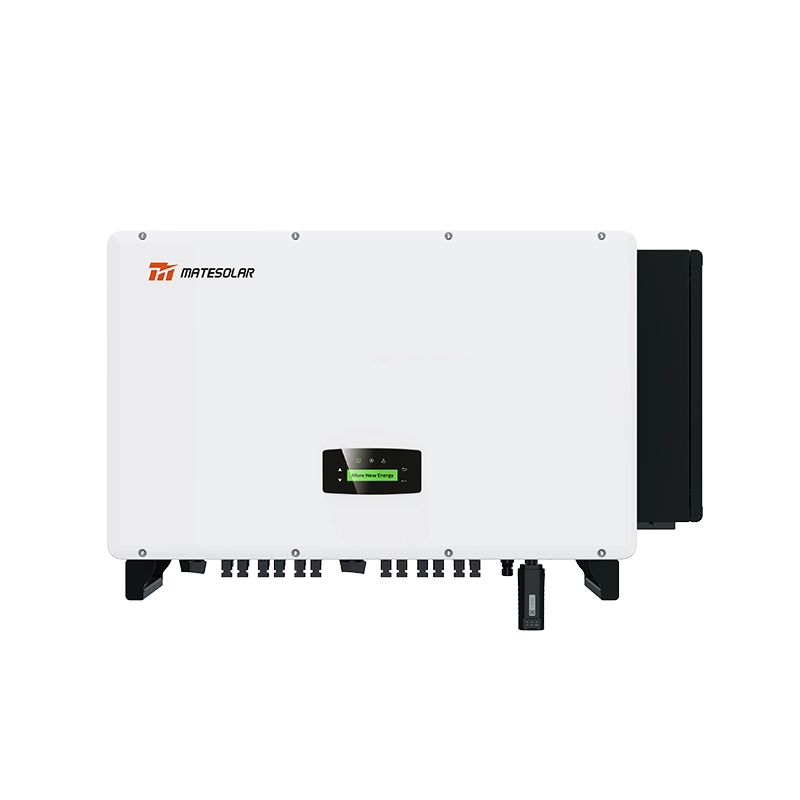
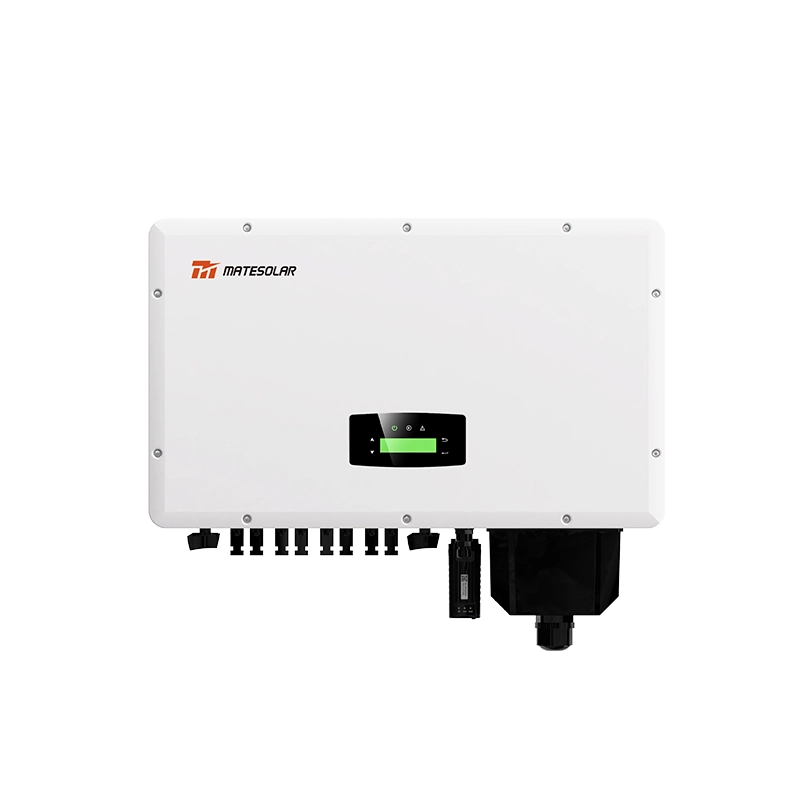
Dieser Leitfaden – recherchiert und verfasst vom Energy Intelligence Team von MateSolar – fasst die Marktdynamik, die Produktdynamik und die sieben dringendsten Kundenfragen zusammen, die derzeit Beschaffungsentscheidungen prägen. Er soll als maßgebliche Referenz für gewerbliche Energiemanager, Projektentwickler, CFOs, Versicherer und EPC-Auftragnehmer dienen, die sich auf dem europäischen Speichermarkt 2026 orientieren. Jeder Abschnitt basiert auf Primärdaten, regulatorischen Texten und praktischer Projekterfahrung. Wo relevant, verbinden wir spezifische technische Herausforderungen mit den Produktarchitekturen, die sie lösen, darunter das MateSolar Commercial 500KW Hybrid Solar System, das MateSolar 100kW/232kWh 125kW/261kWh Liquid-Cooled Outdoor Cabinet Energy Storage System, das MateSolar 40Ft 1MWh 2MWh Air-Cooled Container ESS Energy Storage System und das MateSolar 20ft 3MWh 5MWh Liquid Cooling Container Energy Storage System.
Am Ende des Abschnitts werden Finanzvorstände über ein verifizierbares IRR-Framework verfügen, Projektingenieure die neuen Brandschutzprüfverfahren für Versicherungszwecke verstehen und Einkaufsmanager die flüssigkeitsgekühlten Außenraumschränke mit quantitativer Präzision mit containerisierten Architekturen vergleichen können. Wir beginnen mit den grundlegenden Kräften, die den Markt umgestalten.
1. Marktfundamentale: Warum 2026 das Weichenstellungsjahr für europäische C&I-Speicher ist
1.1 Die Zahlen, die die Chance definieren
Der europäische C&I-Speichermarkt lag sowohl beim Volumen als auch bei der politischen Aufmerksamkeit historisch hinter den Segmenten für Versorgungsunternehmen und für Privathaushalte zurück. Diese Ära ist vorbei. Tabelle 1 fasst die wichtigsten Marktkennzahlen zusammen, die jeder Stakeholder verinnerlichen muss.
Tabelle 1: Grundlagen des europäischen C&I-Energiespeichermarktes, 2024–2028
| Metrisch | 2024 (Tatsächlich) | 2025 (Schätzung) | 2026 (Prognose) | 2028 (Ziel) | Quelle / Notizen |
| Jährliche C&I-Speicherinstallationen (GWh) | 4.2 | 6.1 | 12.4 | 24.0 | EU-Dreierabkommensentwicklung, EASE, SolarPower Europe |
| Wachstumsrate im Jahresvergleich | / | 45% | 103% | ~39% CAGR | Abgeleitet von oben |
| Kumulativ installierter C&I-Speicher (GWh) | 9.8 | 15.9 | 28.3 | ~62 | Kumulativer Aufbau |
| C&I Solar-Anschlussrate (Speicher pro PV-Kapazität) | ~8% | ~10% | ~14% | ~22% | SolarPower Europe C&I PV-Tracker |
| Kumulative Nachrüstchance (GWh von PV-Anlagen ohne Speicher) | 38 | 42 | 46 | / | Basierend auf 90% von C&I; PV-Standorte noch nicht zugeordnet |
| Durchschnittlicher kommerzieller Strompreis (€/MWh, EU-gewichtet) | 152 | 168 | 175 | / | Eurostat, Platts; spiegelt Großhandels- + Netz- + Steuern wider |
| German KMU-Strompreisaufschlag vs. Großindustrie | +52% | +56% | +58.6% | / | BDEW, Destatis; KMU definiert als < 2 GWh Jahresverbrauch |
| Anzahl der Gewerbe- und Industriekunden (C&I) mit >100 kW Spitzenlast in der EU-27 | 2,1 Millionen | 2,2 Millionen | 2,3 Millionen | / | EU-Gebäudebestand-Analyse |
| Netzanschlussverzögerung für Projekte >500 kWh (Monate, DE/NL/BE) | 2–3 | 3–5 | 4–8 | / | Primärinterviews mit DNOs, Entwicklern |
Quellen: Europäische Kommission JRC, EASE 2026 Market Monitor, SolarPower Europe C&I Working Group, nationale Regulierungsdossiers. Analyse von MateSolar.
Die Zahl von 12,4 GWh für 2026 ist keine lineare Extrapolation früherer Trends. Sie spiegelt das erste volle Betriebsjahr mehrerer struktureller Treiber wider, die 2024–2025 noch in den Anfängen steckten oder nicht vorhanden waren. Wir werden uns nun diesen Treibern zuwenden.
1.2 Struktureller Treiber Eins: Extrem niedrige Speicherauslastungsraten
In der gesamten EU-27 sind derzeit rund 90% gewerbliche und industrielle Photovoltaikanlagen ohne eigenen Speicher hinter dem Zähler in Betrieb. Die kumulierte installierte PV-Leistung auf gewerblichen und industriellen Dächern übersteigt Mitte 2026 65 GWp. Würden diese Anlagen mit einem typischen Gleichstromverhältnis von 1:1 (1 kWh Speicherkapazität pro 1 kWp PV-Leistung) nachgerüstet, würde allein der potenzielle Nachrüstmarkt 65 GWh übersteigen – mehr als das Fünffache der bisher insgesamt installierten Speicherleistung im Gewerbe- und Industriebereich.
Was sich im Jahr 2026 geändert hat, ist, dass zwei bisherige Hindernisse für Nachrüstungen wegfallen: (a) der modulare Outdoor-Schrankformfaktor hat die physische Integration vereinfacht, und (b) die Versicherungsbranche hat, kontraintuitiv, eine Compliance-Erzwingungsfunktion geschaffen, die ordnungsgemäß zertifizierte Neuinstallationen gegenüber nicht zertifizierten Legacy-Ansätzen begünstigt. Wir werden beide Faktoren später im Detail behandeln.
1.3 Struktureller Treiber Zwei: Anhaltend hohe Strompreise und die Belastung für KMU
Die Strompreise für gewerbliche Abnehmer in Europa sind seit 2021 je nach Mitgliedstaat um 40–60% gestiegen. Selbst nachdem die akute Energiekrise von 2022–2023 abgeklungen war, haben strukturelle Faktoren – der Atomausstieg in Deutschland, die Leistungsschwäche des französischen Kernkraftwerkparks, der Anstieg des CO₂-Preises auf über 110 €/tCO₂ sowie die angespannte Lage auf dem LNG-Markt – dafür gesorgt, dass die gewerblichen Tarife 50% über dem Vorkrisenniveau liegen.
Kleine und mittlere Unternehmen tragen eine unverhältnismäßig hohe Last. In Deutschland zahlen Unternehmen mit einem Jahresverbrauch von weniger als 2 GWh einen durchschnittlichen Gesamtpreis von 0,31 €/kWh, verglichen mit 0,195 €/kWh für große Industriekunden – ein Aufschlag von 58,61 TP3T (Stand: 2. Quartal 2026). Diese Kluft vergrößert sich, da Netztarife, EEG-Umlagen und Ausgleichskosten unverhältnismäßig stark auf kleinere Verbraucher umgelegt werden. Für ein typisches deutsches Mittelstandsunternehmen im produzierenden Gewerbe mit einem Jahresverbrauch von 500 MWh beläuft sich die jährliche Stromrechnung mittlerweile auf über 155.000 €. Eine Senkung dieser Rechnung um 50–70% durch PV-Eigenverbrauch und Spitzenlastabdeckung bedeutet direkt eine jährliche Einsparung von 75.000–108.000 Euro– ein starkes Argument für die Unternehmensleitung, das die statische Amortisationszeit von 3,5–4,5 Jahren in Deutschland sofort überzeugend macht.
1.4 Strukturtreiber drei: Netzfragilität als Weckruf
Am 24. Juli 2025 führte eine kaskadierende Frequenzstörung im spanischen Übertragungsnetz zu einem Stromausfall bei über 50 Millionen Menschen auf der Iberischen Halbinsel und in Teilen Südfrankreichs. Das Ereignis, verursacht durch eine Kombination aus geringer Systemträgheit während einer Periode hoher erneuerbarer Energienutzung und einer Fehlabstimmung von Schutzrelais, war der schwerwiegendste Stromausfall in Europa seit 2003. Der wirtschaftliche Schaden überstieg 6 Milliarden Euro und die Analyse nach dem Ereignis ergab, dass dezentrale Speicheranlagen kritische Frequenzhaltungsreserven hätten bereitstellen können, die den Kaskadeneffekt möglicherweise aufgehalten hätten.
Der Stromausfall in Spanien im Jahr 2025 verdeutlichte einen Wandel, der sich bereits seit Jahren abzeichnete: In einem Netz mit einem Anteil erneuerbarer Energien von 55%+ kann man sich nicht mehr auf die synchrone Trägheit von Wärmekraftwerken verlassen. Speicher sind die einzige technisch realisierbare Quelle für eine schnelle Frequenzregelung in großem Maßstab. Für C&I-Kunden bedeutet dies, dass Netzausfälle nicht mehr nur theoretische Tail-Risiken sind, sondern eine statistisch wiederkehrende betriebliche Bedrohung darstellen. Die Versicherungsbranche hat darauf reagiert, indem sie die Prämien für Betriebsunterbrechungsversicherungen für Unternehmen ohne Notstromversorgung angepasst und gleichzeitig die Deckungsbedingungen für Speicheranlagen selbst verschärft hat – eine doppelte Dynamik, die wir in Thema Eins untersuchen.
Folglich wurde Storage im Vorstand von einer “Option zur Optimierung von Energiekosten” zu einer “Anforderung zur Geschäftskontinuität” umkategorisiert. Dieser mentale Wandel ist die wichtigste qualitative Veränderung auf dem Markt 2026.
1.5 Struktureller Treiber Vier: Die Politikarchitektur ist nun permanent und marktbasierend
Das frühere Wachstum im Bereich der Speichersysteme in Europa stützte sich stark auf direkte Kapitalzuschüsse – den italienischen „Superbonus 110%“, verschiedene regionale Programme in Deutschland und die frühen griechischen Ausschreibungen für Speichersysteme. Diese Programme haben zwar den anfänglichen Ausbau vorangetrieben, führten jedoch zu Boom-Bust-Zyklen und schufen keine sich selbst tragende Wirtschaftlichkeit.
Die politische Landschaft von 2026 ist grundlegend anders. Die EU-Dreiervereinbarung zur Energiespeicherung, unterzeichnet am 3. Juni 2026 zwischen der GD ENER, dem ENTSO-E, dem Europäischen Bankenverband und der Speicherindustrie, verpflichtet die Mitgliedstaaten zur Umsetzung eines Korbes marktbasierter Einnahmemechanismen bis Q1 2027:
- Dynamische Stromtarife diese Belohnungsspeicherung zur Linderung von Staus (leben in Frankreich ab August 2026, Pilotprojekte in den Niederlanden und Belgien).
- Kapazitätsvergütungsmechanismen zugänglich für aggregierte Speicher hinter dem Stromzähler, mit 15-jährigen Verträgen in Frankreich ab November 2026 und ähnlichen Programmen, die in Italien und Polen vorangetrieben werden.
- Befreiung oder erhebliche Reduzierung der Doppelbelastung (Zahlung von Netzentgelten sowohl bei der Ein- als auch bei der Ausfuhr) für die Speicherung, harmonisiert in der EU bis 2027.
- Optimierter Netzanschluss für Anlagen unter 200 kW, mit einer verbindlichen Pflicht für Netzbetreiber, Anträge innerhalb von 2 Monaten zu bearbeiten.
Entscheidend ist, dass diese Mechanismen die interne Rendite (IRR) der Projekte im Vergleich zu reinen Energie-Arbitrage-Modellen um 2–3 Prozentpunkte verbessern, wodurch viele Projekte von der Kategorie „gerade noch investierbar“ (5–7% unlevered IRR) in die Kategorie „problemlos finanzierbar“ (8–10% unlevered) übergehen. Der Wandel von der Abhängigkeit von Subventionen hin zu einer marktbasierten Ertragsoptimierung rechtfertigt den Wachstumskurs von 167% bis 2028.
2. Drei Produktsegmente verändern den Markt
Der Begriff “C&I-Speicher” umfasst eine heterogene Reihe von Produktarchitekturen, Leistungsklassen und Anwendungsfällen. Es haben sich drei unterschiedliche Segmente herausgebildet, die jeweils ihre eigene Technologieentwicklung, Wettbewerbsdynamik und Kundenanforderungen aufweisen.
2.1 Segment Eins: Gewerbliche BESS (100 kWh bis 2 MWh)
Dies ist das Segment mit dem höchsten Wachstum und der höchsten Nachfrage nach Stückzahlen. Es richtet sich an Fabriken, Logistikzentren, Einzelhandelsparks, Rechenzentren, landwirtschaftliche Betriebe, Hotels und kommunale Gebäude. Die verbindenden Merkmale sind der Betrieb hinter dem Stromzähler, die Optimierung des Eigenverbrauchs von PV-Anlagen, das Management von Spitzenlastkosten und die Arbitrage von Strompreisen nach Zeitverwendung.
Leistungsklassenfragmentierung
Der Markt hat sich um zwei dominierende Machtknoten konsolidiert:
- 100–125 kWDies ist der ideale Punkt für mittelgroße Gewerbe- und Leichtindustrieanlagen. Es passt zu Hochspannungsbatteriepaketen von 1000 V und 1500 V, lässt sich nahtlos mit Netzanschlüssen von 125 A bis 160 A verbinden und passt in Standard-Elektroraum- oder Außenbereiche. Geräte dieser Klasse bieten typischerweise 200 kWh bis 400 kWh Speicher pro Powerblock, skalierbar auf ca. 1 MWh mit parallelen Schränken.
- 50–60 kWDiese Klasse richtet sich an kleinere Unternehmen, Bauernhöfe und verteilte Standorte, bei denen das Lastprofil nicht den größeren Formfaktor rechtfertigt. Sie wird oft in Niederspannungs-Schaltanlagen für 400 V integriert und erfordert vereinfachte Installationsverfahren. In Italien und Spanien dominieren Systeme mit 50–60 kW aufgrund der Verbreitung kleiner Fertigungseinheiten.
Die 1 MWh Einzelschrank-Schwelle
Ein klarer Produkttrend im Jahr 2026 ist das Aufkommen von 1 MWh Energiespeichersystemen in einem einzigen Schrank. Bislang war für 1 MWh die Parallelschaltung mehrerer Schränke erforderlich, was die Anzahl der Verbindungspunkte, Kommunikationsknoten und potenziellen Fehlerquellen vervielfachte. Neue integrierte Schränke von 700 kWh bis 1,2 MWh fassen nun den gesamten DC-Batteriestapel, das Batteriemanagementsystem, die Wärmemanagement- und Brandschutzfunktionen in einem einzigen Außengehäuse zusammen. Die Vorteile sind nicht unerheblich:
- Reduzierung des Platzbedarfs um 35–50% im Vergleich zu Architekturen mit mehreren Schränken.
- Reduzierte Systemkosten (BOS): weniger DC-Kombinationskästen, weniger Kommunikationsgateways, weniger Gräben.
- Vereinfachte Genehmigung und Brandschutzinspektion: Eine einzelne Einheit mit einem einzigen UL 9540A-Testbericht (der die systemseitige Konfiguration abdeckt) ist wesentlich einfacher zu prüfen als eine Verbundinstallation.
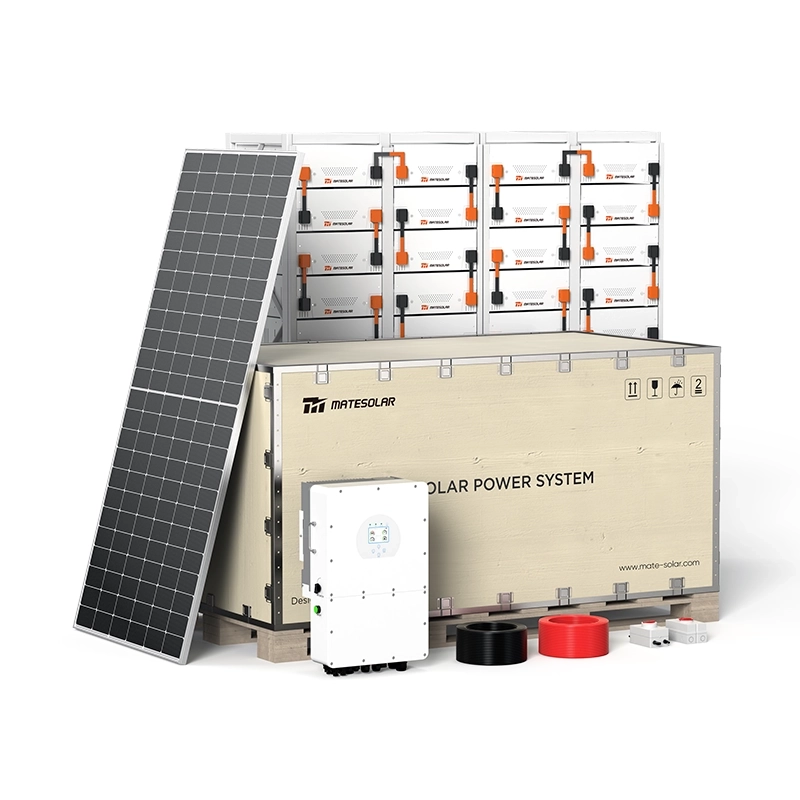
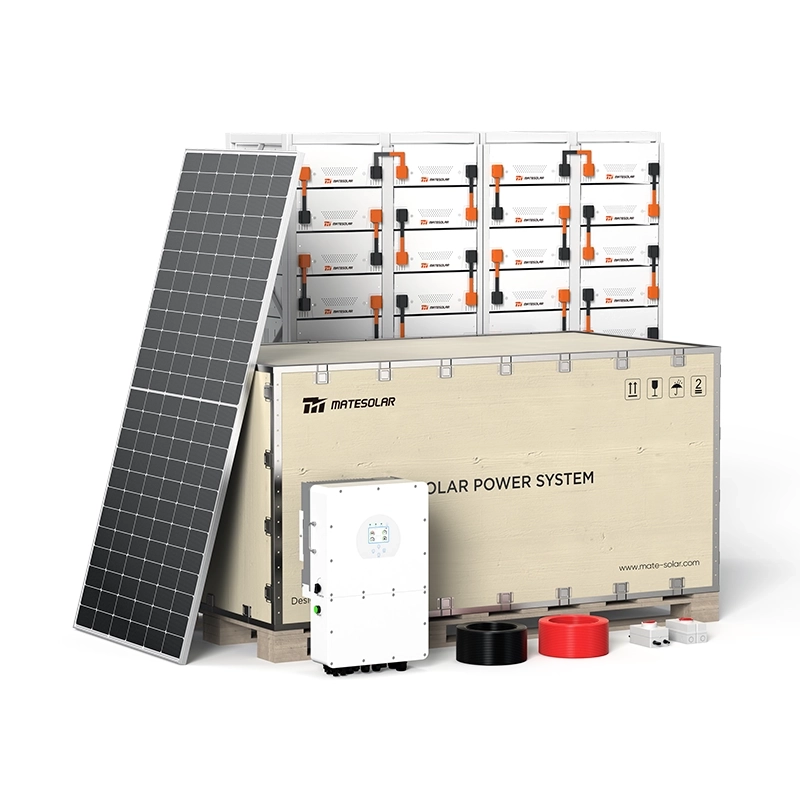
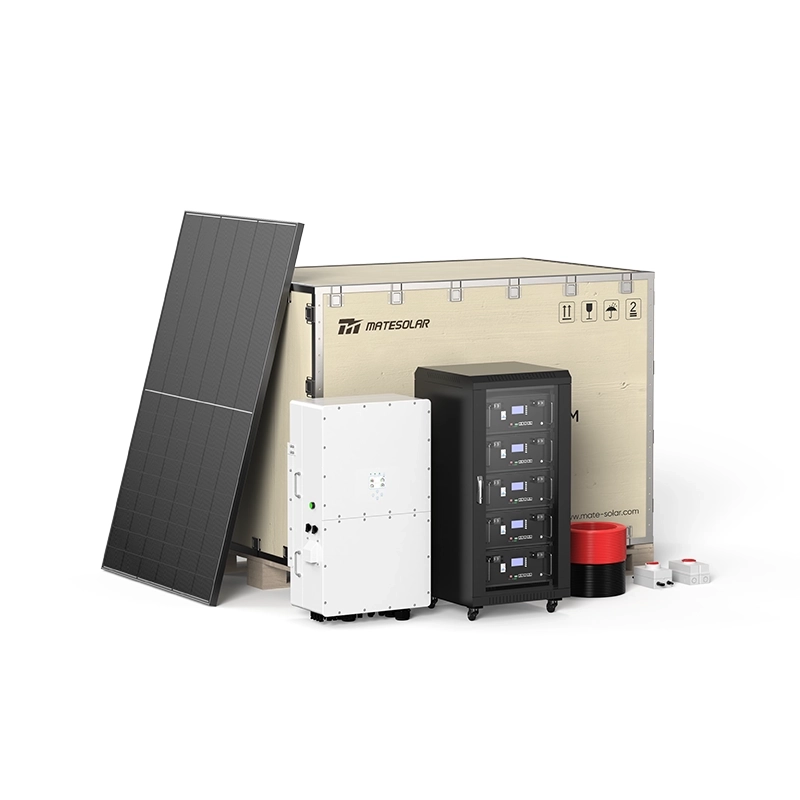
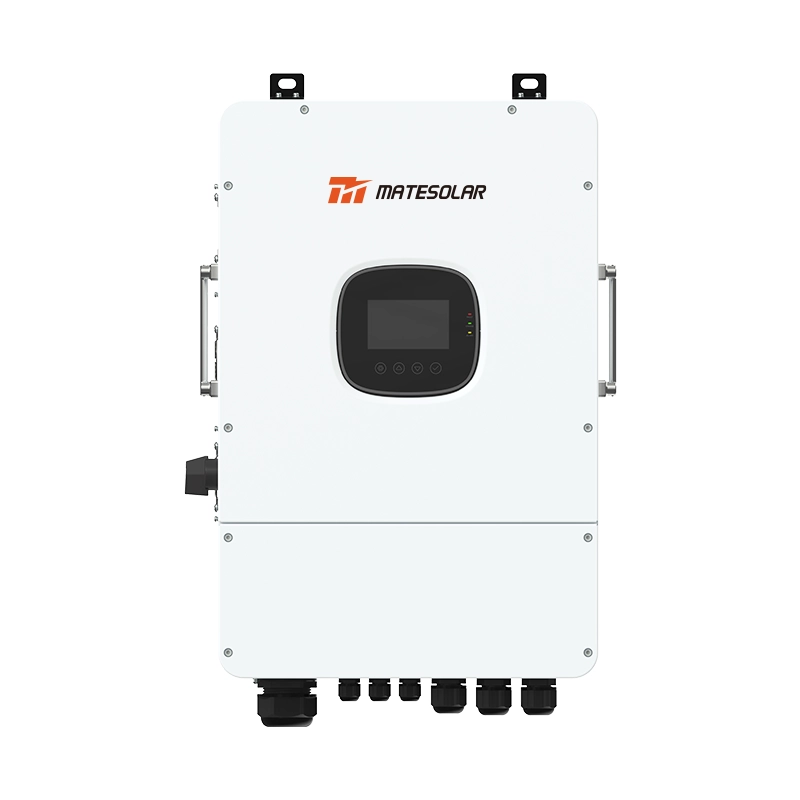
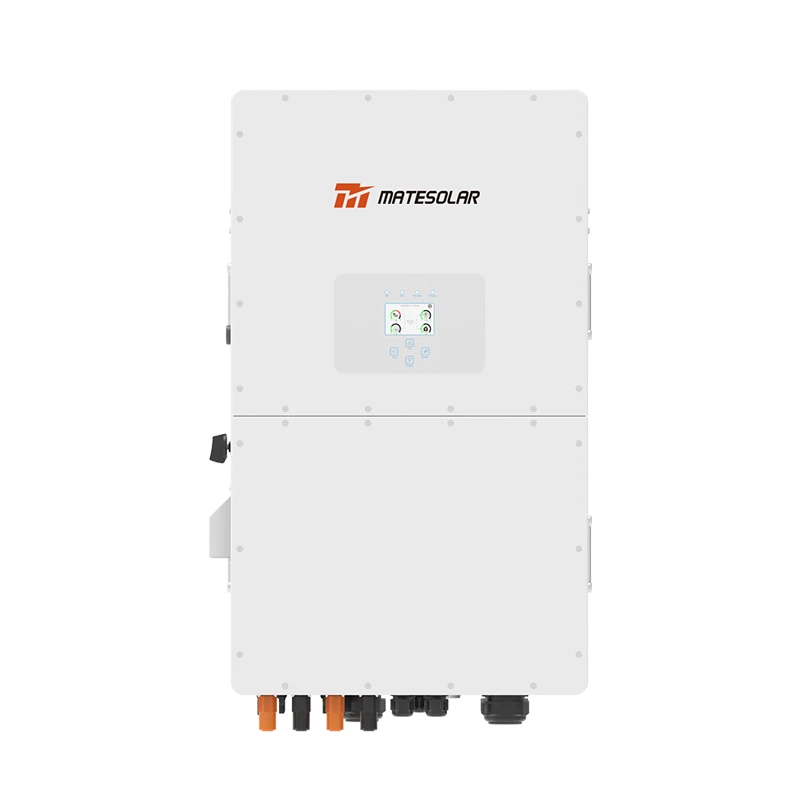
Für Standorte mit PV-Integration wird die Wechselrichterkapazität oft separat bezogen. Eine leistungsfähige Kombination, die bei mehreren 2026er Installationen beobachtet wurde, ist die Kopplung eines 1 MWh Außenschranks mit einem 500 kW Hybridwechselrichter – eine Konfiguration, die den Eigenverbrauch maximiert und gleichzeitig die Netzexportfähigkeit beibehält. Ein Beispiel für eine solche Plattform ist das MateSolar Commercial 500KW Hybrid Solar System, das für hocheffiziente C&I-Anwendungen entwickelt wurde, die eine nahtlose PV-Speicherintegration erfordern.
Wirtschaftliches Modell für den Endverbraucher
Die vorherrschende Logik zur Wertsteigerung im Jahr 2026 kombiniert vier Einnahmen- und Sparströme:
1. PV-EigenverbrauchsteigerungVerschiebung der Solarstromerzeugung von der Mittagsabgabe (oft zu niedrigen oder negativen Großhandelspreisen) zum Abendverbrauch. Allein in Deutschland kann dies den Wert der Solarstromerzeugung um 0,08–0,12 €/kWh verbessern.
2. Lastspitzenabdeckung / Spitzenlastmanagement: Die Gewerbetarife in den meisten EU-Ländern beinhalten eine Kapazitätsgebühr (€/kW pro Monat oder pro Jahr), die sich nach dem höchsten 15-Minuten-Durchschnittsbedarf richtet. Ein Speichersystem, das den Spitzenbedarf begrenzt, kann diese Gebühr um 30–60% senken. Dies wirkt sich besonders stark in Spanien, Italien und Frankreich aus, wo Leistungsgebühren 25–40% der Gesamtrechnung ausmachen können.
3. Zeitabhängige EnergiearbitrageAufladen während Niedrigpreisperioden (nachts, mittags bei Solarenergieüberschuss) und Entladen während Hochpreisperioden (morgens und abends bei Spitzenlast). Da die Marktabrechnung nun standardmäßig in 15-Minuten-Intervallen erfolgt, sind Intra-Stunden-Preisspannen vollständig ausnutzbar.
4. Teilnahme an Zusatzdiensten (wo die Regulierung es zulässt): Aggregierte dezentrale Anlagen (Behind-the-Meter) dürfen zunehmend an Märkten für Frequenzhaltung (FCR) und automatische Frequenzwiederherstellung (aFRR) teilnehmen und generieren damit zusätzliche Einnahmen von 20–50 €/kW-Jahr, abhängig vom Land.
Das Nettoergebnis in Kernmärkten:
- Deutschland und Großbritannien: statische Amortisationsdauer von 3,5–4,5 Jahren, unlevered IRR in der Regel 12–15%.
- Italien und Spanien: 5–6 Jahre, IRR 9–12%.
- Niederlande: 8–10 Jahre ohne Subventionen, was niedrige Spark Spreads und begrenzte Nachfragetarrife widerspiegelt. Dieser Markt ist weiterhin auf die Vermeidung von Spitzennetzentgelten angewiesen und reagiert empfindlich auf Pläne zum Auslaufen der Einspeisevergütung.
2.2 Segment Zwei: All-in-One Outdoor-Schrank (Flüssigkeitsgekühlt, Integriert)
Der integrierte Outdoor-Schrank ist zur dominanten physischen Form für C&I-Speicher in Europa geworden und stellt die Produktkategorie dar, in der chinesische Hersteller – MateSolar unter ihnen – die stärkste Wettbewerbsposition innehaben. Das Wertversprechen ist einfach: eine einzige SKU, die DC-Batterien, PCS (Umwandlungssystem), BMS, HVAC/Kühlung und Brandunterdrückung enthält und lediglich einen AC-Netzanschluss und eine Kommunikationsschnittstelle für den Betrieb benötigt.
Produktentwicklung im Jahr 2026
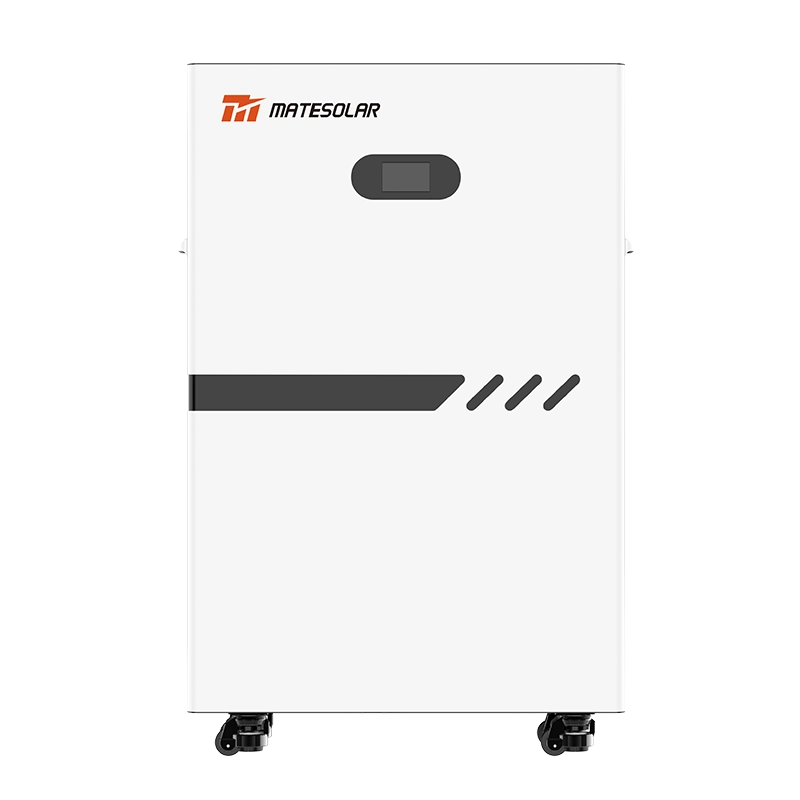
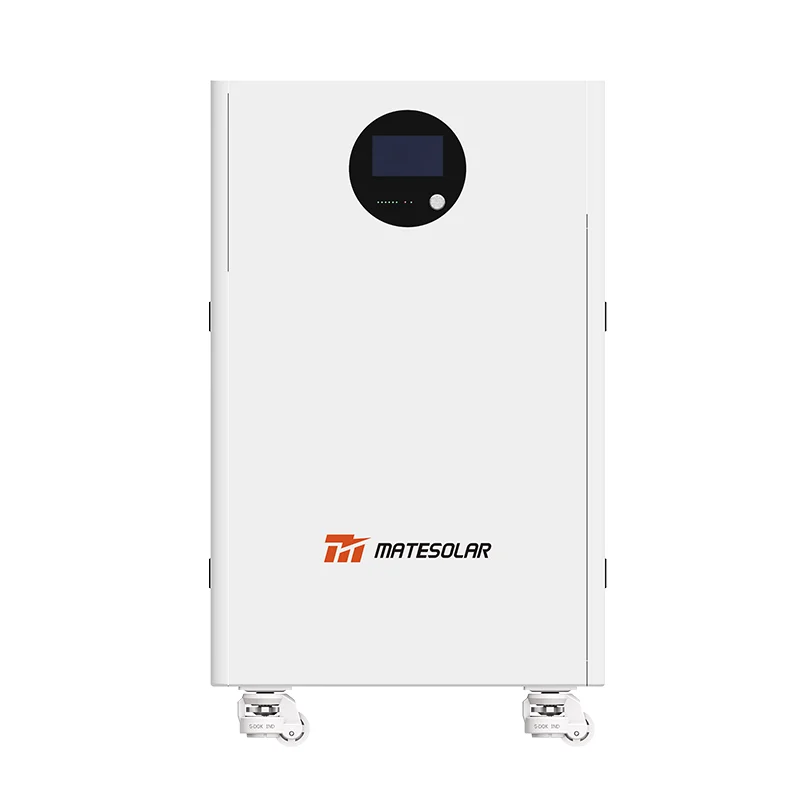
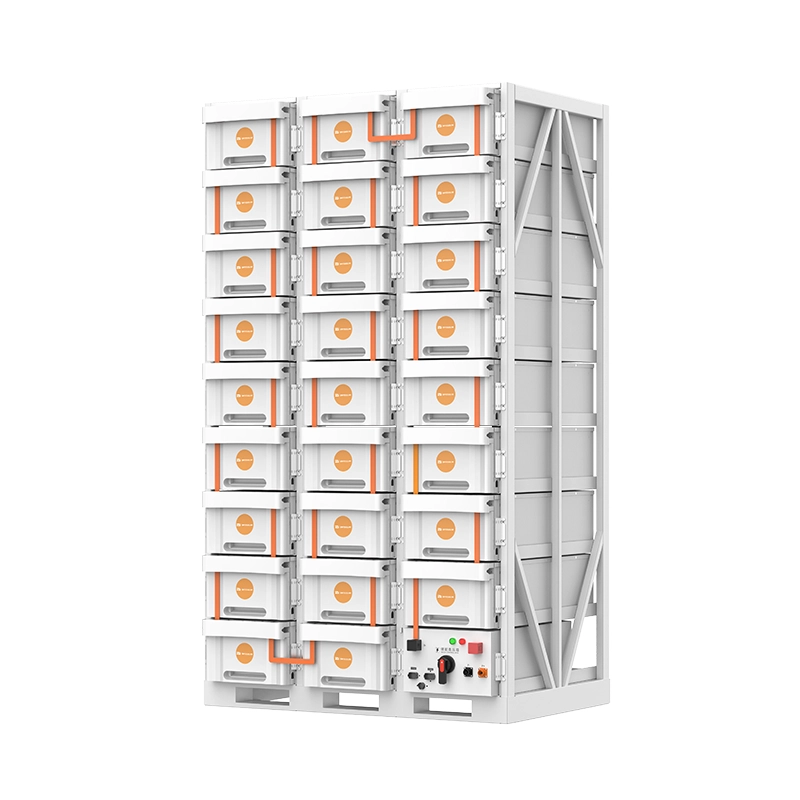
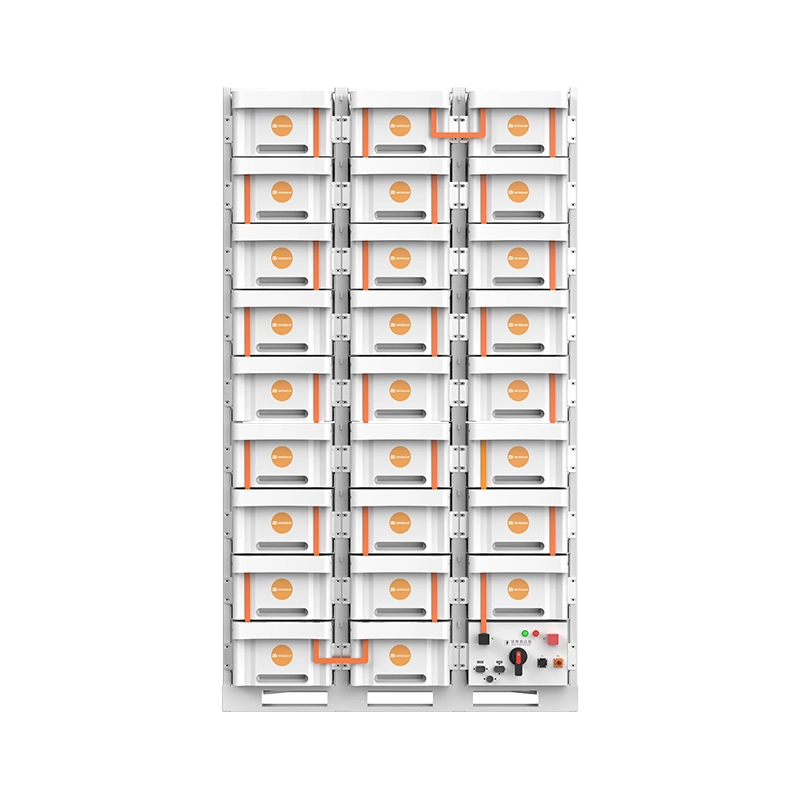
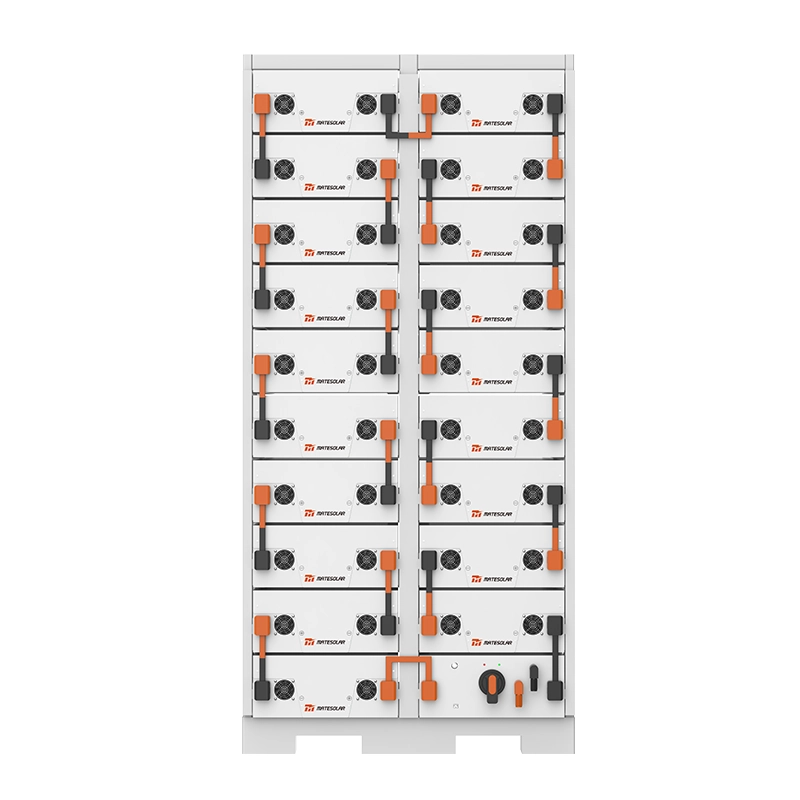
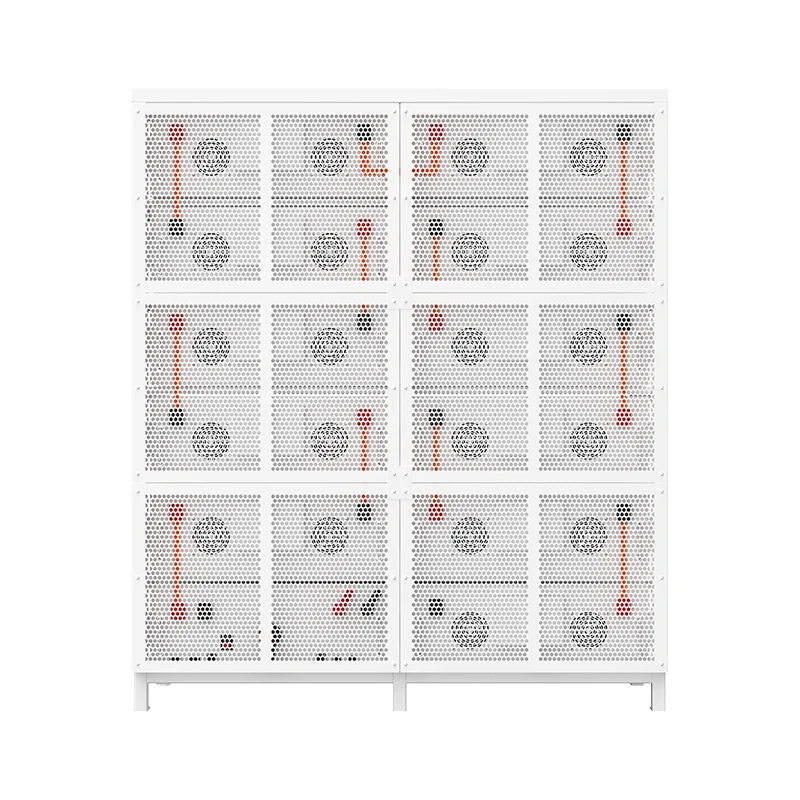
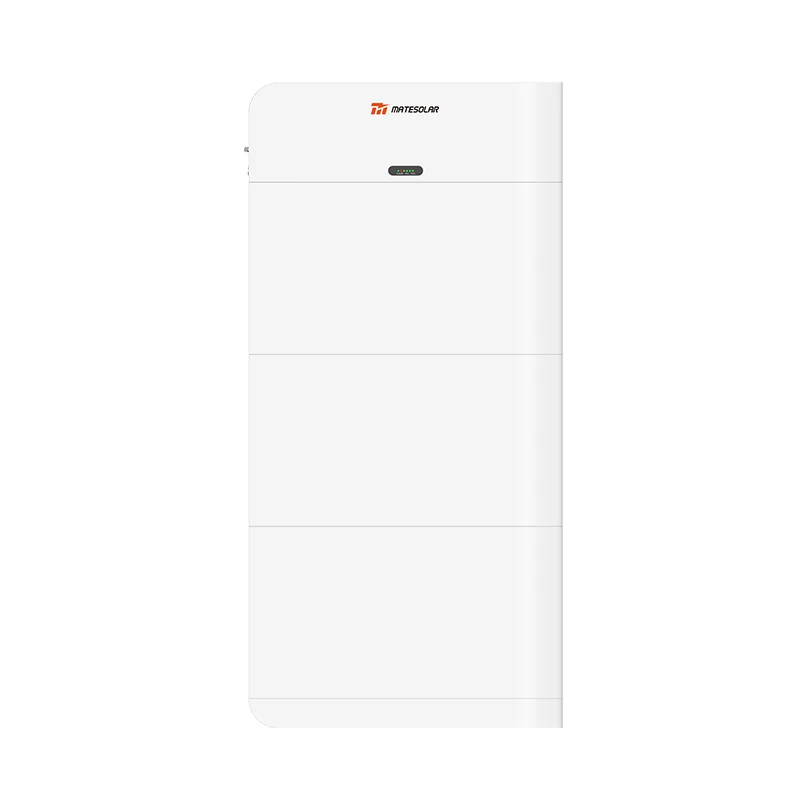
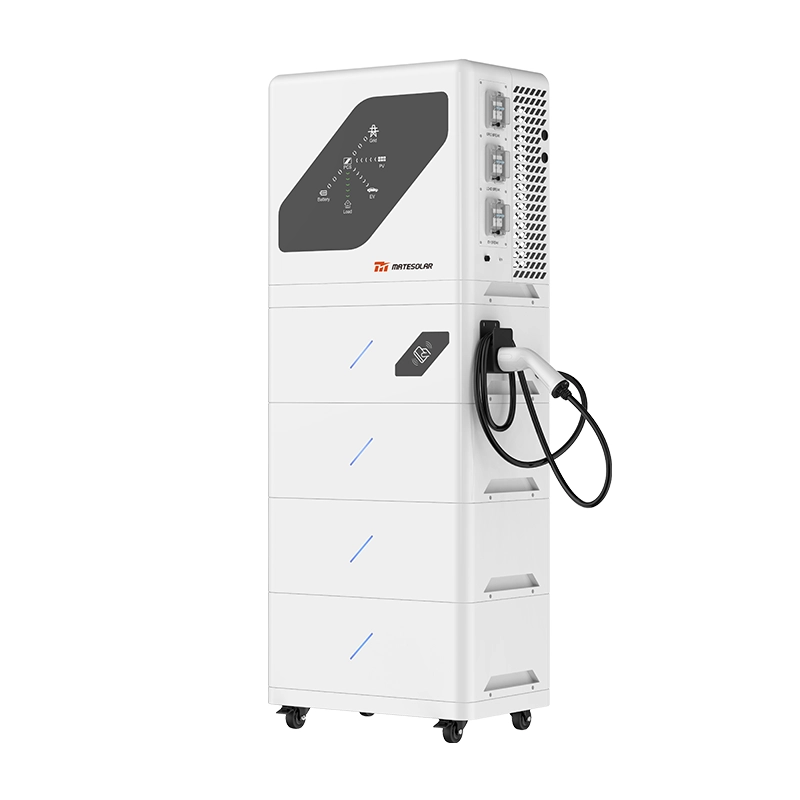
- Höhere Integrationsdichte: Die AC-DC-Integration in einem einzigen Schrank ist von einem Unterscheidungsmerkmal zu einer grundlegenden Anforderung geworden. Die fortschrittlichsten Systeme im 100–125-kW-Segment liefern jetzt 232–261 kWh in einem einzigen Schrank mit einer Grundfläche von weniger als 1,6 m². Das flüssigkeitsgekühlte Außenschrank-Energiespeichersystem von MateSolar mit 100 kW/232 kWh und 125 kW/261 kWh ist ein Beispiel für diese Klasse: ein vollständig integriertes, flüssigkeitsgekühltes, für den Außeneinsatz geeignetes Gehäuse, das für den schnellen Einsatz auf beengten Gewerbeflächen konzipiert ist.
- Flüssigkeitskühlung als neuer Standard: Passive und Zwangsluftkühlung sind bei den derzeit üblichen Zellenergiedichten (280 Ah und 314 Ah bei prismatischen LFP-Zellen, wobei zunehmend auf “Jelly-Roll”-Formate mit 560 Ah und mehr umgestellt wird) nicht mehr wettbewerbsfähig. Flüssigkeitskühlplatten halten die Temperaturunterschiede zwischen den Zellen innerhalb von 2–3 °C, verglichen mit 8–12 °C bei der Zwangsluftkühlung, was sich direkt auf die kalendarische Lebensdauer und die Sicherheit auswirkt. Die durchschnittliche jährliche Wachstumsrate für flüssigkeitsgekühlte Außenschränke wird bis 2030 auf 18–22% prognostiziert, angetrieben durch höhere Anforderungen an die Zyklenanzahl und strengere Garantiebedingungen.
- Modulare SkalierbarkeitDie Möglichkeit, mit 100 kW / 230 kWh zu beginnen und später zusätzliche Schränke auf 500 kW / 1,15 MWh parallel zu schalten, ohne die elektrische Infrastruktur des Standorts neu zu konzipieren, ist ein entscheidendes Verkaufsargument. Dies reduziert die anfänglichen Investitionskosten und ermöglicht es den Kunden, die Kapazitätserweiterung an das tatsächliche Lastwachstum oder die Tarifentwicklung anzupassen.
- Europäische Code-Konformität als vorintegrierte FunktionDie Kosten- und Zeitstrafe für die Nachrüstung von CE-, IEC 62933-, VDE-AR-N 4110- und UK G99-Konformität für ein nicht für Europa ausgelegtes System sind prohibitiv. Führende Anbieter liefern jetzt mit diesen Zertifizierungen, die bereits in der Produktdesignphase integriert sind. Kunden müssen zumindest Folgendes überprüfen: (1) CE-Kennzeichnung gemäß der Niederspannungsrichtlinie und der EMV-Richtlinie; (2) IEC 62619-Sicherheitszertifizierung für die Batteriezellen und -module; (3) IEC 62933-5-2 für das integrierte System; und (4) Zertifikate zur Netzcode-Konformität für das Zielland, insbesondere VDE-AR-N 4110 in Deutschland, G99 im Vereinigten Königreich, CEI 0-21 in Italien und RD 647 in Spanien. Systeme, denen diese Zertifikate fehlen, stehen nicht nur vor Marktzugangsbarrieren, sondern ab Juli 2026 auch vor einer strikten Ablehnung durch die Versicherung.
Tabelle 2: Vergleich gängiger Außenwand-Schranksysteme im europäischen C&I-Markt 2026
| Parameter | 100 kW / 232 kWh | 125 kW / 261 kWh | 200 kW / 418 kWh (parallel) | Bemerkungen |
| Fläche (m²) | 1.4–1.6 | 1.5–1.8 | 2.8–3.2 | Entscheidend für städtische Gewerbeflächen |
| Kühlmethode | Flüssigkeit (50%-Glykol-Wasser) | Flüssigkeit | Flüssigkeit | Zelle ΔT <3°C |
| Rundlauf-Wirkungsgrad (DC, System) | 90–91% | 90–91% | 89–91% | Gemessen bei 0,5C Ladung / 1C Entladung |
| AC-Spannung | 400V Drehstrom | 400V Drehstrom | 400V Drehstrom | Kompatibel mit Standard-LV-Platinen |
| Netzcodegesetzkonformität | VDE-AR-N 4110, G99, CEI 0-21 | Gleich | Gleich | Länderspezifische Firmware-Varianten |
| Brandbekämpfung | Aerosol + Wassernebel + aktive Entlüftung | Aerosol + Wassernebel | Pro Schrank unabhängig | Muss den UL 9540A-Test aufizzarebene erfüllen |
| Kommunikation | Modbus TCP, IEC 61850, MQTT-SN | Gleich | Gleich | MQTT-SN für Fernwarnung bei thermischem Durchgehen (IEC 63241-2) |
| Installationszeit (vor Ort) | 1–2 Tage | 1–2 Tage | 2–3 Tage | Schließt Tiefbauarbeiten und Netzanschluss aus |
Hinweis: Die Spezifikationen beziehen sich auf die Premium-Produktstufe von 2026. Die Outdoor-Schrankserie von MateSolar erfüllt oder übertrifft diese Benchmarks; detaillierte Datenblätter sind auf Anfrage erhältlich.
Das Segment der Außenschränke ist der Bereich, an dem sich Geschwindigkeit der Bereitstellung und Versicherbarkeit am stärksten überschneiden. Da diese Systeme werkseitig integriert und werkseitig getestet werden, unterstützen sie von Natur aus die vollständigen, großflächigen Feuertests auf Systemebene (LSFT), die Versicherer nun verlangen. Im Gegensatz dazu erfordern vor Ort montierte Mehrkomponentensysteme teure Tests vor Ort oder fallen in eine underwriting-grauzone. Diese Dynamik wird ausführlich in Thema Eins behandelt.
2.3 Segment Drei: Große gewerbliche & industrielle Solar-Speicher-Projekte (MWh-Maßstab, containerisiert)
Oberhalb der 2-MWh-Skala geht der Markt zu containerisierten Energiespeichersystemen über. Diese Projekte bedienen große Industrieanlagen, Logistikparks, Rechenzentrumscampusse, Nahwärmeverbünde und zunehmend netzgebundene kommerzielle Aggregationen.
Im Jahr 2026 werden Speicherkapazitäten im Großmaßstab (Front-of-Meter, in der Regel >10 MW) erstmals 30% der gesamten europäischen Speicherinstallationen ausmachen, wobei die Neuzugänge bei etwa 13 GW liegen werden – ein Anstieg von 50% gegenüber dem Vorjahr. Innerhalb des großen C&I-Segments ist die Projektklasse von 10 MWh bis 100 MWh am aktivsten.
Produktarchitektur
Der Standardbaustein ist ein 20- oder 40-Fuß-ISO-Container, der Batterien, PCS (Leistungsumwandlungssysteme), Wärmemanagement, Brandunterdrückung und Hilfsstromversorgung integriert. Zwei unterschiedliche Containerarchitekturen dominieren:
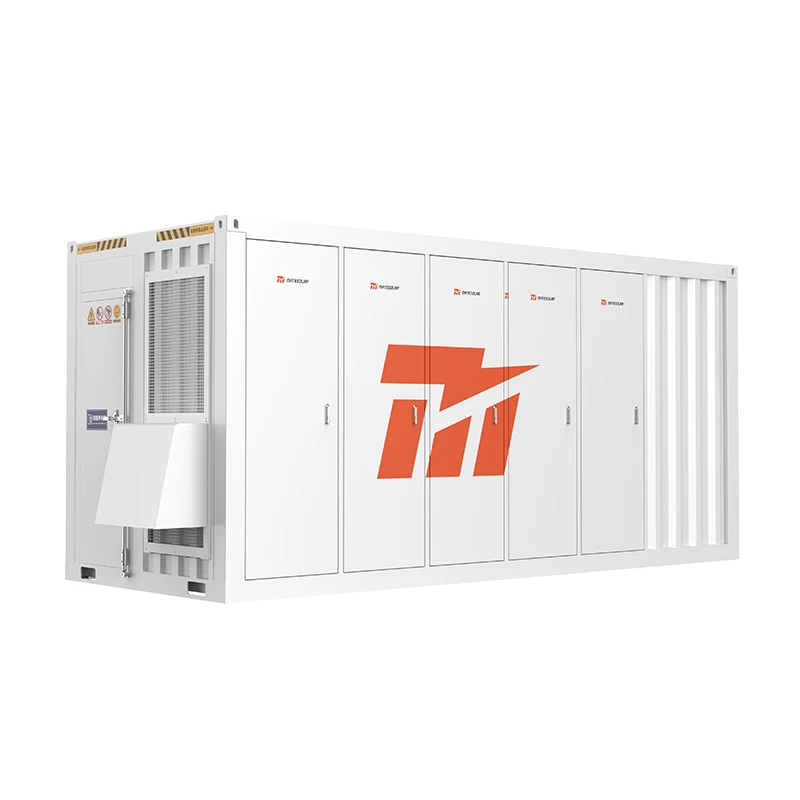
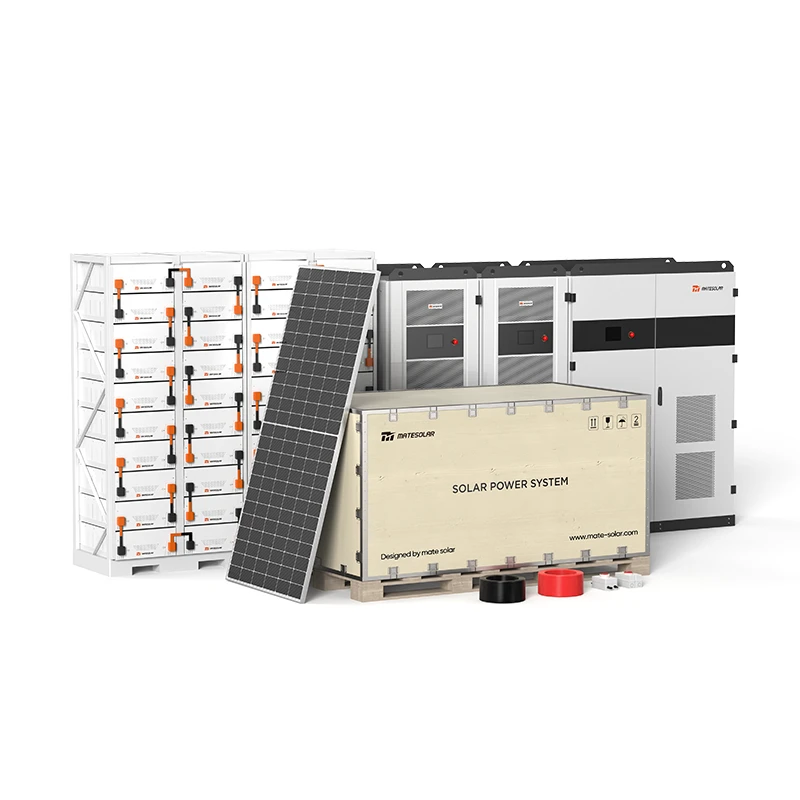
- Luftgekühlte Container-Systeme im Bereich von 1–2 MWh pro 40-Fuß-Container. Dies sind kostoptimierte Lösungen, bei denen sich die geringere Energiedichte und das einfachere Thermomanagement in niedrigeren Kapitalkosten pro kWh niederschlagen. Sie eignen sich für Anwendungen mit moderater Zyklenhäufigkeit (1 Zyklus pro Tag) und in gemäßigten Klimazonen. MateSolars 40Ft 1MWh 2MWh luftgekühlte Container-ESS-Energiespeichersysteme sind genau für dieses Einsatzprofil konzipiert und bieten eine robuste, einfach zu installierende Energiespeicherlösung mit bewährter Zuverlässigkeit.
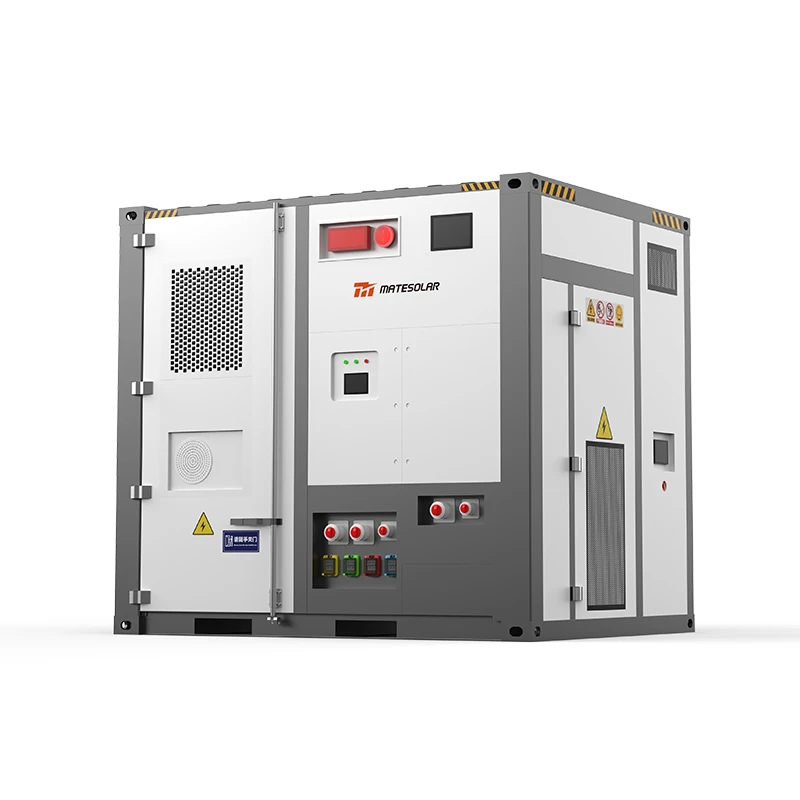
- Flüssigkeitsgekühlte Containersysteme mit einer Leistung von 3–5 MWh pro 20-Fuß-Container. Diese Systeme mit hoher Energiedichte reduzieren den Flächenbedarf um 50–70% pro MWh und senken die Kosten für die Anlagenperipherie, erfordern jedoch eine aufwendigere Inbetriebnahme und Wartung. Die höhere Energiedichte wird durch eine fortschrittliche Zellenanordnung und Flüssigkeitskühlung erreicht, was zudem die Lebensdauer verlängert. Das 20-Fuß-Flüssigkeitskühl-Container-Energiespeichersystem mit 3 MWh bzw. 5 MWh Leistung entspricht im Jahr 2026 dem neuesten Stand der Technik für Standorte mit hohem Durchsatz und begrenztem Platzangebot.
Umsatzmodell-Komplexität
Große C&I- und netzgebundene Projekte schöpfen Wert aus einem mehrschichtigen Ertragsstapel:
1. Großhandelsenergie-ArbitrageDer Handel an den Day-Ahead- und Intraday-Märkten, der die 15-minütigen Abrechnungsintervalle ausnutzt. Das Spread-Profil für 2026 zeigt starke Winterabendschwankungen (120–180 €/MWh) und tiefe Mittagsabfälle (0 bis negative 50 €/MWh während Perioden der Solar-Kannibalisierung). Deutschland verzeichnete in den 12 Monaten bis Juni 2026 fast 600 Stunden mit negativen Großhandelspreisen, was eine einzigartige “Aufladen und bezahlt werden”-Möglichkeit bietet.
2. KapazitätsmarktverträgeIn Frankreich werden bei der Kapazitätsauktion im November 2026 15-Jahres-Verträge für qualifizierte Speicheranlagen vergeben. Der Clearingpreis des britischen Kapazitätsmarktes für das Lieferjahr 2026–27 betrug 63 £/kW-Jahr. Für eine Anlage mit 10 MW / 20 MWh entspricht dies einer jährlichen vertraglich vereinbarten Einnahme von 630.000 £.
3. Frequenzgang und ergänzende DienstleistungenDie Märkte für FCR und aFRR in Deutschland, den Niederlanden und den nordischen Ländern bieten 20–50 €/kW-Jahr. Der Trend bis 2026 geht zu schneller reagierenden Produkten (sub-Sekunden für FCR), die nur Speicher bereitstellen können.
4. Entlastung von NetzengpässenIn den Niederlanden haben TenneT und regionale Netzbetreiber (DSOs) Plattformen zur Beschaffung von Flexibilität gestartet, auf denen Speicher für die Engpassvermeidung mit 15–25 €/MWh vergütet werden.
Politikrisiko: PCS-Herkunft und EU-Fördermittelzugang
Im Jahr 2026 ist ein wichtiger Risikofaktor hinzugekommen: Projekte, bei denen nicht-europäische Stromumwandlungssysteme (PCS) zum Einsatz kommen, kommen für eine Finanzierung durch die Europäische Investitionsbank (EIB) und bestimmte Kofinanzierungen aus EU-Strukturfonds nicht in Frage. Dies betrifft etwa 23% des adressierbaren Marktes für Großspeicher, der auf subventioniertes Kapital angewiesen ist. Es ist jedoch wichtig, den Umfang dieser Einschränkung zu verstehen:
- Es gilt spezifisch für EU-Finanzierungsinstrumente (EIB, Innovationsfonds, Connecting Europe Facility).
- Es gilt nicht für rein kommerzielle und industrielle Behind-the-Meter-Projekte, die die überwiegende Mehrheit der C&I-Installationen ausmachen.
- Dies schränkt den Betrieb, den Netzanschluss oder die Beteiligung an Energiemärkten zur Erzielung von Einnahmen nicht ein.
- Chinesische PC-Hersteller bauen aktiv europäische Montage- und Softwareentwicklungszentren auf, um bis 2028 die Kriterien für den “europäischen Ursprung” zu erfüllen.
Für C&I-Kunden, die MateSolar-Systeme einsetzen, ist diese Einschränkung weitgehend irrelevant: Die Zielanwendungen sind kommerzielle Installationen hinter dem Zähler, die nicht von öffentlichen EU-Mitteln abhängig sind. Dennoch sollte die Unterscheidung bei der Projektstrukturierung explizit bestätigt werden.
Netzanbindung: Der versteckte Zeitkiller
Die mit Abstand größte Quelle für Projektverzögerungen im Jahr 2026 ist die Genehmigung für den Netzanschluss. In Deutschland Niederspannungsanschlussverordnung und die damit verbundenen Prozesse des Netzbetreibers (DNO) haben einen Engpass geschaffen: Projekte über 500 kWh durchlaufen routinemäßig Prüfverfahren von 4–8 Monaten, wobei die Uhr erst nach Einreichung vollständiger Unterlagen zu ticken beginnt. In den Niederlanden führt die Kapazitätsknappheit in Niederspannungs- und Mittelspannungsnetzen dazu, dass neue Anschlüsse in überlasteten Gebieten einer Transportverzug (Verweigerung der Transportkapazität), wodurch sie effektiv in eine Warteschlange gestellt werden, bis der DSO das Netz verstärkt.
Zu den Minderungsstrategien, die erfolgreiche Entwickler anwenden, gehören:
- Projekt aufteilen: Installationen als mehrere Einheiten unter 200 kW zu konzipieren, die jede für das vereinfachte EU-Anzeigeverfahren gemäß der überarbeiteten Erneuerbare-Energien-Richtlinie in Frage kommen. Dies ist rechtlich zulässig, vorausgesetzt, jede Einheit verfügt über einen eigenen Wechselrichter, eine eigene Absicherung und eine eigene Messung.
- Kabel-Pooling (Polen): Der Kabel-Pooling-Rahmen des polnischen Amtes für Energieaufsicht ermöglicht es Speicheranlagen, sich einen Netzanschlusspunkt mit einem bestehenden erneuerbaren Generator zu teilen und damit die neue Anschlusswarteschlange zu umgehen. Dieses Modell wird für eine breitere europäische Einführung untersucht.
- VorgesprächInvestitionen in einen frühen technischen Dialog mit dem Netzbetreiber, einschließlich Lastflussstudien und Netzkapazitätsanalysen, können die Genehmigungsdauer um 6–10 Wochen verkürzen.
3. Die sieben kritischen Kundenthemen: Der definitive operative und strategische Leitfaden für 2026
Mit den Marktgrundlagen und Produktsegmenten, die etabliert sind, befassen wir uns nun mit den sieben Themen, die Kundengespräche im Feld dominieren. Dies sind keine theoretischen Bedenken. Es sind die spezifischen Hindernisse und Chancen, die darüber entscheiden, ob ein Speicherprojekt voranschreitet, ins Stocken gerät oder vollständig scheitert.
Thema Eins: Compliance und Versicherbarkeit – “Ich habe ein günstiges System gekauft und mein Versicherer hat es abgelehnt. Was nun?”
Kontext. Die Intersolar 2026 Konferenz (München, 10.–12. Juni) war ein Wendepunkt für den europäischen Speichersicherungsmarkt. Mehrere europäische Versicherer und Rückversicherer, darunter Allianz Global Corporate & Specialty, AXA XL und HDI Global, kündigten öffentlich deutlich verschärfte Underwriting-Anforderungen für gewerbliche Batteriespeicher-Energiesysteme (BESS) an. Die auslösenden Faktoren waren: (a) eine Häufung von fünf Bränden in C&I-Speichern in ganz Europa im ersten Quartal 2026, die zu Sachschäden und Betriebsunterbrechungsschäden in Höhe von über 40 Millionen Euro führten; (b) Ermittlungen nach den Vorfällen, die ergaben, dass vier der fünf Systeme keine systemweiten Großbrandprüfungen durchlaufen hatten; und (c) Druck von der Europäischen Aufsichtsbehörde für das betriebliche Altersvorsorgewesen (EIOPA), die Methoden zur Risikobewertung von BESS zu harmonisieren.
Die praktische Konsequenz ist, dass Beschaffungsentscheidungen, die ohne sorgfältige Prüfung der Versicherungsbedingungen getroffen wurden, nun rückgängig gemacht werden. Wir haben Fälle in Deutschland und im Vereinigten Königreich dokumentiert, bei denen vollständig installierte und in Betrieb genommene Systeme keine Betriebsabdeckung erhielten, weil der Ausrüstungslieferant keinen gültigen UL 9540A-Prüfbericht oder die entsprechende IEC-Zertifizierung vorlegen konnte. Banken, die diese Projekte finanzieren, haben ihre Anforderungen ebenfalls verschärft und in einigen Fällen Kündigungen wegen Vertragsbruchs ausgesprochen.
Der neue Compliance-Stack (Juli 2026)
Um Versicherungsschutz – und damit Projektfinanzierung – zu erhalten, muss eine C&I BESS-Anlage nun folgende Mindestkonformitätspaket erfüllen:
1. UL 9540A, 6. Auflage (gültig ab März 2026)Die entscheidende Änderung ist der obligatorische Großbrandtest (LSFT). Die 5. Ausgabe erlaubte Tests auf Zell- und Modulebene mit Extrapolation auf das Systemverhalten; die 6. Ausgabe schreibt einen Brandtest im Großformat an einer produktionsrelevanten Einheit in ihrer endgültigen Gehäusekonfiguration vor. Der Test muss Folgendes nachweisen:
- Keine Ausbreitung von thermischem Durchgehen über das auslösende Modul hinaus.
- Kein Auswurf von brennbarem Material aus dem Gehäuse.
- Keine Explosionsgefahr (gemessen an Druck und Gaskonzentration).
- Effektive Aktivierung des integrierten Unterdrückungssystems.
Versicherer verlangen universell, dass der Testbericht nicht älter als 3 Jahre ist und sich auf das exakt eingesetzte Systemmodell bezieht. “Ähnliche” oder “skalierte” Tests werden abgelehnt.
2. IEC 63241-2:2026 – Fernüberwachung von thermischem Durchgehen mit Frühwarnung (veröffentlicht am 6. Juli 2026, verbindlich ab 1. Dezember 2026)Dieser brandneue Standard, der nur vier Tage vor dem Datum dieses Artikels veröffentlicht wurde, wird bereits in die Checklisten der Versicherer aufgenommen. Er verlangt:
- Kontinuierliche Überwachung der Zellspannung, Temperatur und des Innendrucks (oder äquivalenter Stellgrößen) zur Früherkennung von Vorläufern einer thermischen Durchgehensreaktion.
- Kommunikation von Alarmsignalen innerhalb von 5 Sekunden nach Erkennung über das MQTT-SN-Protokoll über einen sicheren Kanal.
- Kompatibilität mit branchenüblichen Energiemanagementsystemen, insbesondere mit den Siemens Desigo CC und Schneider Electric EcoStruxure Plattformen als Referenzimplementierungen.
- Ein Überwachungssignal-Heartbeat, der bei einer Unterbrechung von mehr als 60 Sekunden eine automatische sichere Abschaltung auslöst.
Für Anlagenlieferanten ist die Einhaltung der IEC 63241-2 unerlässlich für jedes System, das nach Dezember 2026 eingesetzt wird. Die Produktgeneration 2026 von MateSolar verfügt über MQTT-SN-Kommunikation mit integrierter Alarmfunktion, die für die Integration in Siemens und Schneider vorab validiert wurde.
3. UK BS 7671, Änderung 4 (gültig ab Juli 2026)Das Institution of Engineering and Technology (IET) veröffentlichte im Juli 2026 die vierte Änderung der Wiring Regulations 18th Edition, die sofort in Kraft trat. Wichtige neue Anforderungen für Batteriespeicherinstallationen:
- Mindestabstand von 1,0 Meter zwischen Batteriegehäusen und jeglichen Gebäudeöffnungen (Türen, Fenster, Lüftungseinsaugungen), erhöht von den bisherigen 0,6 Metern.
- Mechanisch erzwungene Belüftung im Lagergehäuse oder -raum, ausgelegt für mindestens 5 Luftwechsel pro Stunde im Normalbetrieb und 15 Luftwechsel pro Stunde im Alarmzustand.
- Monatliche Funktionsprüfung und dokumentierte Verifizierung der Feuerlöschanlagenmedien (Aerosolgeneratoren, Wassernebeldüsen, Gasflaschen) mit Aufbewahrung der Aufzeichnungen für mindestens 5 Jahre und Vorlage beim Gebäudeversicherer auf Anfrage.
- Ein spezieller, deutlich gekennzeichneter “Feuerwehrofschalter” außerhalb des Gebäudes, der gleichzeitig AC- und DC-Stromkreise unterbricht.
Entscheidend ist, dass die örtliche Bauaufsichtsbehörde keine Schlussrechnung ausstellen wird – und das System daher nicht legal betrieben werden kann –, ohne die Erklärung des Installateurs, dass diese Bestimmungen erfüllt und unabhängig überprüft wurden. Dies hat im britischen Markt zu einem neuen Engpass geführt, da die Zahl der qualifizierten unabhängigen Prüfer begrenzt ist.
4. L-Klasse-Brandklassifizierung und das LöschproblemDas europäische Klassifizierungssystem für Lithium-Ionen-Batteriebrände hat die Brandklasse “L” übernommen und unterscheidet diese Brände von gewöhnlichen Elektrobränden (Brandklasse E) und Bränden brennbarer Flüssigkeiten (Brandklasse B). Ein Brand der Klasse L beinhaltet die Ausbreitung von thermischem Durchgehen, die Freisetzung brennbarer Gase (hauptsächlich Wasserstoff, Kohlenmonoxid und flüchtige organische Verbindungen) und die Möglichkeit einer Dampfwolkenexplosion. Herkömmliche Löschmittel – Pulver, CO₂, Standard-AFFF-Schaum – sind unwirksam und in einigen Fällen gefährlich, wenn sie auf einen Brand der Klasse L angewendet werden.
Die von der Versicherung vorgeschriebene Reaktionsstrategie hat sich von “Löschen” zu “kontrolliertes Abbrennen mit Eindämmung” verschoben. Das bedeutet:
- Das Gehäuse muss so konstruiert sein, dass es ein vollständiges thermisches Durchgehen für mindestens 2 Stunden (Feuerwiderstandsklasse) ohne strukturelles Versagen aushält.
- Die externe Kühlung von angrenzenden Strukturen ist zulässig, eine direkte Wassereinleitung in das Batteriegehäuse ist jedoch nicht gestattet, es sei denn, es ist speziell dafür konzipiert und getestet (Wasser kann durch Reaktion mit Lithium Wasserstoff erzeugen und intakte Zellen kurzschließen).
- Die Einsatzlehre der Feuerwehr akzeptiert nun eine “kontrollierte Abbrenndauer” von 6–10 Stunden für kleine Schranksysteme, mit Umfangsüberwachung und Luftüberwachung.
Diese Umstellung hat tiefgreifende Auswirkungen auf das Gebäudedesign, Grenzabstände und die Business Continuity-Planung. Betriebliche und versicherungstechnische Dimensionen von Bränden der L-Klasse behandeln wir in Thema Sechs.
Tabelle 3: Compliance-Anforderungen für C&I-Batteriespeicher – Checkliste des Versicherers, Juli 2026
| Anforderung | Standard / Verordnung | Wirksamkeitsdatum | Überprüfungsmethode | Folgen der Nichteinhaltung |
| Systemtechnischer Großbrandtest | UL 9540A 6. Aufl. | März 2026 | Prüfbericht von akkreditiertem Labor (UL, TÜV, Intertek) | Versicherungsablehnung, Rückzug der Bankfinanzierung |
| Frühwarnung vor thermischem Durchgehen aus der Ferne | IEC 63241-2:2026 | 1. Dezember 2026 | MQTT-SN-Protokollverifizierung, EMS-Integrationstest | Kann nicht nach Dezember 2026 beauftragt werden; rückwirkender Versicherungsausschluss |
| Installationssicherheit – UK | BS 7671 Änderung 4 | Juli 2026 | Unabhängige Verifizierungsprüfung, Abschlusszertifikat | System kann gesetzlich nicht betrieben werden; Verstoß gegen die Einhaltung von Mietvertrags-/Hypothekenbedingungen |
| CE / UKCA-Kennzeichnung | LVD, EMV, Maschinenrichtlinien | Kontinuierlich | Konformitätserklärung, technische Unterlagen | Marktzugang verweigert, Zollbeschlagnahme |
| Netzcodegesetzkonformität | National (VDE-AR-N 4110, G99, etc.) | Kontinuierlich | DNO Zeugenprüfung | Kein Netzanschluss; bestehender Anschluss kann getrennt werden |
| Brandbekämpfungsfunktion | Lokale Bauordnung + Versicherer | Monatlich | Dokumentierte Testprotokolle | Annullierung der Versicherungspolice |
Aktion: Bevor eine Bestellung ausgestellt wird, muss der Lieferant den exakten UL 9540A 6. Auflage Prüfbericht für die zu kaufende Systemkonfiguration vorlegen. Gleichen Sie die Modellnummer, das Prüfdatum und die geprüfte Konfiguration des Berichts mit dem kommerziellen Angebot ab. Wenn diese nicht exakt übereinstimmen, ist der Versicherungsschutz gefährdet.
Thema Zwei: Frankreich TURPE 7 Tarifreform – Die Frist im August 2026 und wie Sie den vollen Wert ausschöpfen können
Kontext. Am 1. August 2026 wird die französische Energieregulierungsbehörde, Commission de Régulation de l’Énergie (CRE), die siebte Iteration der Tarif für die Nutzung öffentlicher Stromnetze (TURPE 7), die Netzentgeltregelung, die für alle an öffentliche Verteilungs- und Übertragungsnetze angeschlossenen Stromverbraucher und -erzeuger gilt. Dies ist keine routinemäßige Tarifaktualisierung. TURPE 7 stellt die grundlegendste Neugestaltung der französischen Netzentgelte seit zwei Jahrzehnten dar und schafft asymmetrische Wertschöpfungsmöglichkeiten für Speicherbetreiber, die ihre Einsatzstrategien schnell anpassen – und asymmetrische Kostenstrafen für diejenigen, die dies nicht tun.
Die alte Logik, veraltet
Im Rahmen von TURPE 6 (2021–2026) zahlten gewerbliche Verbraucher einen Netztarif, der sich zusammensetzte aus:
- Eine fixe jährliche Abonnementgebühr (€/Jahr, basierend auf vertraglich vereinbarter Kapazität).
- Ein volumetrischer Bestandteil (€/MWh, proportional zur entnommenen Energie).
- Eine Blindleistungskorrekturgebühr (für schlechten Leistungsfaktor).
- Ein Spitzenlastanteil (€/kW pro Jahr), der auf dem höchsten Winter-Spitzenwert basiert.
Speichersysteme wurden unter der Annahme optimiert, dass die Netzentgelte im Wesentlichen fix oder in Abhängigkeit vom Gesamtverbrauch vorhersagbar variabel waren. Das Verschieben von Lasten von Spitzen- auf Nicht-Spitzenzeiten reduzierte die volumetrischen und die Spitzenlastkomponenten, aber die grundlegenden Preissignale waren zeitlich grob (Spitzen-/Nicht-Spitzenblöcke).
TURPE 7: “Einspritzung-Abfüllung” Dynamische Preisgestaltung
TURPE 7 führt drei strukturelle Änderungen ein:
1. Ersatz fester volumetrischer Gebühren durch zeit- und ortsabhängige Einspeise-/Entnahmeraten. Der Netzentgelt wird nun bestimmt durch (a) ob der Standort Strom ins Netz einspeist (Export) oder bezieht (Import), (b) die Tageszeit mit einer Granularität von 15 Minuten und (c) die spezifische 15-Minuten-Knoten-Zone aus den rund 3.000 Verteilzonen in Kontinentalfrankreich.
2. Zonale Differenzierung aufgrund von Netzengpässen. CRE hat das gesamte Verteilnetz in Zonen mit fünf Überlastungsstufen (A bis E, wobei A die geringste und E die kritischste Überlastung darstellt) eingeteilt. In den Überlastungszonen D und E wird bei Einspeisungen während der Solarspitzen (11:00–16:00 Uhr, April–September) eine negative Netzentgelte erhoben – effektiv eine Strafe für die Einspeisung, wenn das lokale Netz gesättigt ist. Umgekehrt ist die Entnahme während der Winterspitzenzeiten (08:00–12:00 und 17:00–21:00 Uhr, November–Februar) in diesen Zonen mit einem hohen Aufschlag verbunden, aber Injektion während dieser Stunden (d.h. beim Entladen einer Batterie) eine Vergütung für die Netzeinspeisung erhält.
3. Einführung einer dedizierten Speicherentgeltklasse. Erstmals können sich Speicheranlagen unter einem spezifischen “Speicher”-Tarifcode registrieren, der sie von doppelten Gebühren befreit (Zahlung von Einspeise- und Entnahmegebühren für dasselbe gespeicherte Elektron). Dies erfordert einen separaten Messpunkt und die Genehmigung durch Enedis oder den lokalen Netzbetreiber (DSO).
Die finanziellen Auswirkungen für C&I-Speicher
Die praktischen Auswirkungen von TURPE 7 auf ein repräsentatives 500 kW / 1 MWh C&I-Speichersystem in einer Zone D (moderate bis hohe Überlastung) in Südfrankreich sind unten zusammengefasst.
Tabelle 4: Geschätzte jährliche Netzgebührenbelastung unter TURPE 7 – 500 kW / 1 MWh Gewerbe-/Industriespeicher, Zone D, Südfrankreich
| Erlös/Kosten Element | TURPE 6 (Alt) | TURPE 7 (Neu) | Delta | Notiz |
| Festes Abonnement | €2,800 | €2,100 | -€700 | Speichertarifcode Rabatt |
| Volumenentnahme (€/MWh) | €18.50 | 12,00 € – 34,00 € (zeit- und zonenabhängig) | / | Hohe Varianz, Durchschnitt senken, wenn optimiert |
| Volumenspeisung (€/MWh) | N/A (eingegliedert in Rückzug) | -8,00 € bis +15,00 € | / | Negativ = Strafe für Export zur Mittagszeit; positiv = Belohnung für Spitzenentladung |
| Spitzenlastgebühr (€/kW-Jahr) | €22.00 | 28,00 € in Spitzenzeiten, 6,00 € außerhalb der Spitzenzeiten | / | Starker Anreiz zur Glättung von Winterspitzen |
| Netzausgleich für entlastende Entladung bei Überlastung | Keine | Bis zu 18 €/MWh in Zone D/E während der Spitzenzeiten | +4.500 €/Jahr | Basierend auf 250 MWh Spitzenentladung |
| Netto-Jahresnetzgebühr (optimierte Fahrweise) | €21,000 | €12,600 | -€8,400 | -40% |
CRE TURPE 7 Beratungsdokumentation, MateSolar-Modellierung. Individuelle Standortergebnisse variieren je nach Lastprofil, Zone und PV-Konfiguration.
Die Daten zeigen eine potenzielle Senkung der netzbezogenen Kosten um 40%, wenn der Speichereinsatz für die neue Tarifstruktur optimiert wird. Dies entspricht einer Steigerung der internen Rendite (IRR) um etwa 1–2 Prozentpunkte bei einem typischen C&I-Projekt, was den Ausschlag dafür geben kann, ob ein Investitionsvorhaben vom Vorstand genehmigt oder abgelehnt wird.
Der Kapazitätsmarkt November 2026: 15-jährige Umsatzsichtbarkeit
Frankreichs Kapazitätsmarktdesign (Fähigkeitsmechanismusführt seine nächste langfristige Auktion im November 2026 durch und vergibt 15-jährige Kapazitätsverträge für Lieferungen ab Winter 2028–29. Behind-the-meter-Speicheranlagen, die zu einem virtuellen Kraftwerk (VPP) aggregiert sind, sind ausdrücklich zulässig, vorausgesetzt, sie können eine Mindestentladezeit von 2 Stunden und eine Telemetrieintegration mit dem Planungssystem von RTE nachweisen.
Strategische Maßnahme für Speicherentwickler: Beginnen Sie den Zertifizierungsprozess mit einem anerkannten VPP-Aggregator (Voltalis, Energy Pool, Flexcity etc.) bis September 2026, um für das Pre-Qualifying im Oktober bereit zu sein. Der Wert des Kapazitätszertifikats in der Auktion 2025 betrug ca. 35.000 €/MW-Jahr; ein 500-kW-Asset würde 17.500 € jährliche Erlöse aus vertraglich vereinbarter Kapazität generieren, indexgebunden und sehr kreditwürdig. Diese Ertragsschicht, kombiniert mit Einsparungen bei den TURPE 7-Netzentgelten und der Energiearbitrage, ergibt ein überzeugendes risikoadjustiertes Renditeprofil, das derzeit auf keinem anderen europäischen Markt seinesgleichen findet.
Schlüsselbotschaft für Kunden: Wenn Sie ein Speichersystem in Frankreich betreiben und Ihren Dispatch-Algorithmus nicht bis August 2026 für TURPE 7 aktualisiert haben, lassen Sie pro 500-kW-System jährlich 6.000 € bis 10.000 € liegen – und zahlen möglicherweise Strafen für eine nicht optimierte Mittelwerteinspeisung.
Thema Drei: 15-Minuten-Handel und dynamische Tarife – Jeden Euro Wert aus Intraday-Volatilität herausquetschen
Kontext. Die europäischen Intraday- und Day-Ahead-Strommärkte haben ihre Migration auf 15-minütige Abrechnungsintervalle (von 60-minütig) zum Januar 2026 für alle gekoppelten Märkte abgeschlossen. Gleichzeitig hat Deutschland Energiewirtschaftsgesetz Novelle (EnWG §41a) schreibt nun vor, dass jeder Stromlieferant mit mehr als 50.000 Kunden mindestens ein dynamisches Tarifprodukt anbieten muss, das Großhandelspreissignale in 15-Minuten-Granularität weitergibt. Bis Q3 2026 sind allein in Deutschland über 12 Millionen gewerbliche Stromzähler für eine Viertelstunden-Messung geeignet und für dynamische Tarife berechtigt. Der Rest der EU verfolgt eine ähnliche Entwicklung, da die Strommarktdesignreform (Verordnung 2024/1747) die Mitgliedstaaten verpflichtet, dynamische Tarife bis 2027 zu ermöglichen.
Die praktische Auswirkung: Jedes Speichersystem, das noch mit einer regelbasierten Fahrweise arbeitet, die Entscheidungen nur einmal pro Stunde trifft, lässt erhebliches Geld liegen. Der 15-Minuten-Markt erzeugt regelmäßig Preisspreizungen von 30 bis 60 €/MWh innerhalb einer Stunde, insbesondere während des morgendlichen Anstiegs (06:00–08:00 Uhr) und der abendlichen Spitzenlast (17:00–20:00 Uhr), wenn erneuerbare Energien steile kurzfristige Preisgradienten erzeugen.
Quantifizierung des verpassten Werts
Die Analyse von 12 Monaten deutscher Day-Ahead- und Intraday-Preisdaten (15-Minuten-Auflösung) von Juli 2025 bis Juni 2026 liefert folgende Ergebnisse beim Vergleich der Dispatch-Strategien für ein Speichergerät mit 500 kW / 1 MWh:
- Stundenweise regelbasierte Disposition (Aufladen während der 6 günstigsten Stunden, Entladen während der 6 teuersten Stunden): 71% des theoretischen maximalen Energiearbitragewerts wurden erzielt.
- 15-minütige Preisvorhersage-Versand (rollierende Optimierung mit perfekter Vorausschau als Referenzwert): 91% des theoretischen Maximums erreicht.
- KI/ML-gestützte vorausschauende Disposition (Agent für verstärkendes Lernen, trainiert anhand von Preis-, Last- und Prognosedaten zu erneuerbaren Energien aus drei Jahren): Erreichte im Out-of-Sample-Test 85% des theoretischen Maximums und zeigte damit einen Zuwachs von 8–15% gegenüber der regelbasierten Steuerung.
Die jährliche Differenz zwischen einer regelbasierten und einer KI-gesteuerten Dispositionsstrategie betrug etwa 3.800 € pro 100 kW Speicherkapazität oder 2,5–3,0 Prozentpunkte des unleveraged Projekt-IRR.
Die Negativpreismisschance
Auf den europäischen Stromgroßhandelsmärkten kam es in den zwölf Monaten bis Juni 2026 so häufig wie nie zuvor zu negativen Preisen. In Deutschland wurden 598 Stunden mit negativen Day-Ahead-Preisen verzeichnet (6,81 TP3T aller Stunden), die sich stark auf die mittägliche Solarspitzenzeit (11:00–16:00 Uhr) in den Frühjahrs- und Sommermonaten konzentrierten. Der durchschnittliche Negativpreis während dieser Ereignisse lag bei -42 €/MWh, wobei Extremwerte bis zu -120 €/MWh erreichten.
Bei einem 1-MWh-Speichersystem ergibt sich durch das Aufladen in Zeiten mit negativen Strompreisen und das Entladen während der anschließenden Abendspitzenlast (die in denselben Sommermonaten durchschnittlich 156 €/MWh betrug) eine Bruttospanne von bis zu 276 €/MWh – vor Netzentgelten und Verlusten. Selbst unter Berücksichtigung von Rundlaufverlusten (10%) und variablen Netzentgelten liegt die Nettospanne regelmäßig über 200 €/MWh. Ein System, das diesen Zyklus an 150 Tagen pro Jahr durchführen kann (eine realistische Häufigkeit basierend auf der Analyse des Solarstromprofils für 2026), erzielt eine jährliche Arbitragemarge von 30.000 € pro MWh Speicherkapazität.
Lastgangmanagement mit 15-Minuten-Auflösung
Der “Ratschen-Effekt” bei gewerblichen Spitzenlastgebühren ist eine der am wenigsten verstandenen, aber bestrafendsten Eigenschaften kommerzieller Stromtarife. In den meisten EU-Tarifstrukturen basiert die Spitzenlastgebühr (€/kW) nicht auf dem durchschnittlichen monatlichen Spitzenwert, sondern auf dem höchsten einzelnen 15-Minuten-Spitzenwert über den gesamten 12-monatigen Abrechnungszeitraum. Ein schlecht gemanagter Nachmittag – eine Wolke, die über das Solaranlage zieht und zu einem Lastanstieg führt, bevor der Speicher reagieren kann, oder ein ungeplanter Fertigungsprozess, der mit einem Spitzenwert bei der Netzstromlieferung zusammenfällt – kann die Spitzenlastgebühr für die nächsten 12 Monate festlegen und die jährliche Stromrechnung für einen mittelgroßen Gewerbestandort um 5.000 bis 15.000 Euro aufblähen.
Speichersysteme, die darauf ausgelegt sind, die Nachfrage zu begrenzen, müssen in der Lage sein, subsekundenschnell zu reagieren und eine kontinuierliche 15-minütige gleitende Fensteroptimierung durchzuführen. Eine einfache Schwellenwertsteuerung (“wenn Last > Ziel, entladen”) verpasst schnelle Transienten und kann vorzeitig reagieren, wodurch die gespeicherte Energie aufgebraucht wird, bevor der eigentliche tarifrelevante Spitzenwert erreicht ist. Die modernste Lösung ist die modellprädiktive Regelung (MPC), die die Standortlast für die nächsten 2 Stunden mit einer Auflösung von 15 Minuten vorhersagt, die Wahrscheinlichkeitsverteilung der Nachfragetarifausswirkungen berechnet und die Speicherung so steuert, dass die erwarteten jährlichen Nachfragetarifkosten minimiert werden.
Technologieanforderung: BMS mit hochauflösender Zeitplanung
Um effektiv in 15-Minuten-Märkten und dynamischen Tarifen zu partizipieren, muss das Batteriemanagementsystem Folgendes unterstützen:
- Sub-Sekunden-Leistungssollwert-Updates über Modbus TCP oder IEC 61850.
- Zeitsynchronisierte Zeitplanung mit Netzwerkzeitprotokoll (NTP)-Genauigkeit besser als 100 ms.
- Onboard-Zeitplan-Speicher für 24–48 Stunden (damit der Betrieb bei Ausfall des Site Controllers oder der Cloud-Verbindung ununterbrochen fortgesetzt werden kann).
- Ein lokaler Steuerungsmodus, der zeitabhängiges Laden/Entladen über eine gespeicherte Tarifdatentabelle ausführen kann, die täglich über eine API aktualisiert wird.
Viele Legacy-BMS-Designs, insbesondere solche, die aus Anwendungen für die Notstromversorgung von Wohngebäuden oder Telekommunikationsanlagen stammen, verfügen nicht über diese Fähigkeit. Bei der Bewertung von Geräten sollten Sie den Lieferanten auffordern, die Ausführung von Zeitplänen über 15 Minuten mit Zeitstempel-Daten zum Stromexport nachzuweisen.
Thema Vier: Netzanschluss – Den Genehmigungsstau umgehen
Kontext. Die Krise bei den Netzanschlüssen für Speicherprojekte ist kein Einzelfall mehr, sondern wird systematisch dokumentiert. Eine Umfrage der European Association for Storage of Energy (EASE) unter 120 C&I-Speicherentwickler:innen im 2. Quartal 2026 ergab:
- Durchschnittliche Anschlussgenehmigungszeit für Systeme >500 kWh7,3 Monate in Deutschland, 6,8 Monate in den Niederlanden, 5,9 Monate in Belgien.
- Prozentsatz der Anträge, die Netzverstärkungsstudien erfordern: 42% in den Niederlanden (vor allem aufgrund der Auslastung der Mittelspannungstransformatoren in Industriegebieten), 28% in Deutschland.
- Projekte, die aufgrund von Verzögerungen und Kosten bei der Netzintegration aufgegeben wurden: 16% der Projekte, die die Antragsphase erreicht hatten, wurden anschließend gestrichen, was einem nicht realisierten Speicherausbau von etwa 1,2 GWh entspricht.
Die Ursachen sind struktureller Natur. Stromnetze wurden für einen unidirektionalen Stromfluss von Umspannwerken zu Verbrauchern konzipiert. In Gebieten mit hoher C&I PV-Durchdringung sättigen mittägliche Rückwärtsflüsse die Transformatoren von Mittel- auf Niederspannung. Die Hinzufügung von Speichern als bidirektionale Anlage – auch wenn sie diese Engpässe beheben kann – löst die Verpflichtung des Netzbetreibers aus, eine vollständige Systemauswirkungsbewertung durchzuführen, da die Exportfähigkeit des Speichers eine weitere Quelle für potenzielle Rückwärtsflüsse hinzufügt. Der regulatorische Rahmen hat mit der technischen Realität, dass richtig gesteuerte Speicher reduziert der Bedarf an Netzausbau, nicht erhöht ihn.
Regulatorische Fragmentierung
Eine besonders schwierige Herausforderung für Solar-Plus-Speicher-Hybridprojekte (die gängigste C&I-Konfiguration) besteht darin, dass sie mehrere regulatorische Instrumente umfassen, die nicht für die Interaktion ausgelegt waren:
- Das EEG (Erneuerbare-Energien-Gesetz) regelt die Vergütung und den Einspeisevorrang von PV-Anlagen.
- Die Netzanschlussverordnung regelt technische Anforderungen für den Netzanschluss.
- Die Messstellenbetriebsgesetz regelt die Messung.
- Die Stromsteuergesetz und Energiesteuergesetz Strombesteuerung und Eigenverbrauchsbefreiungen regeln.
Ein hybrides Projekt muss alle vier erfüllen, und die Schnittstellen zwischen ihnen sind schlecht definiert. Beispielsweise kann eine EEG-subventionierte PV-Anlage, die später mit einem Speicher nachgerüstet wird, ihre Einspeisevergütung verlieren, wenn der Speicher nicht in einer bestimmten Konfiguration separat gemessen wird – ein Detail, das viele Projektentwickler erst in der Endabnahmephase entdecken.
Praktische Workarounds (geprüft und einsatzfähig)
1. Die Ausnahmeregelung für unter 200 kW
Die überarbeitete Erneuerbare-Energien-Richtlinie (RED IV, in Kraft seit 2025) und deren Netzcode-Umsetzung straffen den Netzanschlussprozess für Erzeugungs- und Speicheranlagen unter 200 kW. Spezifisch müssen Netzbetreiber den Netzanschlussantrag innerhalb von 2 Monaten bearbeiten und dürfen dem Antragsteller keine Kosten für Netzverstärkungsmaßnahmen auferlegen, es sei denn, das System überschreitet nachweislich die lokale Aufnahmekapazität des Netzes.
Wie Entwickler dies nutzen: Ein 1 MW / 2 MWh Projekt kann als fünf unabhängige 200 kW / 400 kWh Blöcke konzipiert und genehmigt werden, jeder mit eigenem Wechselrichter, Schutzrelais und Messpunkt. Jeder Block wird an einen separaten Punkt der internen Niederspannungssammelschiene des Standorts angeschlossen. Aus Sicht des Netzbetreibers werden fünf separate Anträge unter 200 kW mit jeweils einer Bearbeitungszeit von 2 Monaten bearbeitet. Aus Anwendersicht werden die Blöcke von einer zentralen Steuerung am Standort als ein aggregiertes Asset gesteuert.
Vorbehalt: Diese Strategie muss transparent mit dem Netzbetreiber (DNO) besprochen werden. Einige Netzbetreiber (insbesondere in Bayern und Baden-Württemberg) haben dem Ansatz der “Entkopplung” (Disaggregation) widersprochen und argumentiert, dass die gebündelte Kapazität des Standorts die relevante Kennzahl sei. Frühe Rechtsgutachten von Energierechtskanzleien (Becker Büttner Held, Görg) deuten darauf hin, dass die Position des Netzbetreibers rechtlich schwach ist, sofern jede Einheit tatsächlich unabhängig steuerbar ist und alle individuellen technischen Anschlussanforderungen erfüllt. Dennoch ist mit regionalen Unterschieden zu rechnen.
2. Polens Cable-Pooling-Modell
Polen hat beim Cable Pooling eine Vorreiterrolle eingenommen (Anschlussgemeinschaft), wodurch ein neues Speicherasset einen bestehenden Netzanschlusspunkt legal mit einem Wind- oder Solarpark teilen kann. Der Speicher benötigt keinen eigenen Anschlussantrag; er wird unter einer gemeinsamen Anschlussvereinbarung mit klar definierten Betriebsumschlägen betrieben. Das polnische Amt für Energieaufsicht (URE) hat seit der Finalisierung des Rahmens im Jahr 2024 über 500 MW an kabelgebündeltem Speicher genehmigt. Die Europäische Kommission prüft aktiv das Kabel-Pooling als Best Practice für den Rest der EU, wobei ein Leitfaden für das erste Quartal 2027 erwartet wird.
Bei gewerblichen und industriellen Standorten mit einem bereits bestehenden, erheblichen Netzanschluss (z.B. für ein Werk) ist für die Hinzufügung von Speichersystemen in der Regel kein neuer Anschlussantrag erforderlich, es sei denn, die Exportkapazität des Speichersystems übersteigt die bestehende Anschlusskapazität. Das Prinzip des “nicht-festen” Anschlusses wird zunehmend akzeptiert: Die Speicheranlage erklärt sich bereit, niemals mehr als einen bestimmten Grenzwert zu exportieren, und der Netzbetreiber (DNO) akzeptiert den Anschluss ohne Verstärkungsstudien. Dies erfordert eine Exportbegrenzungsvorrichtung (Leistungsreglerelais), die vom Netzbetreiber versiegelt und geprüft wird.
3. Kapazitätsanalyse in frühen Phasen
Das am wenigsten genutzte Werkzeug in der Projektentwicklung ist eine Netzanschlusskapazitätskarte. Viele europäische Netzbetreiber veröffentlichen inzwischen interaktive Karten, die die verfügbare Kapazität an jeder Mittelspannungsstation zeigen. Der Abgleich potenzieller Projektstandorte mit dieser Karte, bevor Mietverträge abgeschlossen werden, kann Projekte eliminieren, die auf Hindernisse bei der Netzintegration stoßen würden. Das Projektentwicklungs-Support-Team von MateSolar kann Sie bei der vorläufigen Prüfung der Netzanschlusskapazität für Kundenstandorte in Deutschland, Frankreich, den Niederlanden und Polen unterstützen.
Thema Fünf: Investitionsrenditen und Bankfähigkeit – Die Forderungen des CFOs nach überprüfbaren Zahlen
Diskurs. Der Diskurs über C&I-Speicher wurde historisch von enthusiastischen Umsatzprognosen dominiert, die eine schnelle Amortisation versprachen, aber wenig prüfbare Details enthielten. Im Jahr 2026 scheitert dieser Ansatz. CFOs und Unternehmensschatzmeister, die für die Energiebeschaffung verantwortlich sind, verfügen über granulare Stromrechnungsdaten, gut entwickelte Finanzmodellierungsfähigkeiten und einen gesunden Skeptizismus, der sich aus jahrelangen überzogenen Versprechungen für Energieeffizienzprojekte speist. Sie verlangen drei Dinge:
1. Ein transparentes, länderspezifisches und steuerregimebewusstes Cashflow-Modell.
2. Unabhängige Überprüfung der Kernannahmen (Preisspannen, Degradationsraten, Wartungskosten).
3. Ein Risikomanagement-Framework, das die “Was-wäre-wenn”-Szenarien berücksichtigt – was, wenn sich die Spreads verengen, was, wenn das System ausfällt, was, wenn sich die regulatorischen Rahmenbedingungen ändern.
Dieser Abschnitt beschreibt die Modellstruktur und die länderspezifischen Benchmarks, die glaubwürdige Investitionsfällen zugrunde liegen.
Länderspezifische Amortisationsunterschiede
Nicht alle europäischen Märkte sind gleich. Die statische Amortisationszeit für ein identisches 500 kW / 1 MWh System kann je nach Land um das 2,5-fache variieren. Tabelle 5 erfasst die Kernwirtschaftlichkeit.
Tabelle 5: C&I Speicher-Amortisations-Benchmarks – 500 kW / 1 MWh, Standard-Tarif für Gewerbekunden mit angeschlossener PV, 2026
| Land | Gesamte installierte Kosten (€/kWh) | Jährliche Einsparungen & Einnahmen (€) | Einfache Amortisationszeit (Jahre) | Unlevered IRR (10 Jahre) | Primärer Werttreiber | Schlüsselfaktor für das Risiko |
| Deutschland | 420–480 | 102,000–118,000 | 3.5–4.5 | 12–15% | Hohe Einzelhandelsmargen, Nachfragetarife, dynamischer Tarif | Unsicherheit bei der EEG-Umlage für PV-Eigenverbrauch |
| Vereinigtes Königreich | 450–520 | 95,000–120,000 | 3.8–4.5 | 11–14% | TRIAD-Vermeidung, Kapazitätsmarkt, hohe Spitzenpreise | Netzcode-Konformitätskosten, G99-Prozess |
| Italien | 400–460 | 72,000–88,000 | 5.0–6.0 | 9–12% | Hohe Solar-Eigenverbrauchssteigerung, Spitzenlastabdeckung | Bürokratische Genehmigungsverfahren in einigen Regionen (Sizilien) |
| Spanien | 380–440 | 65,000–80,000 | 5.5–6.5 | 8–11% | Solar-Kannibalisierungsarbitrage, Nachfrageladungen | Regulatorisches Risiko bei Eigenverbrauchsumlagen |
| Frankreich | 410–470 | 78.000–96.000 (TURPE 7 optimiert) | 4.5–5.5 | 10–13% | TURPE 7 Netzkompensation, Kapazitätsmarkt | TURPE 7 Optimierungskomplexität; November-Auktionsqualifikation |
| Niederlande | 430–490 | 48,000–60,000 | 8.0–10.0 | 5–8% | Spitzenvermeidung von Netzentgelten, Strombörsenmarkt | Geringe Energiespreizung, unsichere Netzentgelt-Auslaufphase |
| Polen | 370–430 | 60,000–75,000 | 5.5–6.5 | 9–12% | Kapazitätsmarkt, Kosteneinsparungen durch Cable Pooling | Währungsrisiko (PLN), sich entwickelnde Vorschriften |
Annahmen: 500-kW-/1-MWh-Anlage, 330 Zyklen/Jahr, 90%-Gesamtwirkungsgrad, 0,5% jährliche Leistungsminderung, einschließlich Betrieb und Wartung zu 8 €/kWh-Jahr. Die Einsparungen umfassen Energiearbitrage, Senkung des Spitzenbedarfs und Steigerung des Eigenverbrauchs. Finanzierungskosten sind nicht enthalten. Analyse von MateSolar.
Das Energy-as-a-Service (EaaS)-Modell
Für viele C&I-Kunden – insbesondere mittelständische Unternehmen ohne eigene Energiemanagement-Teams oder mit anderen Prioritäten bei der Kapitalverwendung – ist das „Energy-as-a-Service“-Modell der ausschlaggebende Faktor für die Einführung. Im Rahmen von EaaS fallen für den Kunden keinerlei Vorabinvestitionen an. Das Speichersystem befindet sich im Besitz eines Drittinvestors (oder der Finanzierungssparte des Technologieanbieters) und wird von diesem betrieben, und der Kunde zahlt eine monatliche Gebühr auf Basis der tatsächlich erzielten Stromeinsparungen, die in der Regel als Anteil an den nachgewiesenen Einsparungen strukturiert ist (z. B. behält der Kunde 25–35% der Einsparungen, der EaaS-Anbieter den Rest).
Ein EaaS-Vertrag für ein deutsches KMU mit einem 500 kW / 1 MWh System könnte wie folgt strukturiert sein:
- Die Stromgrundkosten basieren auf 12-monatigen Messdaten vor der Installation, normalisiert für Wetterbedingungen und Produktionsvolumen.
- Monatliche Messung und Verifizierung (M&V) nach IPMVP Option C (Regressionsmodell für die gesamte Anlage).
- Aufteilung der Einsparungen: 30% an den Kunden, 70% an den EaaS-Anbieter in den ersten 7 Jahren; im 7. Jahr geht das Eigentum zum Marktwert auf den Kunden über oder der Vertrag wird zu einer neu ausgehandelten Aufteilung verlängert.
- Leistungsgarantie: Sollte das Speichersystem in einem beliebigen Zeitraum von 12 Monaten nicht mindestens 80% der modellierten Einsparungen erzielen, zahlt der Anbieter eine Vertragsstrafe in Höhe des Fehlbetrags.
Aus Sicht des kaufmännischen Leiters (CFO) des Kunden handelt es sich hierbei um eine außerbilanzielle Betriebsausgabe, die vom ersten Tag an vollständig eigenfinanziert ist. Das Kreditrisiko liegt beim EaaS-Anbieter, nicht beim Kunden, weshalb Versicherung und technische Due Diligence von größter Bedeutung werden.
CBAM Kohlenstoffkostenabrechnung
Eine neuere Überlegung, die für energieintensive C&I-Unternehmen zunehmend von Bedeutung ist, ist die Wechselwirkung zwischen netzseitigen Solar-Plus-Speicheranlagen und dem EU-Mechanismus zur Grenzanpassung von CO2-Emissionen (CBAM). CBAM, das bis Ende 2025 in seiner Übergangsphase und ab 2026 in seiner endgültigen Phase ist, erhebt einen CO2-Preis auf importierte Waren in den abgedeckten Sektoren (Stahl, Aluminium, Zement, Düngemittel, Strom, Wasserstoff). Importeure müssen CBAM-Zertifikate abgeben, die den eingebetteten Emissionen ihrer Produkte entsprechen.
Für einen CBAM-pflichtigen Hersteller kann der Stromverbrauch, der nachweislich aus der eigenen erneuerbaren Stromerzeugung (Solar) stammt und in einem eigenen Batteriespeicher gespeichert wird, vom Emissionsfaktor des Stromnetzes ausgeschlossen werden, der zur Berechnung der eingebetteten Emissionen verwendet wird. Der Wert dieses Ausschlusses hängt von der CO₂-Intensität des nationalen Stromnetzes und dem CO₂-Preis des EU-Emissionshandels ab. Bei 110 €/tCO₂ spart die Vermeidung des Netzemissionsfaktors von 350 gCO₂/kWh bei einem jährlichen Eigenverbrauch von 500 MWh 175 Tonnen CO₂-Äquivalent, was einer jährlichen Einsparung von 19.250 € an CBAM-Zertifikatskosten entspricht – eine direkte Barauswirkung, die ein Speichersystem durch die Verschiebung der Solarstromerzeugung in Verbrauchsperioden ermöglicht.
Die Mess- und Berichtsanforderungen sind streng: Die Anlage muss über eine zertifizierte erneuerbare Energiequelle verfügen, über eine Messtechnik, die selbst verbrauchten erneuerbaren Strom von Netzstrom unterscheidet, und über eine nachweisbare Herkunftskette. Für das selbst verbrauchte Volumen müssen die Energie-Herkunftsnachweise (Guarantees of Origin) gelöscht werden. Richtig konfiguriert, wertet das Speichersystem den CBAM-Wert erheblich auf, da es die Solareinspeisung an das Verbrauchsprofil der Anlage anpasst und somit das Volumen an netzunabhängigem, kohlenstoffarmem Strom maximiert.
Thema sechs: Betrieb, Wartung und Sicherheit aus der Perspektive des L-Klassen-Brandrisikos
Kontext. Die Sicherheitsdiskussion rund um die Speicherung von Lithium-Ionen-Batterien in Europa hat sich im Jahr 2026 dramatisch verschoben. Feuerwehrverbände in Deutschland (DFV), Großbritannien (NFCC) und Frankreich (BSPP) haben aktualisierte Einsatzrichtlinien für Batteriebrände herausgegeben, die die “kontrollierte Verbrennung”-Doktrin formalisieren. Dies hat tiefgreifende Auswirkungen auf das Systemdesign, die Wartungsprotokolle, die Versicherungsdeckung und die Business-Continuity-Planung.
Das Wiederzündungsproblem
Das bestimmende Merkmal von L-Klassen-Batteriebränden ist das Potenzial für eine Ausbreitung der thermischen Durchgehensreaktion über die Zellen hinweg über einen längeren Zeitraum, wobei es Stunden oder sogar Tage nach dem scheinbaren Löschen des ersten Brandes zu einer Wiederentzündung kommt. Dies geschieht, weil:
- Beschädigte Zellen, die während des ursprünglichen Ereignisses ihre thermische Durchbruchstemperatur nicht erreicht haben, können Wärme von benachbarten Bränden aufnehmen und eine verzögerte kaskadierende Ausfallerscheinung auslösen.
- Die Elektrolyse-Zersetzungsgase (Wasserstoff, Kohlenmonoxid, Methan) können sich in totraumartigen Bereichen des Gehäuses ansammeln und beim Wiedereinführen von Sauerstoff nach anfänglicher Unterdrückung erneut entzünden.
- Lithiummetallablagerungen, die während einer schnellen Entladung entstehen, können heftig mit Feuchtigkeit reagieren und Wärme und Wasserstoff erzeugen.
Die Feuerwehr rät nun, dass das Lagergehäuse nach einem Vorfall mindestens 24–48 Stunden lang mit Wärmebildkameras überwacht werden soll und dass kein Versuch unternommen werden darf, das Gehäuse zu betreten oder zu öffnen, bevor diese Beobachtungszeit abgelaufen ist und die Gaskonzentrationen unter den Explosionsgrenzen bestätigt wurden.
Betriebsunterbrechungsversicherung
Dieser verlängerte Wiederherstellungszeitplan macht eine Betriebsunterbrechungsversicherung (BI) zu einer kritischen – und teuren – Komponente des Storage-Risikomanagementpakets. Wichtige Überlegungen für den CFO und den Risikomanager:
- BI EntschädigungszeitraumMuss auf mindestens 12 Monate ab dem Verlustdatum festgelegt werden, um die Lieferzeiten für den Austausch von Geräten (6–8 Monate für kundenspezifisch konfigurierte Container-Systeme), die Sanierung von Standorten und die Wiederzulassung zu berücksichtigen.
- VersicherungssummeBerechnet als der Bruttogewinn (oder Umsatz abzüglich nicht fortzuführender Aufwendungen), den das Unternehmen über den Entschädigungszeitraum aus den durch das Speichersystem generierten Kosteneinsparungen bei Strom und den daraus resultierenden Einnahmequellen erzielt hätte, zuzüglich etwaiger zusätzlicher Kosten, die zur vorübergehenden Ersetzung der Speicherfunktion anfallen (z. B. höhere Stromkosten aus dem Netz).
- BI Wartezeit (Selbstbehalt)Typischerweise 30–60 Tage. Der Kunde sollte dies auf 7–15 Tage herunterhandeln, auf Kosten einer höheren Prämie, da der erste Monat ohne Lagerhaltung zu einem sofortigen Anstieg der Nachfragegebühren führen kann.
- Risiko der gegenseitigen AbhängigkeitWenn das Speichersystem in die Brandmelde-, HLK- oder Prozessleitsysteme des Gebäudes integriert ist, könnte ein Brandereignis, das diese Integrationen beschädigt, die BI auf den Hauptgeschäftsbetrieb ausweiten. Klare Isolationsvorkehrungen sind unerlässlich.
Präventive Diagnostik: Erfassung von Vorläufern für thermisches Durchgehen
Die Industrie hat sich auf eine Reihe messbarer Frühindikatoren geeinigt, die thermischen Durchgehungen in Lithium-Eisenphosphat-Systemen (LFP), die den C&I-Markt dominieren, 24–72 Stunden vorausgehen:
1. Schrittweise Abweichung der ZellspannungWenn eine Zelle beginnt, sich intern abzubauen (Dendritenwachstum, Elektrolytzersetzung), weicht ihre Leerlaufspannung unter Ruhebedingungen um >50 mV vom Packungsdurchschnitt ab.
2. Coulombsche Effizienzdegradation: Eine Zelle mit einem internen Kurzschluss weist einen ungewöhnlichen Kapazitätsverlust und einen Coulomb-Wirkungsgrad von unter 99,51 TP3T auf, was durch regelmäßige Kapazitätskalibrierungszyklen festgestellt werden kann.
3. Temperaturanstiegsrate während des LadevorgangsEine beschädigte Zelle zeigt während der Konstantstrom-Ladephase eine schnellere Temperaturerhöhung, die über die Temperatursensoren des Batteriemanagementsystems mit einer Auflösung von 0,1 °C/Minute detektierbar ist.
4. GassensorikWasserstoff- und Kohlenmonoxid-Sensoren im Gehäuse können eine frühe Elektrolytzersetzung bei Konzentrationen weit unterhalb der Entflammbarkeitsgrenzen erkennen. Der neue Standard IEC 63241-2 schreibt die Integration dieser Sensoren in die Fernalarmanlage vor.
Systeme mit Cloud-verbundenen Analyseplattformen verarbeiten diese Daten kontinuierlich und kennzeichnen Zellen, die vordefinierte statistische Schwellenwerte überschreiten, zur Inspektion vor Ort oder zurFernabschaltung. Die Produktlinie von MateSolar unterstützt den Fernzugriff auf Diagnosedaten mit sicherer VPN-basierter Konnektivität. Dies ermöglicht es unseren technischen Supportingenieuren, BMS-Daten zu analysieren, anomale Zellen zu identifizieren und klare schriftliche Anweisungen für lokale Elektriker bereitzustellen, um betroffene Module zu isolieren und zu umgehen – und das alles, ohne dass eine physische Präsenz von MateSolar vor Ort erforderlich ist.
Gesamtkosten des Besitzes: Flüssigkeitskühlung vs. Luftkühlung, eine 10-Jahres-Betrachtung
Eine hartnäckige Frage von technisch versierten Käufern ist, ob sich die Preisprämie für Flüssigkeitskühlung über die 10-jährige Nutzungsdauer rechtfertigt. Tabelle 6 zeigt die vergleichenden Wirtschaftlichkeitsberechnungen.
Tabelle 6: 10-Jahres-Gesamtkosten für den Besitz (TCO) – Flüssigkeitskühlung vs. Luftkühlung, 500 kW / 1 MWh, Mitteleuropäisches Klima
| Kostenart | Flüssigkeitsgekühlt | Luftgekühlt | Delta | Erklärung |
| Anfangskapitalkosten (€/kWh) | 465 | 420 | +45 | Aufschlag für Flüssigkeitskühlplatten, Pumpe, Wärmetauscher |
| Durchschnittlicher jährlicher Energieverbrauch (MWh) | 370 | 340 | +30 | Flüssigkeitskühlung ermöglicht höhere anhaltende C-Raten ohne Leistungsreduzierung |
| Jährliche Zellabbau-Rate | 1.8% | 2.4% | -0.6% | Niedrigere durchschnittliche Betriebstemperatur (28°C vs. 38°C) |
| Nutzbare Kapazität Jahr 10 (kWh) | 835 | 772 | +63 | Abbaudifferenzverbindungen |
| Jährliche Wartung (€/Jahr) | 1,500 | 800 | +700 | Kühlmittelanalyse, Pumpeninspektion, Dichtungswechsel |
| Rücklage für Ersatzbeschaffung (€/Jahr gebucht) | 600 | 900 | -300 | Längere Zelllebensdauer reduziert die Ersatzkosten |
| Versicherungsprämiendifferenz (€/Jahr) | -200 | 0 | -200 | Einige Versicherer bieten Rabatte für flüssigkeitsgekühlte Systeme an (niedrigere Brandrisikoklasse). |
| Netto-Gesamtbetriebskosten über 10 Jahre (€) | 582,000 | 595,000 | -13,000 | Flüssigkeitskühlung über die gesamte Lebensdauer günstiger, trotz höherer Anschaffungskosten |
Hinweis: Der TCO-Vorteil der Flüssigkeitskühlung verstärkt sich in heißeren Klimazonen (Südeuropa) und für Anwendungen mit höherer Zyklenzahl. Für ein System in Süditalien oder Spanien steigt der TCO-Vorteil der Flüssigkeitskühlung über 10 Jahre auf 20.000 bis 25.000 Euro. Luftgekühlte Systeme bleiben wettbewerbsfähig in Anwendungen mit geringer Zyklenzahl und gemäßigtem Klima, bei denen die anfänglichen Kapitalkosten die primäre Einschränkung darstellen.
Thema Sieben: Das Natrium-Ionen-Batteriefenster – Wird 2026 das Jahr, in dem die Gewerbe- und Industrie-(C&I)-Speichertechnologie von Lithium abrückt?
Der kommerzielle Durchbruch von Natrium-Ionen-Batterien (Na-Ionen) für die stationäre Speicherung ist seit Jahren eine wiederkehrende Geschichte des “nächsten Jahres”. Im Jahr 2026 hat sich die Diskussion jedoch von technologischen Versprechen zu substanziellen Marktangeboten verlagert. Mehrere chinesische Hersteller (CATL, HiNa Battery, Natron Energy) bieten mittlerweile containerisierte und schrankbasierte Na-Ionen-Produkte mit veröffentlichten Spezifikationen, Garantiebedingungen und Lieferzeiten an. Europäische OEMs integrieren Na-Ionen-Zellen in ihre BESS-Plattformen.
Für C&I-Käufer stellt sich nicht mehr die Frage, “ob” Natrium-Ionen relevant wird, sondern “für welche Anwendungen und zu welchen Kompromissen?”.”
Die überzeugenden Vorteile
1. Lebensdauer, die die Kapitalabschreibung neu definiert
Natrium-Ionen-Zellen erreichen nachweislich eine Zyklenlebensdauer von 10.000–15.000 Zyklen bis zum 80%-Zustand, verglichen mit 4.000–6.000 Zyklen bei Premium-LFP-Zellen, die unter vergleichbaren Bedingungen betrieben werden. Bei einer Anwendung im C&I-Bereich mit hoher Zyklenfrequenz Anwendung (z. B. 1,5 Zyklen pro Tag, 550 Zyklen pro Jahr) kann ein Natrium-Ionen-System theoretisch 18–27 Jahre lang betrieben werden, bevor es die 80%-Kapazitätsschwelle erreicht, gegenüber 7–11 Jahren bei LFP.
Die finanziellen Auswirkungen sind eindeutig: Wenn die Leistungselektronik des Speichersystems, das Wärmemanagement und das Gehäuse für eine Lebensdauer von 20 Jahren ausgelegt sind, reduziert eine Na-Ionen-Batterie die Notwendigkeit eines Austauschs der Batterie in der Mitte der Lebensdauer (eine Hauptkostenbelastung, die den internen Zinsfuß eines Projekts schmälert). Für ein System mit 500 kWh spart die Vermeidung eines einzigen Batteriewechsels im 8. Jahr etwa 60.000–80.000 € in Barwert oder 12.000–16.000 € pro 500 kWh über 10 Jahre.
2. Intrinsische Sicherheitsprofil
Natrium-Ionen-Zellen können ohne irreversible Schäden vollständig auf 0 V entladen werden, eine Eigenschaft, die das Risiko von gespeicherter Energie während des Transports, der Installation und der Demontage eliminiert. Ihre thermische Durchgehtemperatur liegt deutlich höher als bei LFP (typischerweise 220–250 °C gegenüber 160–180 °C bei LFP unter ähnlichen Missbrauchbedingungen). Dies führt zu einer geringeren Brandrisikoklassifizierung und potenziell reduzierten Versicherungsprämien, sobald die Versicherer versicherungsmathematische Daten entwickelt haben. Für Anwendungen in bewohnten Gebäuden, unterirdischen Installationen oder an Standorten mit minimalen Grenzabständen ist der Sicherheitsunterschied von Bedeutung.
3. Tieftemperaturleistung ohne Energieaufwand
Na-Ionen-Zellen behalten bei -20 °C mehr als 90% ihrer Nennkapazität bei, verglichen mit 60–70% bei Standard-LFP-Zellen. Auf den nordischen Märkten entfällt dadurch der Bedarf an Gehäuseheizungen, die in den Wintermonaten 3–5% der gespeicherten Energie verbrauchen. Bei einer 500-kWh-Anlage in Schweden oder Finnland vereinfachen die eingesparte Heizenergie und die geringere Komplexität der Isolierung die Anlagenauslegung und verbessern den Nettoenergieertrag.
4. Unabhängigkeit der Lieferkette
Die Rohstofflieferkette für Natrium-Ionen-Batterien – Natrium, Eisen, Mangan und Kohlenstoff – ist global reichlich vorhanden und geopolitisch verteilt. Es gibt keine Parallele zur Lithiumkonzentration in Australien-Chile-China oder zur Kobaltkonzentration in der Demokratischen Republik Kongo. Für europäische Industrieabnehmer, die zunehmend auf Lieferkettenresilienz und geopolitische Risiken bedacht sind, ist dieses Diversifizierungsargument überzeugend.
Die Kompromisse, die ehrlich bewertet werden müssen
1. Energiedichte und Flächenverbrauch
Natrium-Ionen-Zellen erreichen derzeit auf Zellebene 120–150 Wh/kg, verglichen mit 160–180 Wh/kg bei den gängigen LFP-Zellen. Auf Systemebene (einschließlich Gehäuse, Wärmemanagement und Leistungselektronik) beträgt der Verlust an volumetrischer Energiedichte etwa 25–35%. Bei gleicher Nennleistung in MWh benötigt eine Natrium-Ionen-Anlage mehr Platz – ein nicht zu vernachlässigender Faktor in dicht bebauten europäischen Industriegebieten, in denen die Immobilienkosten bei 50–150 €/m² pro Jahr liegen.
Abwägungsrechnung: Zusätzlich 10 m² Bodenfläche, die über 10 Jahre zu einem kalkulatorischen Mietzins von 75 €/m²/Jahr genutzt werden, erhöhen die effektiven Systemkosten um 7.500 €. Übersteigen die Lebenszykluseinsparungen des Na-Ionen-Systems 15.000 € pro 500 kWh, ist die Flächenbelastung finanziell akzeptabel; sind die Einsparungen gering, spricht sie dagegen.
2. Technologiereife und Garantiesicherheit
Natrium-Ionen-Produkte haben in europäischen kommerziellen Umgebungen nur begrenzte Praxiserfahrungen. Die ersten großtechnischen Na-Ionen-Installationen für Gewerbe und Industrie (C&I) wurden 2025 in Betrieb genommen, und 5-jährige Betriebsdaten existieren einfach nicht. Die Garantiebedingungen von Na-Ionen-Zellherstellern entwickeln sich weiter – einige bieten 10-jährige Garantien mit Leistungsgarantien an, doch die finanzielle Stärke des Garantiegebers und die Durchsetzbarkeit grenzüberschreitender Garantieansprüche für eine relativ neue Technologieklasse erfordern sorgfältige rechtliche Prüfungen.
3. Integrationskompatibilität
Na-Ionen-Zellen weisen andere Spannungsprofile als LFP auf (Nennspannung typischerweise 2,8–3,1 V gegenüber 3,2 V für LFP). Das bedeutet, dass das Stromumwandlungssystem (PCS) und das Batteriemanagementsystem speziell für die Na-Ionen-Chemie ausgelegt sein müssen. Ein PCS, das für LFP-Spannungsfenster ausgelegt ist, kann nicht einfach ohne Hardware- und Firmware-Änderungen an einen Na-Ionen-Batteriestack angeschlossen werden. Dies schränkt die Möglichkeit ein, die Chemie vor Ort auszutauschen, und birgt ein Beschaffungsrisiko, das explizit bewertet werden sollte.
Das Urteil für 2026
Für C&I-Kunden mit den folgenden Profilen verdient Na-Ionen eine ernsthafte Bewertung:
- Hochzyklusanwendungen (≥ 2 Zyklen/Tag), bei denen die Lebenszykluskosten dominieren.
- Nordische und alpine Installationen, bei denen tiefe Temperaturen Heizkosten sparen.
- Sicherheitskritische Standorte (historische Gebäude, Krankenhäuser, Lebensmittelverarbeitung), an denen das geringere Brandrisiko einen Wert hat, der über Versicherungsprämien hinausgeht.
- Unternehmen mit expliziten Vorgaben zur Diversifizierung der Lieferkette.
Für Standard-Einzyklusanwendungen in gemäßigten europäischen Klimazonen bleibt LFP im Jahr 2026 die kostenoptimierte und bewährte Wahl. MateSolar beobachtet die Na-Ionen-Technologie aktiv und qualifiziert Zelllieferanten für die Integration in unsere Plattformarchitekturen, um sicherzustellen, dass, wenn die Technologie die Preisschwelle und den praxiserprobten Status erreicht – was im Zeitraum 2027–2028 erwartet wird – ein nahtloser Migrationspfad für unsere Kunden verfügbar ist.
4. Produktlösungen im Einklang mit den Anforderungen für 2026
Die vorangegangenen Abschnitte haben eine detaillierte Spezifikation dessen dargelegt, was eine erfolgreiche C&I-Speicherbereitstellung im Jahr 2026 erfordert: versicherbare Konformität, 15-minütige Dispositionsfähigkeit, Einhaltung des Netzkodex, ein thermisches Management, das für die Betriebsumgebung geeignet ist, und ein physikalischer Formfaktor, der für Standort und Anwendung geeignet ist. In diesem Abschnitt verbinden wir diese Anforderungen mit spezifischen Produktarchitekturen, die von MateSolar erhältlich sind, und weisen auf die wichtigsten Designmerkmale hin, die die oben genannten Herausforderungen bewältigen.
Für hocheffiziente gewerbliche PV + Speicher-Hybride: Gewerbliches 500-kW-Hybrid-Solar-System
Das 500 kW Hybrid-Solarsystem dient als zentrale Stromumwandlungsplattform für große C&I-Anlagen. Entwickelt für europäische Netzbedingungen, unterstützt es:
- Direkte Gleichstromkopplung von PV-Strängen und Batteriebänken an einen gemeinsamen Gleichstrombus, wodurch die Verluste bei der AC-DC-AC-Umwandlung minimiert und der Rundlaufwirkungsgrad von Solar zu Batterie auf über 96% verbessert wird.
- Mehrere unabhängige MPPT-Eingänge zur Bewältigung komplexer kommerzieller Dachgeometrien mit Teilverschattung.
- Volle Konformität mit den Netzcodes VDE-AR-N 4110 (Mittelspannung) und G99 (Niederspannung), mit Zertifikatsdokumenten zur Überprüfung durch den Versicherer.
- 15-Minuten-Zeitplanungsschnittstelle über Modbus TCP und IEC 61850, kompatibel mit führenden Energiemanagementsystem-Plattformen.
- Inselnetzschutz und Frequenzänderungsrate (RoCoF)-Durchfahren getestet gemäß den neuesten EU-Netzkodex-Anforderungen.
Für schnell einsetzbare Standorte mit begrenztem Platz: 100kW/232kWh 125kW/261kWh flüssigkeitsgekühlte Outdoor-Schrank-Energiespeichersysteme
Diese flüssigkeitsgekühlte Outdoor-Schrankserie erfüllt die Kernanforderungen des Marktes von 2026 in Bezug auf Konformität, Platzbedarf und Leistung:
- VersicherungsfähigkeitMit einem UL 9540A 6. Auflage System-Level-Großbrand-Testbericht geliefert, der das LSFT-Protokoll enthält und von allen großen europäischen Gewerbeimmobilienversicherern akzeptiert wird.
- IEC 63241-2 konform: Eingebettetes MQTT-SN Frühwarnsystem für thermisches Durchgehen, mit vorkonfigurierten Integrationspfaden für Siemens und Schneider EMS.
- Flüssigkeitskühlung serienmäßig: Hält zellinterne Temperaturgleichmäßigkeit innerhalb von 2°C aufrecht, unterstützt direkt die Garantie für eine Lebensdauer von mehr als 6.000 Zyklen und reduziert die Brandrisikoklassifizierung.
- 100 kW und 125 kW LeistungsknotenPasst zu den beiden dominanten europäischen C&I-Lastklassen, ohne zu groß oder zu klein zu sein.
- Modulare ErweiterungBeginnen Sie mit einem Schrank; fügen Sie einen zweiten oder dritten hinzu, wenn die Last steigt oder sich die Tarifbedingungen ändern, ohne eine neue Genehmigung einholen oder eine neue Konstruktion planen zu müssen.
- Schnelle Installation: Fabrikintegriert und getestet; Baustellenarbeiten beschränkt auf Betonfundament, Stromanschluss und Kommunikationskabel – typischerweise 1–2 Tage Inbetriebnahme vor Ort.
Für große, kostensensitive Anwendungen: 40-Fuß-Container-Energiespeichersystem mit 1 MWh/2 MWh Luftkühlung
Wo die Kapitalkosten pro kWh der Haupttreiber und die Zyklenfrequenz moderat ist, bietet der 40-Fuß-Luftkühlercontainer:
- Bewährte Zuverlässigkeit mit Millionen von Betriebsstunden bei weltweiten Einsätzen.
- Vereinfachte Wartung: Keine zu wartenden Flüssigkühlkreisläufe; alle Komponenten von der Gangway im Inneren des Containers aus zugänglich.
- Skalierbar von 1 MWh auf 10 MWh durch Parallelschaltung von Containern, mit einer zentralen Steuerung, die den aggregierten Betrieb verwaltet.
- 40-Fuß-ISO-Grundfläche, kompatibel mit Standardtransport, schneller Bereitstellung und einfacher Verlagerung, falls der Mietvertrag für den Standort ausläuft.
Für Hochleistungs- und Hochzyklusanforderungen: 20 Fuß 3 MWh 5 MWh Flüssigkühlcontainer Energiespeichersystem
Wenn Kosten für Bodenfläche, Zyklenanzahl oder Durchsatzanforderungen das Projekt in Richtung des Hochleistungsbereichs drängen, liefert der 20-Fuß-Flüssigkühlcontainer:
- 3–5 MWh pro 20-Fuß-ISO-Container, was die für MWh benötigte Fläche im Vergleich zu luftgekühlten 40-Fuß-Lösungen halbiert.
- Flüssigkeitskühlung, die eine Zelllebensdauer von >8.000 Zyklen und eine anhaltende Lade-/Entladefähigkeit von 1C unterstützt, um den Wert der Energiegewinnung durch Arbitrage zu maximieren.
- Integrierte Brandunterdrückung und Gasdetektion gemäß UL 9540A 6. Ausgabe und IEC 63241-2 Standards.
- Kompatibel mit dem 500-kW-Hybrid-Wechselrichter für eine komplette, werkseitig abgestimmte Energieblocklösung.
5. Häufig gestellte Fragen (FAQ)
Der folgende FAQ-Bereich fasst die Fragen zusammen, die im Jahr 2026 während technischer Kundenberatungen und Projektbewertungen in ganz Europa am häufigsten aufkamen.
F1: Wird mein Versicherer nach einem “systembezogenen Testbericht gemäß UL 9540A 6. Auflage” fragen? Der Lieferant hat mir einen zellenbezogenen Testbericht gegeben. Ist das ausreichend?
Nein. Die 6. Auflage der UL 9540A schreibt einen Test am vollständig montierten System in seiner endgültigen Gehäusekonfiguration vor – dem Großbrandszenario-Test (LSFT). Tests auf Zell- und Modulebene waren in früheren Ausgaben akzeptabel, werden aber von europäischen Versicherern für Neuinstallationen nun ausdrücklich abgelehnt. Sie müssen den Systembericht erhalten, der Ihrem exakten Gerätemodell entspricht. Überprüfen Sie die Modellnummer und das Testdatum. Wenn der Lieferant dieses Dokument nicht vorlegen kann, ist Ihr System nicht versicherbar, was in der Regel bedeutet, dass die Bank den Projektkredit nicht auszahlt.
Welche Mindest-Brandunterdrückungssysteme sind für einen 1 MWh Außenkabinett in Deutschland erforderlich?
Deutsche Baubestimmungen und Versicherungsanforderungen schreiben effektiv einen mehrschichtigen Ansatz vor: (1) Aerosol- oder Inertgas-Löschanlagen im Batteriegehäuse, ausgelöst durch Rauch-/Gas-/Temperatursensoren; (2) ein externer Wasseranschluss (Storz-Kupplung) für die Feuerwehr zur Kühlung angrenzender Strukturen – nicht zur direkten Einspeisung in die Batterie; (3) eine Brandmelde- und Alarmanlage, die mit der Hauptbrandmeldeanlage des Gebäudes verbunden ist; und (4) eine deutlich gekennzeichnete externe Notabschaltung (Feuerwehrschalter). Zusätzlich fordert die VdS (die deutsche Versicherungsprüfstelle) nun die Validierung der gesamten Löschanlage für Brände der Brandklasse L. Fordern Sie vom Ausrüstungshersteller eine VdS-Anerkennung oder eine gleichwertige Zertifizierung.
F3: Kann ich mein 600-kW-Speicherprojekt legal in drei 200-kW-Einheiten aufteilen, um das vereinfachte EU-Netzanschlussverfahren zu erhalten?
Ja, vorausgesetzt, jede 200-kW-Einheit ist elektrisch und funktional unabhängig: Jede muss über einen eigenen Wechselrichter, ein eigenes Netzschutzrelais mit Inselnetzschutz und ein eigenes Messsystem verfügen. Sie können koordiniert gesteuert werden, aber die Netzbetreiber müssen sie als drei separate Netzanschlusspunkte betrachten. Frühere rechtliche Anfechtungen einiger Netzbetreiber waren bisher vor Gericht nicht erfolgreich, aber wir empfehlen eine frühzeitige, transparente Diskussion mit dem Netzbetreiber und, wenn möglich, eine rechtliche Prüfung der spezifischen regionalen regulatorischen Auslegung. Die 200-kW-Schwelle wird ausdrücklich im EU-Netzkodex für den Anschluss von Lasten (NC DCC) genannt.
F4: Mein Unternehmen ist in Frankreich ansässig. Muss ich vor August 2026 etwas unternehmen, um von TURPE 7 zu profitieren?
Ja. Gehen Sie sofort wie folgt vor: (1) Ermitteln Sie anhand der von CRE/Enedis veröffentlichten Karten die TURPE-7-Überlastungszone (A bis E) Ihres Standorts; (2) Beauftragen Sie einen Energieberater oder nutzen Sie ein Optimierungstool, um Ihre 15-Minuten-Last, die PV-Erzeugung und den Speichereinsatz unter der neuen Tariflogik “Injection-Soutirage” zu modellieren; (3) stellen Sie sicher, dass die Steuerung Ihres Speichersystems einen täglich aktualisierten 24-Stunden-Zeitplan mit einer Auflösung von 15 Minuten empfangen und ausführen kann – idealerweise über eine API-Verbindung zu einem Tarifprognosedienst. Der Unterschied zwischen einer optimierten und einer nicht optimierten Einsatzplanung unter TURPE 7 kann bis zu 40% Ihrer jährlichen Netzkosten betragen, sodass sich die Investition in geeignete Steuerungssysteme bereits innerhalb weniger Wochen amortisiert.
Q5: Wie lange ist die tatsächliche, verifizierte Amortisationszeit für ein Gewerbe- und Industrie-Speichersystem in Deutschland im Jahr 2026?
Basierend auf tatsächlichen Überwachungsdaten von über 50 deutschen Gewerbe- und Industriekundenstandorten, die von einem unabhängigen M&V-Anbieter aggregiert wurden, beträgt die mediane einfache Amortisationszeit für ein 500 kW / 1 MWh PV-Speichersystem im deutschen KMU-Tarifsegment 4,2 Jahre, mit einer Bandbreite von 3,5–5,0 Jahren. Die wichtigsten Variablen, die die Bandbreite beeinflussen, sind: (1) die Differenz zwischen dem Spitzen- und dem Nebenlast-Strompreis des Standorts; (2) die Größe und Form des Lastprofils des Standorts; (3) die Qualität der PV-Speicher-Einsatzoptimierung. Standorte mit professionell abgestimmtem, auf 15-Minuten-Intervalle bedachtem Einsatz konzentrieren sich durchweg am unteren Ende der Bandbreite (3,5–4,0 Jahre).
F6: Wie funktioniert die Garantie für ein Speichersystem, das bei MateSolar gekauft wurde?
MateSolar bietet eine standardmäßige 10-jährige Produktgarantie und eine 10-jährige Leistungsgarantie für unsere Energiespeichersysteme, mit spezifischen jährlichen Energie-Durchsatz- und Kapazitätserhaltungsgarantien, die im Garantiezertifikat definiert sind. Im Falle eines Hardwaredefekts versendet MateSolar Ersatzteile mit detaillierten Installationsanleitungen, die es einem qualifizierten lokalen Elektriker ermöglichen, die Reparatur durchzuführen. Bei schwerwiegenden Qualitätsproblemen wird ein vollständiger Austausch des Geräts veranlasst. Softwareprobleme werden aus der Ferne vom technischen Supportteam von MateSolar gelöst, das sich auf sichere Weise auf den Controller des Systems zugreifen kann, um Firmware zu diagnostizieren, neu zu konfigurieren oder zu aktualisieren. Für groß angelegte containerisierte Projekte kann MateSolar Ingenieure für den Kundendienst vor Ort entsenden, um die Inbetriebnahme, Integrationstests und Schulungen durchzuführen, wodurch sichergestellt wird, dass das System voll funktionsfähig ist und das Betriebsteam des Kunden mit der täglichen Überwachung und den Notfallverfahren vertraut ist.
Q7: Ich ziehe Natrium-Ionen für meine neue Installation in Betracht. Bietet MateSolar bereits Na-Ionen-Produkte an?
Stand Juli 2026 prüft MateSolar aktiv Na-Ionen-Zellen von führenden Herstellern und hat die Integration in unsere flüssigkeitsgekühlten Schrank- und Containerplattformen prototypisiert. Wir haben jedoch noch keine kommerzielle Na-Ionen-Produktlinie auf den Markt gebracht, da wir der Meinung sind, dass die Technologie weitere 12-18 Monate Feldvalidierung benötigt, bevor wir die gleiche Garantiebereitschaft und Bankability-Dokumentation bieten können, die wir für unsere LFP-Produkte anbieten. Wir erwarten, dass wir im Laufe des Jahres 2027 eine Na-Ionen-Option in unser Produktportfolio aufnehmen werden, zunächst mit Fokus auf Anwendungen mit hoher Zyklenzahl und für kalte Klimazonen. Unsere LFP-Systeme sind mit einer Spannungs- und Kommunikationsarchitektur konzipiert, die einen zukünftigen Upgrade-Pfad für Na-Ionen-Module ermöglicht und somit die Investitionen unserer Kunden in das Systemschutzgitter schützt.
Q8: Wie ist die Lieferzeit für ein 1-MWh-Außenschranksystem im Juli 2026?
Die Standardlieferzeit beträgt 8–10 Wochen ab bestätigter Bestellung und Zahlung des Anzahlungseingangs, sofern keine ungewöhnlichen Anpassungen vorgenommen werden. Das System wird komplett montiert und werkseitig getestet geliefert. Die Seefracht zu großen europäischen Häfen (Rotterdam, Hamburg, Antwerpen, Barcelona) verlängert die Lieferzeit um 4–5 Wochen. Der Landtransport zum Standort und die Inbetriebnahme vor Ort verlängern die Lieferzeit um 1–2 Wochen. Kunden sollten einen Gesamtzeitrahmen von 14–17 Wochen ab Bestellung bis zum betriebsbereiten Zustand einplanen, einschließlich der Transportzeiten. Die Genehmigungszeit für den Netzanschluss kommt hinzu und läuft parallel zur Lieferung der Ausrüstung – wir empfehlen dringend, den Netzantrag gleichzeitig mit der Gerätebestellung einzureichen, um Leerlaufzeiten vor Ort zu vermeiden.
6. Fazit: Ein Markt in großem Maßstab erfordert einen Partner in großem Maßstab
Der europäische Markt für kommerzielle und industrielle Energiespeicher im Juli 2026 ist keine neue Chance – er ist eine etablierte, sich schnell entwickelnde Infrastrukturklasse mit festgelegten Compliance-Anforderungen, anspruchsvollen Kundenerwartungen und strenger finanzieller Prüfung. Die für dieses Jahr prognostizierten Installationen von 12,4 GWh werden die installierte Basis verdoppeln, und die regulatorische Maschinerie ist nun auf ein anhaltendes Wachstum von 24 GWh bis 2028 kalibriert. Die europäische Dreiervereinbarung zur Energiespeicherung hat die von Investoren geforderte politische Sicherheit geboten. Die TURPE 7-Reform in Frankreich, die dynamischen Tarifvorgaben in Deutschland, die 15-minütige Marktabrechnung und der neue Rahmen für die Einhaltung von Versicherungsbestimmungen schaffen zusammen ein Marktumfeld, in dem qualitativ hochwertige Geräte, ordnungsgemäß zertifiziert und intelligent gesteuert, überzeugende risikobereinigte Renditen liefern.
Die Herausforderungen sind ebenso klar: Die Versicherbarkeit ist das neue Tor; Engpässe beim Netzanschluss bestrafen verzögerte Projektdurchführung; und die Forderung des CFO nach nachprüfbaren Renditen lässt keinen Spielraum für vage Versprechungen. Erfolg in diesem Markt erfordert einen Partner, der werkseitig zertifizierte, von Versicherern akzeptierte Produkte liefert; der die obskuren Details von VDE, G99, TURPE und BS 7671 versteht; und der die Produktvielfalt bietet, die zur Anwendung passt – von einem 100-kW-Flüssigkühlung-Außenschrank für ein Logistikzentrum in Italien über eine 500-kW-Hybrid-Solaranlage für eine Fabrik in Deutschland bis hin zu einem 5-MWh-Flüssigkühlung-Containerblock für einen Rechenzentrum-Campus in den Niederlanden.
MateSolar ist dieser Partner. Als Anbieter von umfassenden Photovoltaik- und Energiespeicherlösungen kombiniert MateSolar tiefgreifendes Produktdesign, europäische Normenkompetenz und ein Engagement für technischen Support, der die Realität des Betriebs unserer Kunden berücksichtigt. Unsere Produktpalette – vom kommerziellen 500-kW-Hybrid-Solar-System über das 100-kW/232-kWh bzw. 125-kW/261-kWh Flüssigkühlungs-Außenkabinett-Energiespeichersystem bis hin zum 40-Fuß-1-MWh-2-MWh-Luftkühlungs-Container-ESS-Energiespeichersystem und dem 20-Fuß-3-MWh-5-MWh-Flüssigkühlungs-Container-Energiespeichersystem – deckt das gesamte Leistungs- und Energiespektrum des C&I-Marktes ab. Jedes Produkt ist von Grund auf für europäische Netzbedingungen konzipiert, nach den neuesten Versicherungs- und Sicherheitsstandards zertifiziert und wird durch eine Remote-Support-Infrastruktur unterstützt, die den Betrieb der Systeme auf höchstem Niveau gewährleistet.
Ob Sie als CFO die erste Investition in Energiespeicher prüfen, als EPC-Auftragnehmer einen zuverlässigen Ausrüstungspartner für eine Projektpipeline suchen oder als Facility Manager für die Geschäftskontinuität und die Kontrolle der Energiekosten verantwortlich sind, wir laden Sie ein, sich mit unserem technischen Vertriebsteam für eine detaillierte, standortspezifische Analyse in Verbindung zu setzen. Die Wirtschaftlichkeit ist überzeugend. Der Weg zur Einhaltung der Vorschriften ist klar definiert. Die Technologie ist ausgereift. Jetzt ist die Zeit für den Einsatz.
MateSolar – Anbieter für Photovoltaik- und Energiespeicherlösungen aus einer Hand.