

















Fecha: 10 de julio de 2026
Categoría: Almacenamiento de energía, Comercial e industrial, Inteligencia de mercado
Tiempo de lectura: 38 minutos
Resumen ejecutivo
El mercado europeo de almacenamiento de energía comercial e industrial (C&I) no solo está creciendo, sino que está experimentando una aceleración estructural que redefinirá cómo las empresas consumen, gestionan y monetizan la electricidad durante décadas. A partir de julio de 2026, la confluencia de cambios regulatorios, inestabilidad de la red, reforma arancelaria, endurecimiento de la asegurabilidad y maduración tecnológica ha elevado el almacenamiento de energía de una herramienta discrecional de gestión de energía a un activo innegociable en el balance de las empresas.
Los datos recién publicados confirman que las instalaciones anuales de almacenamiento en el sector comercial e industrial (C&I) en toda Europa alcanzarán los 12,4 GWh en 2026, lo que supone duplicar la cifra respecto al año anterior. El Acuerdo Tripartito de la UE sobre Almacenamiento de Energía, firmado en junio de 2026 por la Comisión Europea, los operadores de redes de transporte y las asociaciones del sector, establece una trayectoria vinculante que va de los 9 GWh en 2026 a los 24 GWh en 2028 —un aumento del 167% que convierte al sector C&I; el segmento de almacenamiento de más rápido crecimiento en términos porcentuales.
Sin embargo, este crecimiento explosivo esconde un panorama de inmensa complejidad. Las aseguradoras han endurecido drásticamente los criterios de suscripción tras la feria Intersolar 2026, lo que hace que los activos no certificados ya no sean financiables. La reforma tarifaria francesa TURPE 7 entrará en vigor en agosto, reescribiendo la lógica de las tarifas de red en 3.000 zonas tarifarias. El cambio a intervalos de liquidación de 15 minutos en los mercados diarios de la UE significa que las estrategias de control por horas heredadas están dejando de aprovechar hasta un 3% de la TIR de los proyectos. Las colas de conexión a la red en Alemania, los Países Bajos y Bélgica se alargan hasta los 8 meses para proyectos de más de 500 kWh, mientras que las baterías de iones de sodio están abriendo un nuevo debate sobre el coste total de propiedad que cuestiona los supuestos vigentes sobre las baterías de iones de litio.
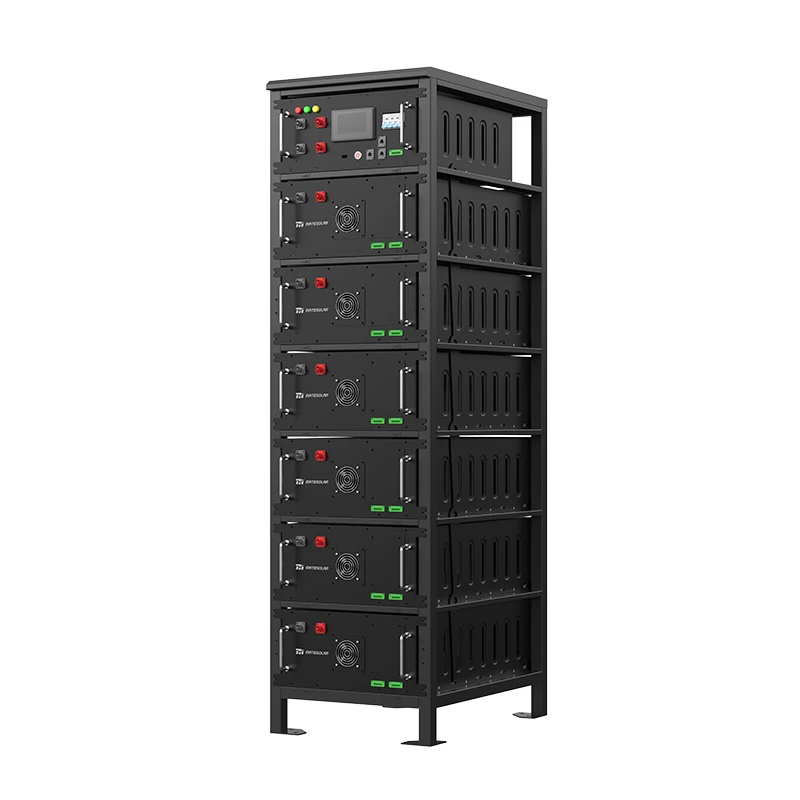
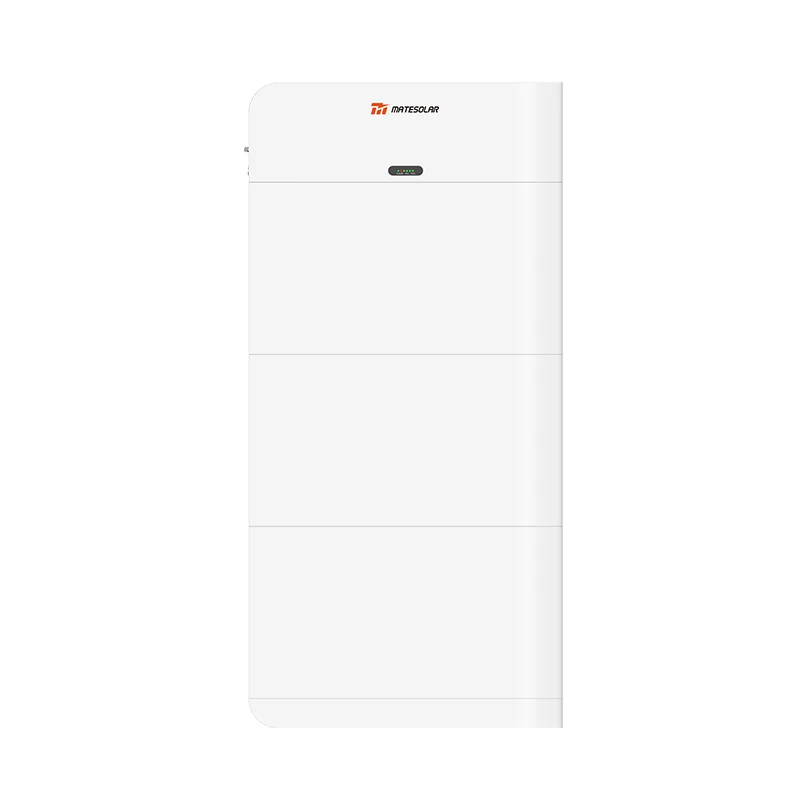
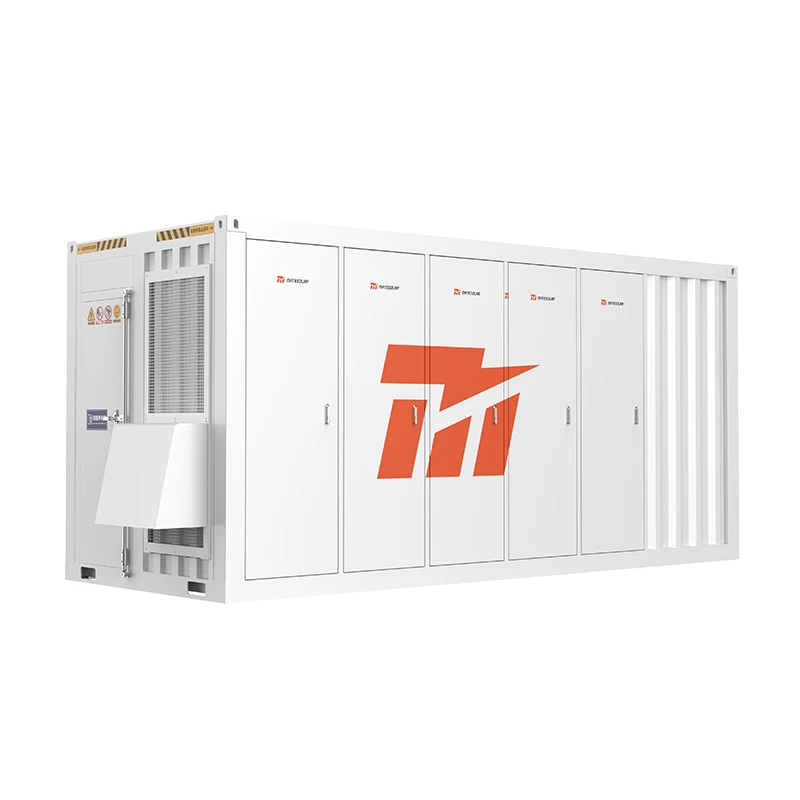
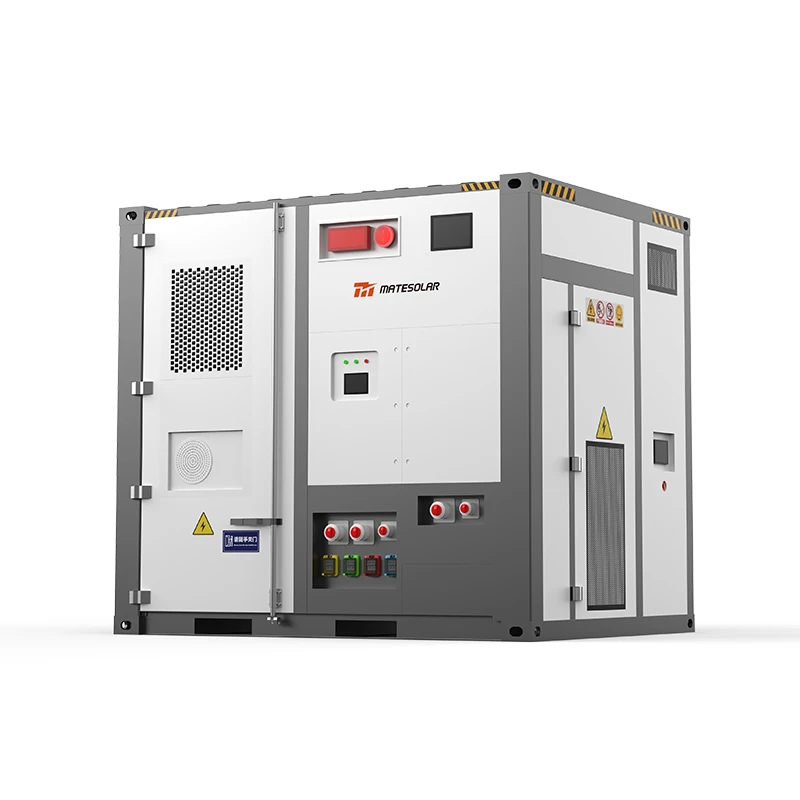
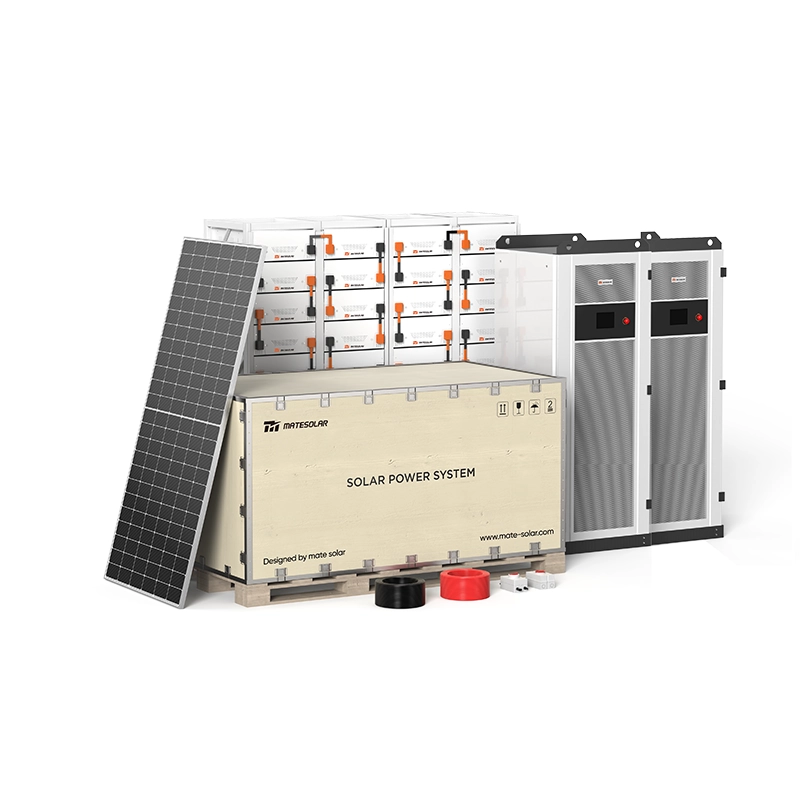
Esta guía —investigada y redactada por el equipo de inteligencia energética de MateSolar— sintetiza los fundamentos del mercado, las dinámicas de los segmentos de productos y las siete preguntas más urgentes de los clientes que dan forma a las decisiones de adquisición en este momento. Está diseñada para servir como el documento de referencia definitivo para gerentes de energía comerciales, desarrolladores de proyectos, directores financieros, aseguradoras y contratistas EPC que navegan por el mercado europeo de almacenamiento de 2026. Cada sección se basa en datos primarios, textos regulatorios y experiencia de proyectos sobre el terreno. Cuando procede, conectamos desafíos técnicos específicos con las arquitecturas de productos que los resuelven, incluyendo el Sistema Solar Híbrido Comercial de 500 KW de MateSolar, el Sistema de Almacenamiento de Energía en Gabinete Exterior Refrigerado por Líquido de 100 kW/232 kWh y 125 kW/261 kWh, el Sistema de Almacenamiento de Energía ESS en Contenedor Refrigerado por Aire de 40 pies y 1 MWh/2 MWh, y el Sistema de Almacenamiento de Energía en Contenedor de Refrigeración Líquida de 20 pies de 3 MWh/5 MWh.
Al finalizar la sección, los directores financieros (CFO) tendrán un marco de TIR (Tasa Interna de Retorno) verificable, los ingenieros de proyectos comprenderán los nuevos protocolos de pruebas de incendios requeridos por los seguros, y los gerentes de compras podrán comparar gabinetes exteriores refrigerados por líquido con arquitecturas contenerizadas con precisión cuantitativa. Comenzamos con las fuerzas fundamentales que están remodelando el mercado.
1. Fundamentos del mercado: Por qué 2026 es el año de inflexión para el almacenamiento C&I en Europa
1.1 Los números que definen la oportunidad
El mercado europeo de almacenamiento C&I ha estado históricamente rezagado con respecto a los segmentos a escala de servicios públicos y residenciales, tanto en volumen como en atención política. Esa era ha terminado. La Tabla 1 resume las métricas clave del mercado que cada parte interesada debe internalizar.
Tabla 1: Fundamentos del Mercado Europeo de Almacenamiento de Energía C&I, 2024–2028
| Métrica | 2024 (Actual) | 2025 (Estimado) | 2026 (Pronóstico) | 2028 (Objetivo) | Fuente / Notas |
| Instalaciones anuales de almacenamiento C&I (GWh) | 4.2 | 6.1 | 12.4 | 24.0 | Trayectoria del Acuerdo Tripartito de la UE, EASE, SolarPower Europe |
| Tasa de crecimiento interanual | / | 45% | 103% | ~39% Tasa de crecimiento anual compuesto (CAGR) | Derivado de lo anterior |
| Almacenamiento C&I instalado acumulado (GWh) | 9.8 | 15.9 | 28.3 | ~62 | Acumulación progresiva |
| Tasa de conexión de C&I solar (almacenamiento por capacidad fotovoltaica) | ~8% | ~10% | ~14% | ~22% | SolarPower Europe Rastreador FV C&I |
| Oportunidad acumulada de modernización (GWh de sitios fotovoltaicos sin almacenamiento) | 38 | 42 | 46 | / | Según el 90% de C&I; las instalaciones fotovoltaicas siguen sin estar emparejadas |
| Precio medio de la electricidad comercial (€/MWh, ponderado UE) | 152 | 168 | 175 | / | Eurostat, Platts; refleja mayorista + red + impuestos |
| Prima del precio de la electricidad de las PYME alemanas frente a la gran industria | +52% | +56% | +58.6% | / | BDEW, Destatis; PYME definida como <2 GWh de consumo anual |
| Número de sitios C&I con carga pico de >100 kW en la UE-27 | 2.1 millones | 2,2 millones | 2.3 millones | / | Análisis del parque de edificios de la UE |
| Retraso en la conexión a la red para proyectos de >500 kWh (meses, DE/NL/BE) | 2–3 | 3–5 | 4–8 | / | Entrevistas primarias con DNOs, desarrolladores |
Fuentes: JRC de la Comisión de la UE, EASE 2026 Market Monitor, Grupo de Trabajo de C&I de SolarPower Europe, presentaciones regulatorias nacionales. Análisis de MateSolar.
La cifra de 12,4 GWh para 2026 no es una extrapolación lineal de las tendencias anteriores. Refleja el primer año completo de operación de múltiples impulsores estructurales que eran incipientes o estaban ausentes en 2024-2025. Pasaremos a esos impulsores a continuación.
1.2 Conductor Estructural Uno: Tasas de Adhesión de Almacenamiento Ultrabajas
En toda la UE-27, actualmente hay aproximadamente 90% de sistemas fotovoltaicos comerciales e industriales en funcionamiento sin almacenamiento específico «behind-the-meter». La capacidad fotovoltaica acumulada instalada en tejados comerciales e industriales supera los 65 GWp a mediados de 2026. Si estos sistemas se modernizaran con una relación típica de 1:1 en corriente continua (1 kWh de almacenamiento por cada 1 kWp de energía fotovoltaica), solo el mercado de modernización potencial superaría los 65 GWh, más de cinco veces el total acumulado de almacenamiento comercial e industrial instalado hasta la fecha.
Lo que ha cambiado en 2026 es que dos barreras que antes impedían las actualizaciones se están disolviendo: (a) el factor de forma del gabinete modular exterior ha simplificado la integración física, y (b) la industria de seguros, contraintuitivamente, ha creado una función de cumplimiento que favorece las nuevas instalaciones debidamente certificadas sobre los enfoques heredados no certificados. Abordamos ambos factores en detalle más adelante.
1.3 Conductor Estructural Dos: Elevación Persistente del Precio de la Electricidad y el Dolor de las PYMES
Los precios de la electricidad comercial en Europa han aumentado entre un 40 % y un 60% desde 2021, dependiendo del Estado miembro. Incluso tras el fin de la grave crisis energética de 2022-2023, factores estructurales —la eliminación gradual de la energía nuclear en Alemania, el bajo rendimiento del parque nuclear francés, la escalada del precio del carbono hasta superar los 110 €/tCO₂, y la escasez en el mercado del GNL— han mantenido las tarifas comerciales un 50% por encima de los niveles previos a la crisis.
Las pequeñas y medianas empresas soportan una carga desproporcionada. En Alemania, las empresas que consumen menos de 2 GWh al año pagan un precio medio total de 0,31 €/kWh, frente a los 0,195 €/kWh que pagan los grandes consumidores industriales, lo que supone un recargo del 58,61 % a partir del segundo trimestre de 2026. Esta brecha se está ampliando porque las tarifas de red, los recargos de la Ley de Energías Renovables (EEG) y los costes de equilibrio se repercuten de forma desproporcionada a los consumidores más pequeños. Para un fabricante alemán típico del Mittelstand con un consumo anual de 500 MWh, la factura eléctrica anual supera ahora los 155 000 €. Reducir esa factura entre un 50 % y un 70% mediante el autoconsumo fotovoltaico y la reducción de picos se traduce directamente en un ahorro anual de entre 75 000 y 108 000 euros—un poderoso incentivo para los directivos que hace que el periodo de amortización estático de entre 3,5 y 4,5 años en Alemania resulte inmediatamente atractivo.
1.4 Conductor Estructural Tres: Fragilidad de la Red Eléctrica como Llamada de Atención
El 24 de julio de 2025, una perturbación de frecuencia en cascada originada en la red de transmisión española provocó un apagón de más de 50 millones de personas en la Península Ibérica y partes del sur de Francia. El evento, causado por una combinación de baja inercia del sistema durante un período de alta penetración de energías renovables y una descoordinación de relés de protección, fue el apagón más grave de Europa desde 2003. Los daños económicos superaron los 6.000 millones de euros, y el análisis posterior al evento reveló que los activos de almacenamiento distribuido podrían haber proporcionado reservas críticas de contención de frecuencia que podrían haber detenido la cascada.
El apagón de España en 2025 puso de manifiesto un cambio que llevaba años produciéndose: en una red con una penetración instantánea de energías renovables del 55%+, ya no se puede confiar en la inercia síncrona de las centrales térmicas. El almacenamiento es la única fuente técnicamente viable de respuesta rápida en frecuencia a gran escala. Para los clientes del sector comercial e industrial (C&I), esto significa que los cortes en la red ya no son riesgos extremos teóricos, sino una amenaza operativa estadísticamente recurrente. El sector de los seguros ha respondido ajustando las primas de las pólizas de interrupción de la actividad empresarial para aquellas empresas que carecen de energía de reserva, al tiempo que ha endurecido las condiciones de cobertura para los propios activos de almacenamiento —una dinámica dual que analizamos en el Tema Uno—.
En consecuencia, el almacenamiento ha sido recategorizado en la sala de juntas de una “opción de optimización de costos energéticos” a un “requisito de continuidad del negocio”. Este cambio de mentalidad es el cambio cualitativo más importante en el mercado de 2026.
1.5 Impulsor Estructural Cuatro: La Arquitectura de la Política es Ahora Permanente y Basada en el Mercado
Anteriormente, el crecimiento del almacenamiento en Europa dependía en gran medida de las subvenciones directas de capital: el «Superbonus 110%» italiano, diversos programas regionales alemanes y las primeras licitaciones de almacenamiento en Grecia. Si bien estos programas impulsaron el despliegue inicial, generaron ciclos de auge y caída y no lograron crear un modelo económico autosuficiente.
El panorama político de 2026 es fundamentalmente diferente. El Acuerdo Tripartito de Almacenamiento de Energía de la UE, firmado el 3 de junio de 2026 entre la DG ENER, ENTSO-E, la Federación Bancaria Europea y la industria del almacenamiento, compromete a los estados miembros a implementar una cesta de mecanismos de ingresos basados en el mercado para el primer trimestre de 2027:
- Tarifas de red dinámicas ese almacenamiento de recompensas para aliviar la congestión (vivirá en Francia a partir de agosto de 2026, pilotado en los Países Bajos y Bélgica).
- Mecanismos de remuneración de la capacidad accesible a almacenamiento agregado detrás del medidor, con contratos a 15 años en Francia a partir de noviembre de 2026 y programas similares en avance en Italia y Polonia.
- Exención o reducción significativa de la doble imposición (pagando los cargos de red tanto en importación como en exportación) para almacenamiento, armonizado en toda la UE para 2027.
- Conexión a la red simplificada para sistemas de menos de 200 kW, con la obligación vinculante para los operadores de redes de distribución de tramitar las solicitudes en un plazo de 2 meses.
Lo más importante es que estos mecanismos mejoran las tasas internas de rentabilidad (TIR) de los proyectos en 2-3 puntos porcentuales en comparación con los modelos de arbitraje basados únicamente en la energía, lo que hace que muchos proyectos pasen de ser apenas rentables (TIR sin apalancamiento de 5–7%) a ser claramente financiables (TIR sin apalancamiento de 8–10%). El paso de la dependencia de las subvenciones a la acumulación de ingresos basada en el mercado es lo que justifica la trayectoria de crecimiento de 167% hasta 2028.
2. Tres segmentos de producto que están remodelando el mercado
El término “almacenamiento C&I” abarca un conjunto heterogéneo de arquitecturas de productos, clases de potencia y casos de uso. Han surgido tres segmentos distintos, cada uno con su propia trayectoria tecnológica, dinámicas competitivas y requisitos del cliente.
2.1 Segmento uno: BESS a escala comercial (100 kWh a 2 MWh)
Este es el segmento de mayor crecimiento y mayor demanda por volumen de unidades. Está dirigido a fábricas, centros logísticos, parques comerciales, centros de datos, operaciones agrícolas, hoteles y edificios municipales. Las características unificadoras son la operación "detrás del medidor", la optimización del autoconsumo fotovoltaico, la gestión de los cargos por demanda máxima y el arbitraje por horas de uso.
Fragmentación de Clase de Poder
El mercado se ha consolidado en torno a dos nodos de poder dominantes:
- 100–125 kWEste es el punto óptimo para sitios comerciales medianos y de industria ligera. Se alinea con clústeres de baterías de alto voltaje de 1000V y 1500V, se interconecta limpiamente con conexiones de red de 125A–160A, y se adapta a las restricciones de espacio estándar de las salas eléctricas o exteriores. El equipo de esta clase implementa típicamente entre 200 kWh y 400 kWh de almacenamiento por bloque de energía, escalando hasta ~1 MWh con gabinetes paralelos.
- 50-60 kWEsta clase está dirigida a pequeñas empresas, granjas y sitios distribuidos donde el perfil de carga no justifica el factor de forma mayor. A menudo se integra con cuadros de distribución de baja tensión de 400 V y requiere procedimientos de instalación simplificados. En Italia y España, los sistemas de 50–60 kW dominan debido a la prevalencia de pequeñas unidades de fabricación.
El umbral de 1 MWh en un solo gabinete
Una clara tendencia de producto en 2026 es la aparición del sistema de almacenamiento de energía de 1 MWh en un solo gabinete. Históricamente, para lograr 1 MWh se requería paralelizar múltiples gabinetes, lo que multiplicaba el número de puntos de interconexión, nodos de comunicación y modos de falla potenciales. Los nuevos gabinetes integrados de 700 kWh a 1,2 MWh ahora condensan toda la pila de baterías de CC, el sistema de gestión de baterías, la gestión térmica y la supresión de incendios en una sola carcasa exterior. Los beneficios no son triviales:
- Reducción del espacio ocupado por 35–50% en comparación con las arquitecturas de múltiples armarios.
- Costos reducidos del balance del sistema (BOS): menos cajas combinadoras de CC, menos pasarelas de comunicación, menos zanjas.
- Permisos e inspección de incendios simplificados: una sola unidad con un único informe de prueba UL 9540A (que cubre la configuración a nivel de sistema) es mucho más fácil de suscribir que una instalación compuesta.
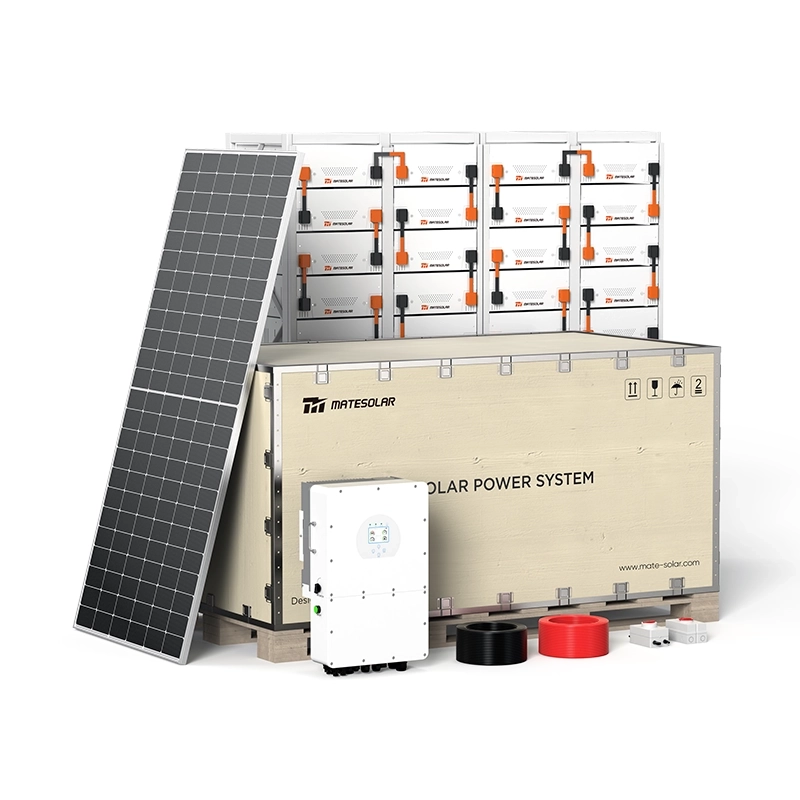
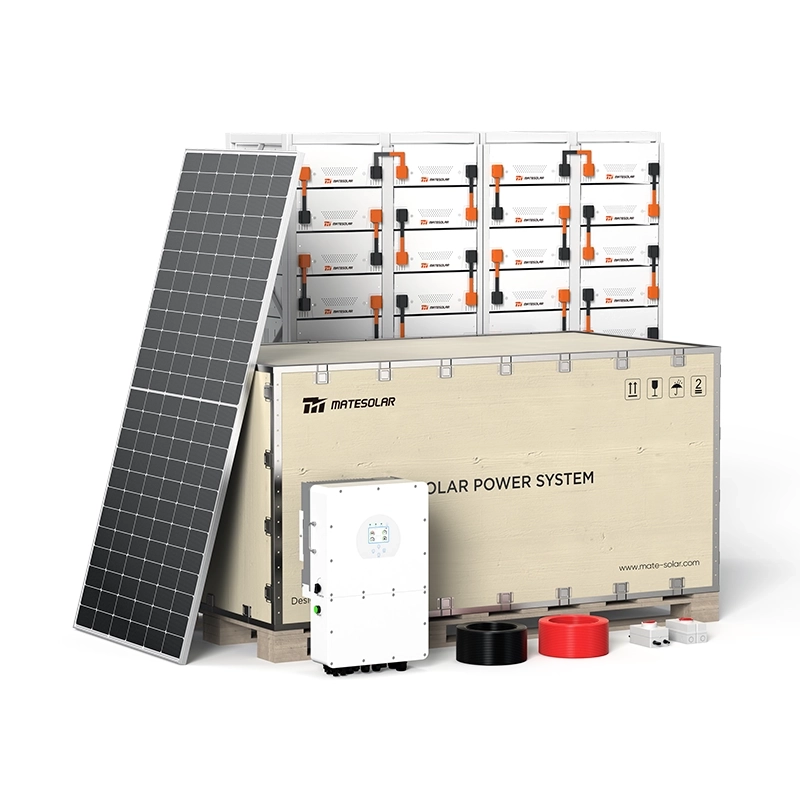
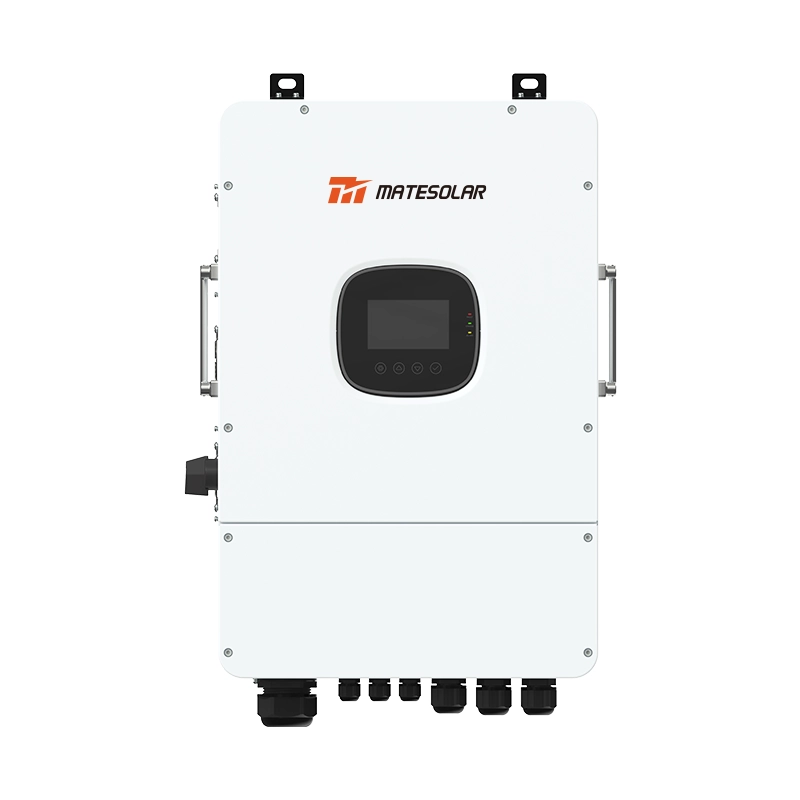
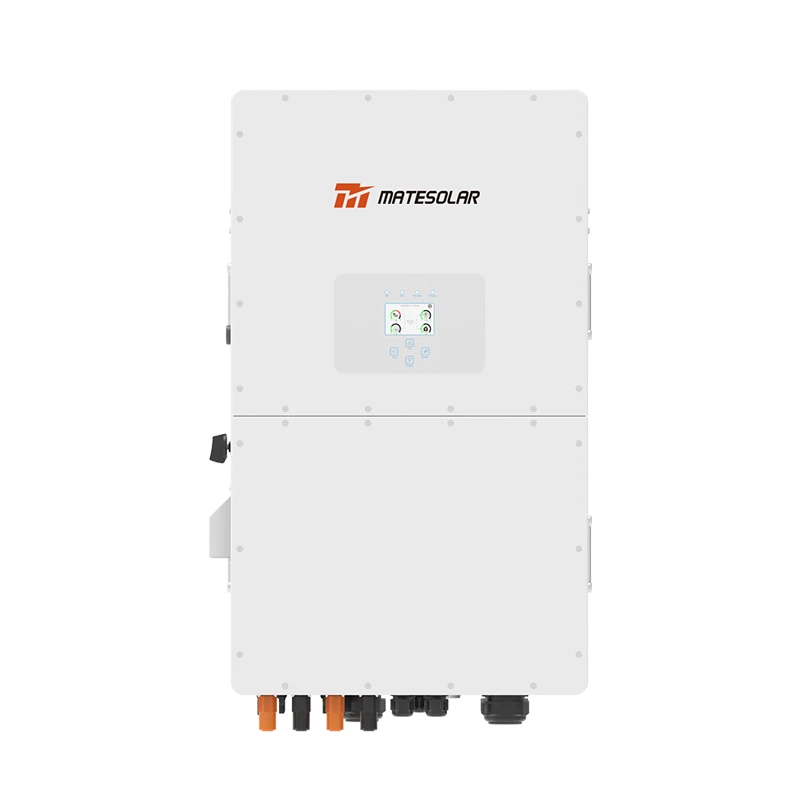
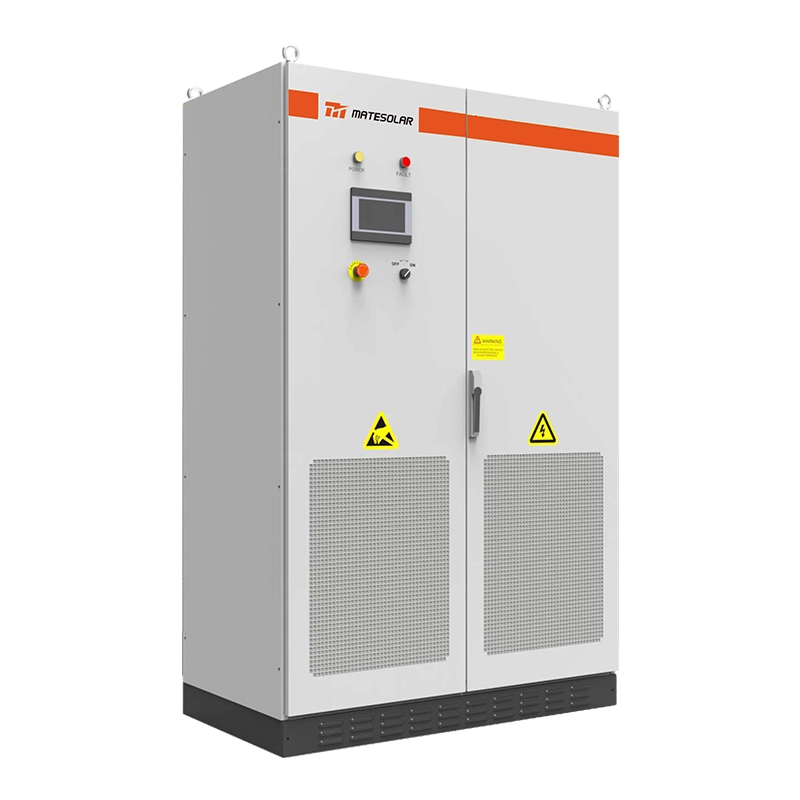
Para sitios que integran fotovoltaica, la capacidad del inversor a menudo se obtiene por separado. Una combinación potente observada en múltiples instalaciones de 2026 es la unión de un gabinete exterior de 1 MWh con un inversor híbrido de 500 kW, una configuración que maximiza el autoconsumo y conserva la capacidad de exportación a la red. Un ejemplo de dicha plataforma es el Sistema Solar Híbrido Comercial de 500 kW de MateSolar, diseñado para aplicaciones C&I de alta eficiencia que requieren una integración perfecta de fotovoltaica y almacenamiento.
Modelo Económico para el Usuario Final
La lógica dominante de acumulación de valor en 2026 combina cuatro flujos de ingresos y ahorros:
1. Autoconsumo fotovoltaico aumentoDesplazamiento de la generación solar de la exportación al mediodía (a menudo a precios mayoristas bajos o negativos) al consumo vespertino. En Alemania, esto por sí solo puede mejorar el valor de la generación solar en 0,08–0,12 €/kWh.
2. Reducción de picos / gestión de cargos por demanda: Las tarifas comerciales en la mayoría de los países de la UE incluyen un cargo por capacidad (€/kW al mes o al año) basado en la demanda media más alta registrada en un periodo de 15 minutos. Un sistema de almacenamiento que limite la demanda máxima puede reducir este cargo entre un 30 % y un 60%. Esto tiene un impacto especialmente significativo en España, Italia y Francia, donde los cargos por demanda pueden suponer entre el 25 % y el 40% de la factura total.
3. Arbitraje de energía por tiempo de uso: Carga durante períodos de bajo precio (noche, excedente solar de mediodía) y descarga durante períodos de alto precio (picos de la mañana y de la tarde). Con intervalos de liquidación de mercado de 15 minutos ahora estándar, los diferenciales de precios intradía son totalmente explotables.
4. Participación en servicios auxiliares (donde la regulación lo permita): Cada vez se permite más que los activos agregados detrás del medidor pujen en los mercados de reserva de contención de frecuencia (FCR) y reserva automática de restauración de frecuencia (aFRR), generando ingresos adicionales de entre 20 y 50 €/kW-año, dependiendo del país.
El resultado neto en los mercados centrales:
- Alemania y Reino Unido: periodo de amortización estático de entre 3,5 y 4,5 años; TIR sin apalancamiento, normalmente entre el 12 y el 15%.
- Italia y España: 5-6 años, IRR 9-12%.
- Países Bajos: 8–10 años sin subsidios, lo que refleja bajos diferenciales de chispa y cargos por demanda limitados. Este mercado todavía depende de la evitación de tarifas máximas de la red y es muy sensible a los calendarios de eliminación gradual de la medición neta.
2.2 Segmento Dos: Almacenamiento de Gabinete Exterior Todo en Uno (Refrigerado por Líquido, Integrado)
El gabinete exterior integrado se ha convertido en el factor de forma física dominante para el almacenamiento C&I en Europa y representa la categoría de productos en la que los fabricantes chinos, como MateSolar, gozan de la posición competitiva más fuerte. La propuesta de valor es sencilla: un solo SKU que contiene baterías de CC, PCS (sistema de conversión de energía), BMS, HVAC/refrigeración y extinción de incendios, que solo requiere conexión a la red de CA y una interfaz de comunicación para comenzar a operar.
Evolución del producto en 2026
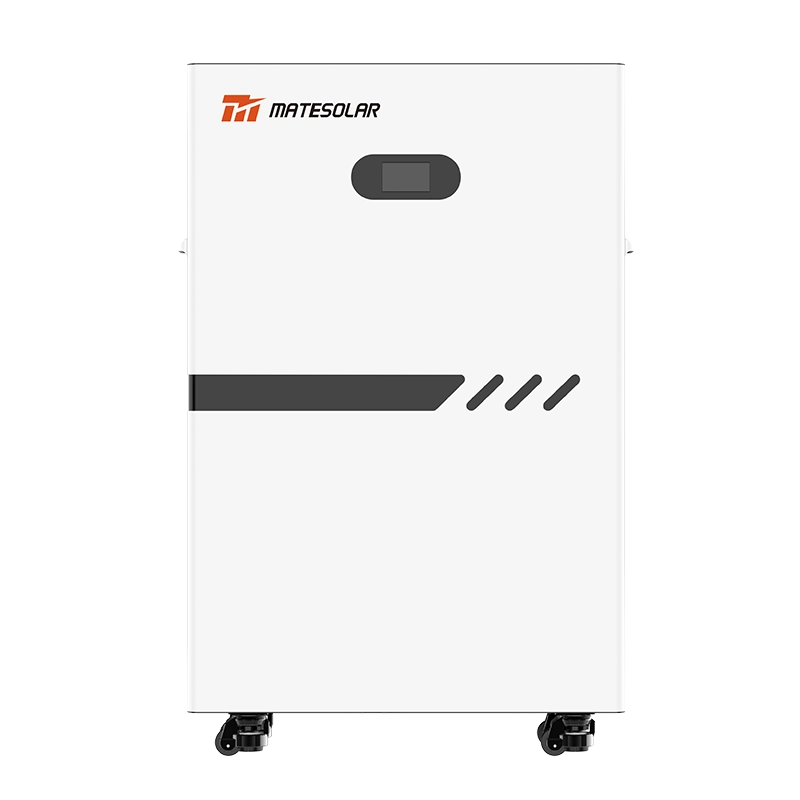
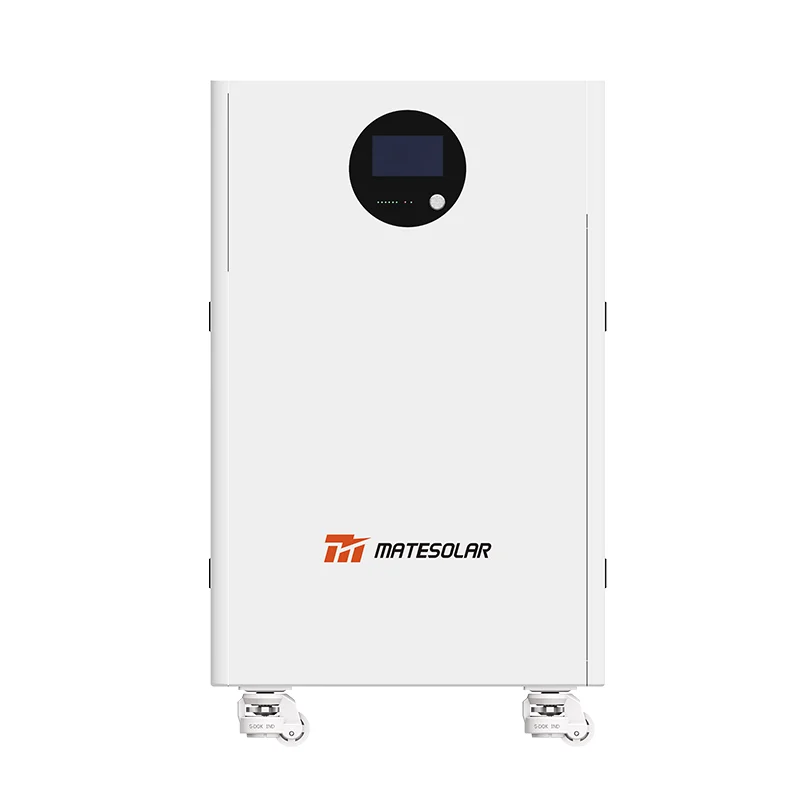
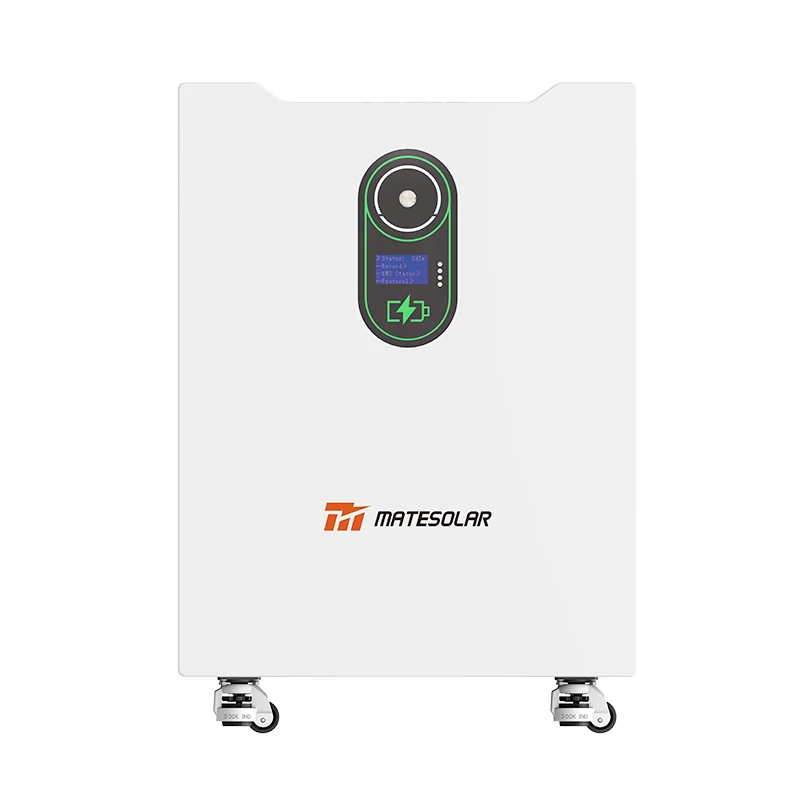
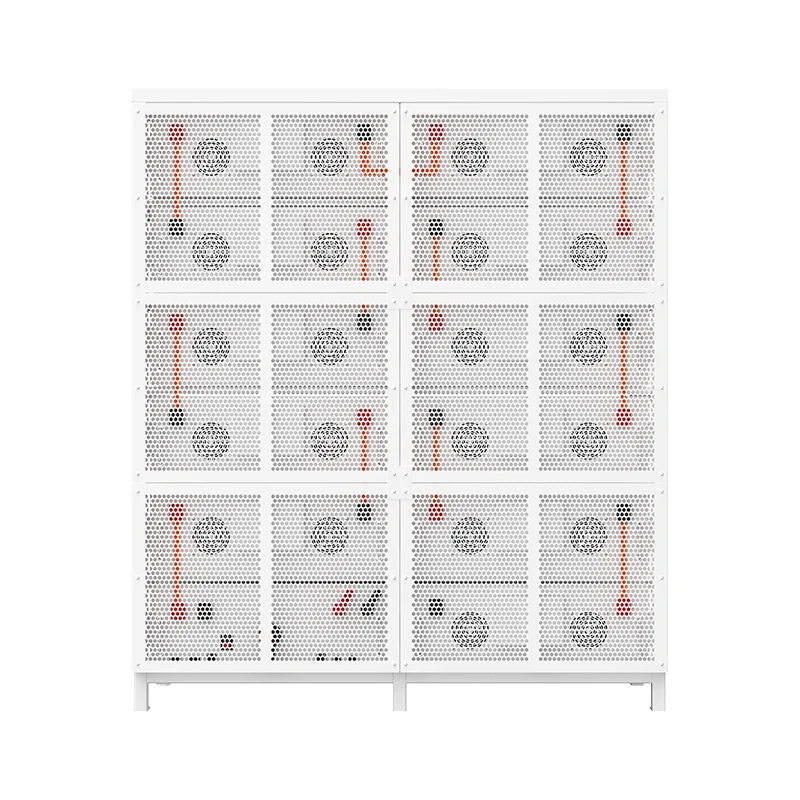
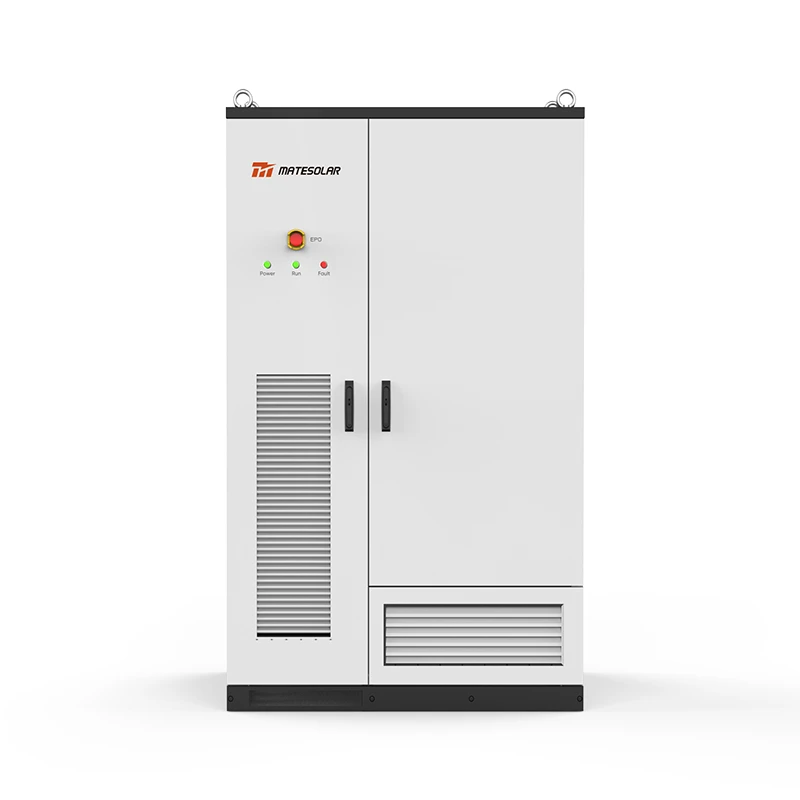
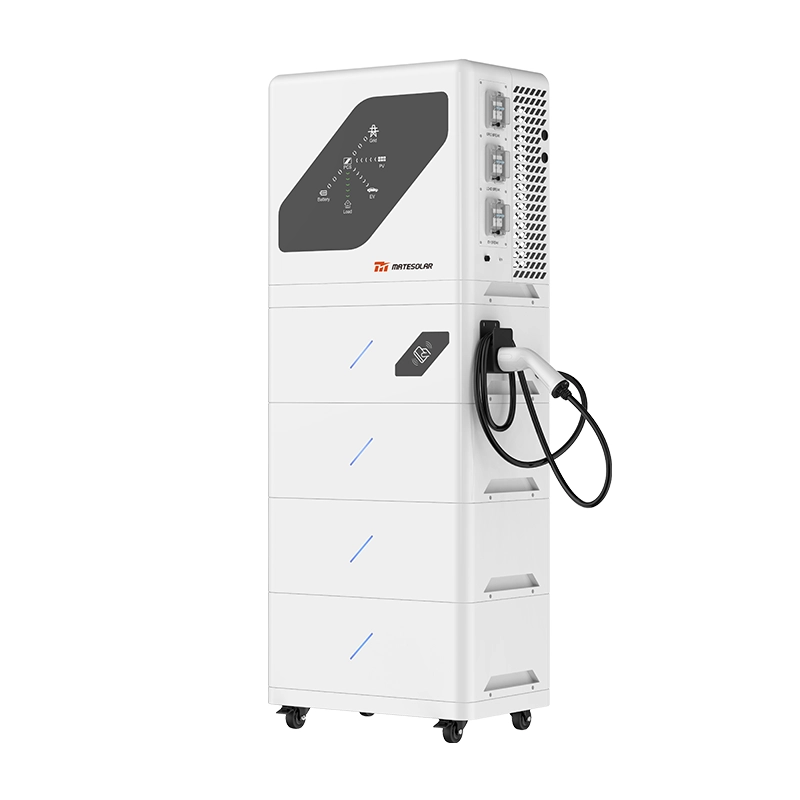
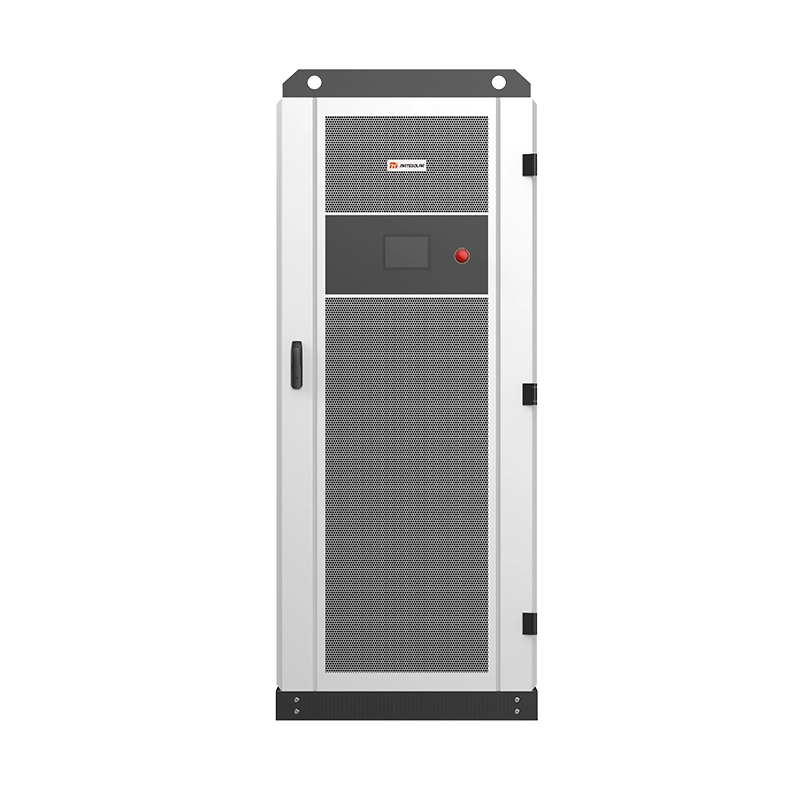
- Mayor densidad de integración: La integración de AC-DC dentro de un solo gabinete ha pasado de ser un diferenciador a un requisito básico. Los sistemas más avanzados en el segmento de 100-125 kW ahora entregan 232-261 kWh en una huella de un solo gabinete de menos de 1.6 m². El Sistema de Almacenamiento de Energía en Gabinete Exterior Refrigerado por Líquido de 100 kW/232 kWh y 125 kW/261 kWh de MateSolar ejemplifica esta clase: un recinto completamente integrado, refrigerado por líquido y clasificado para exteriores, diseñado para un despliegue rápido en sitios comerciales con restricciones.
- Refrigeración líquida como el nuevo estándar: La refrigeración pasiva y la de aire forzado ya no son competitivas con las densidades energéticas de las celdas que prevalecen actualmente (celdas prismáticas de LFP de 280 Ah y 314 Ah, con una tendencia cada vez mayor hacia formatos “jelly roll” de 560 Ah o más). Las placas de refrigeración líquida mantienen los diferenciales de temperatura entre celdas dentro de un margen de 2-3 °C, frente a los 8-12 °C de la refrigeración por aire forzado, lo que repercute directamente en la vida útil y la seguridad. Se prevé que la tasa de crecimiento anual compuesta de los armarios para exteriores con refrigeración líquida se sitúe entre el 18 % y el 221 TP3T hasta 2030, impulsada por unos requisitos de mayor número de ciclos y unas condiciones de garantía más estrictas.
- Escalabilidad modularLa capacidad de comenzar con 100 kW / 230 kWh y luego paralelizar gabinetes adicionales hasta 500 kW / 1.15 MWh sin rediseñar la infraestructura eléctrica del sitio es un argumento de venta decisivo. Reduce el desembolso inicial de capital y permite a los clientes adaptar la expansión de la capacidad al crecimiento real de la carga o a la evolución de las tarifas.
- Cumplimiento del código europeo como una característica preintegradaEl coste y la penalización en los plazos de adaptación de la conformidad con CE, IEC 62933, VDE-AR-N 4110 y UK G99 a un sistema no diseñado para Europa es prohibitivo. Los principales proveedores envían ahora con estas certificaciones integradas en la fase de diseño del producto. Los clientes deben verificar, como mínimo: (1) marcado CE según la Directiva de Baja Tensión y la Directiva EMC; (2) certificación de seguridad IEC 62619 para las celdas y módulos de la batería; (3) IEC 62933-5-2 para el sistema integrado; y (4) certificados de cumplimiento del código de red para el país de destino, específicamente VDE-AR-N 4110 en Alemania, G99 en el Reino Unido, CEI 0-21 en Italia y RD 647 en España. Los sistemas que carecen de estos certificados se enfrentan no solo a barreras de acceso al mercado, sino que, a partir de julio de 2026, a un rechazo total del seguro.
Tabla 2: Comparación de configuraciones de gabinetes exteriores comunes en el mercado europeo C&I de 2026
| Parámetro | 100 kW / 232 kWh | 125 kW / 261 kWh | 200 kW / 418 kWh (paralelo) | Observaciones |
| Huella (m²) | 1.4–1.6 | 1.5–1.8 | 2.8–3.2 | Crítico para sitios comerciales urbanos |
| Método de enfriamiento | Líquido (mezcla de glicol y agua 50%) | Líquido | Líquido | Celda ΔT <3°C |
| Eficiencia de ida y vuelta (CC, sistema) | 90–91% | 90–91% | 89–91% | Medido a carga de 0.5C / descarga de 1C |
| Voltaje de CA | 400V trifásico | 400V trifásico | 400V trifásico | Compatible con placas LV estándar |
| Cumplimiento del código de red | Normas VDE-AR-N 4110, G99, CEI 0-21 | Igual | Igual | Variantes de firmware específicas del país |
| Supresión de incendios | Aerosol + niebla de agua + ventilación activa | Aerosol + neblina de agua | Independiente por gabinete | Debe cumplir la prueba a nivel de unidad UL 9540A |
| Comunicación | Modbus TCP, IEC 61850, MQTT-SN | Igual | Igual | MQTT-SN para alarma remota de huida térmica (IEC 63241-2) |
| Tiempo de instalación (en el sitio) | 1–2 días | 1–2 días | 2–3 días | Excluye obras civiles y conexión a la red |
Nota: Las especificaciones son representativas del nivel de producto premium 2026. La serie de gabinetes para exteriores de MateSolar cumple o excede estos puntos de referencia; las hojas de datos detalladas están disponibles bajo petición.
El segmento de gabinetes exteriores es donde la velocidad de implementación y la asegurabilidad se cruzan con mayor agudeza. Debido a que estos sistemas están integrados y probados en fábrica, admiten intrínsecamente las pruebas completas de incendio a gran escala a nivel de sistema (LSFT) que las aseguradoras exigen ahora. En contraste, los sistemas multi-componentes ensamblados en el sitio requieren costosas pruebas in situ o caen en una zona gris de suscripción. Esta dinámica se explora de manera integral en el Tema Uno.
2.3 Segmento Tres: Proyectos Solares-Almacenamiento Comerciales e Industriales a Gran Escala (Escala MWh, Contenedorizados)
Por encima de la escala de 2 MWh, el mercado transita hacia sistemas de almacenamiento de energía en contenedores. Estos proyectos dan servicio a grandes instalaciones industriales, parques logísticos, campus de centros de datos, esquemas energéticos de distrito y, cada vez más, a agregaciones comerciales conectadas a la red.
El año 2026 será el primero en el que el almacenamiento a gran escala (del lado de la red, normalmente >10 MW) supere los 30% del total de instalaciones de almacenamiento en Europa, con nuevas incorporaciones de aproximadamente 13 GW, lo que supone un aumento interanual del 50%. Dentro del amplio segmento comercial e industrial (C&I), la categoría de proyectos de entre 10 MWh y 100 MWh es la más activa.
Arquitectura del producto
El módulo de construcción estándar es un contenedor ISO de 20 o 40 pies que integra baterías, PCS, gestión térmica, supresión de incendios y energía auxiliar. Dos arquitecturas de contenedores distintas dominan:
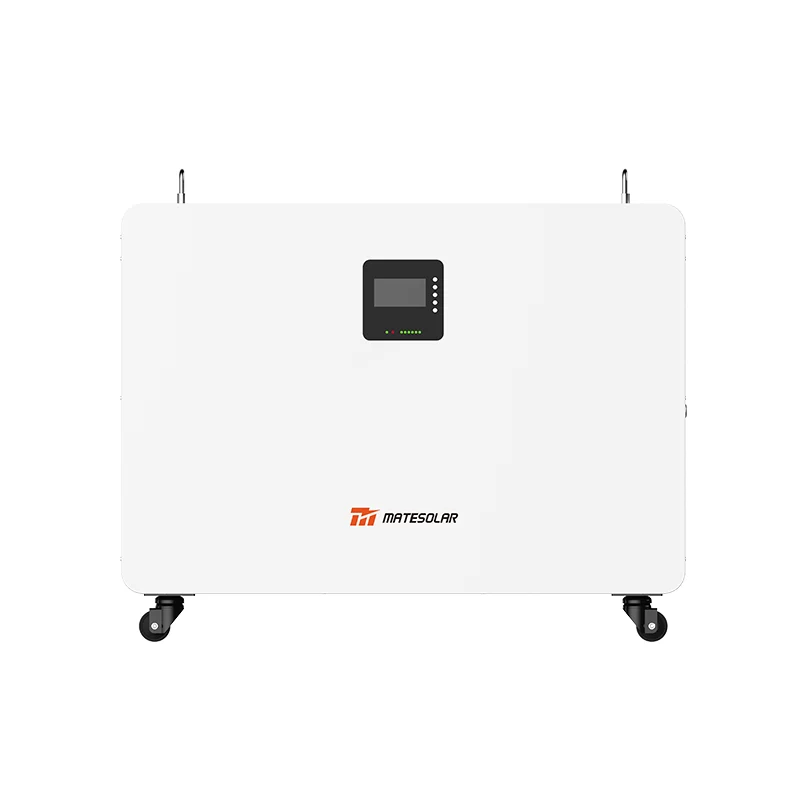
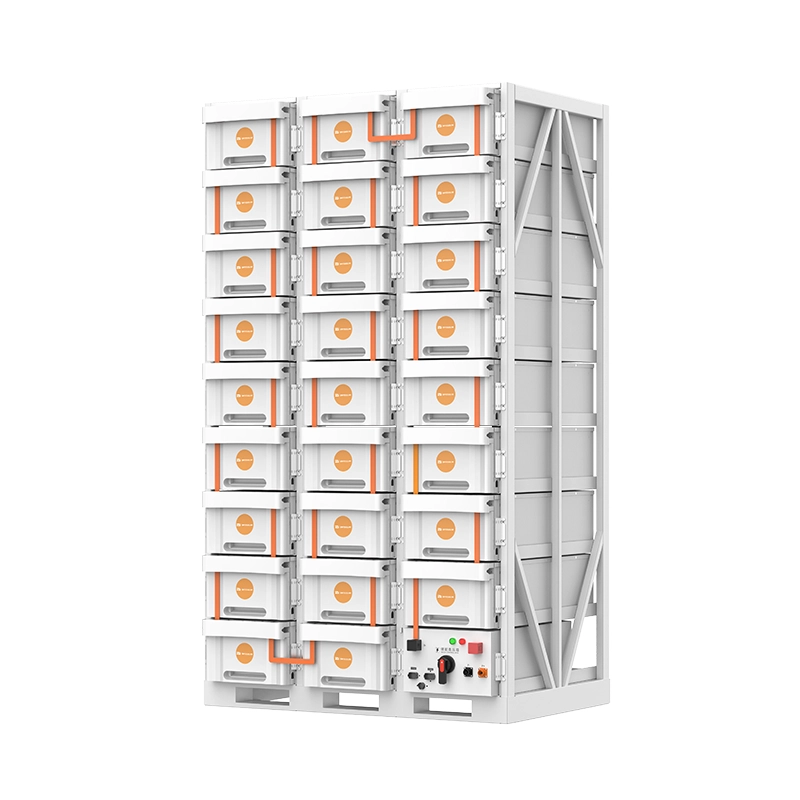
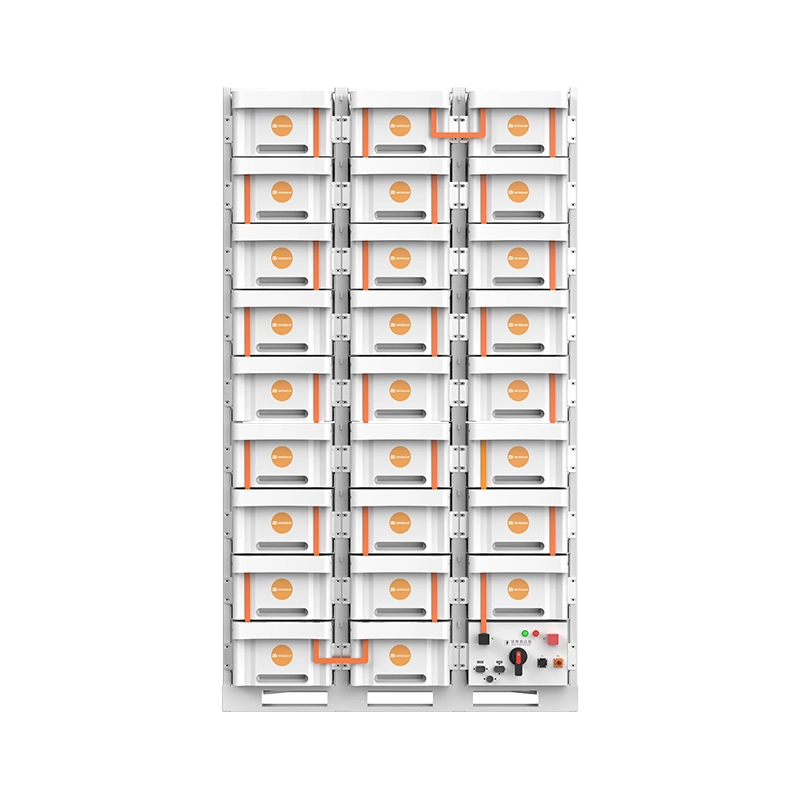
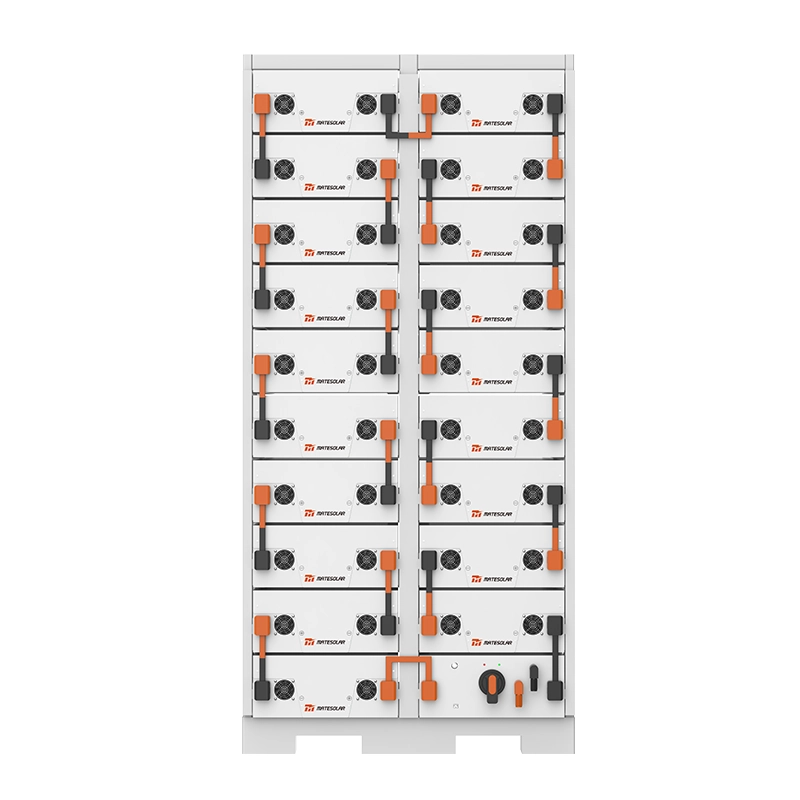
- Sistemas refrigerados por aire en contenedores en el rango de 1 a 2 MWh por contenedor de 40 pies. Estas son soluciones optimizadas en costos donde la menor densidad de energía y una gestión térmica más simple se traducen en un menor costo de capital por kWh. Se adaptan a aplicaciones con una frecuencia de ciclo modesta (1 ciclo por día) y en climas templados. El sistema de almacenamiento de energía en contenedores refrigerado por aire de 40 pies y 1 MWh/2 MWh de MateSolar está diseñado precisamente para este perfil de implementación, ofreciendo un almacenamiento de energía robusto y fácil de instalar con confiabilidad comprobada.
- Sistemas en contenedores refrigerados por líquido que proporcionan entre 3 y 5 MWh por contenedor de 20 pies. Estos sistemas de alta densidad reducen el uso del suelo entre un 50 y un 70% por MWh y disminuyen los costes de las instalaciones auxiliares, pero requieren una puesta en marcha y un mantenimiento más sofisticados. La mayor densidad energética se consigue gracias a una disposición avanzada de las celdas y a la refrigeración líquida, lo que además prolonga la vida útil. El sistema de almacenamiento de energía en contenedores de 20 pies con refrigeración líquida, de 3 MWh y 5 MWh, representa la tecnología más avanzada en 2026 para emplazamientos con gran rendimiento y limitaciones de espacio.
Complejidad del Modelo de Ingresos
Los grandes proyectos C&I (Comerciales e Industriales) y conectados a la red obtienen valor de una pila de ingresos de múltiples capas:
1. Arbitraje de energía mayoristaOperando en los mercados del día anterior y a plazo, aprovechando los intervalos de liquidación de 15 minutos. El perfil de diferencial para 2026 muestra fuertes picos vespertinos de invierno (120-180 €/MWh) y profundos valles al mediodía (0 a -50 €/MWh durante períodos de canibalización solar). Alemania registró casi 600 horas de precios mayoristas negativos en los 12 meses hasta junio de 2026, lo que presenta una oportunidad única de “cargar y recibir pago”.
2. Contratos de mercado de capacidadEn Francia, la subasta de capacidad de noviembre de 2026 adjudicará contratos a 15 años a activos de almacenamiento cualificados. El precio de liquidación del Mercado de Capacidad del Reino Unido para el año de entrega 2026-27 fue de £63/kW-año. Para un activo de 10 MW / 20 MWh, esto se traduce en £630.000 en ingresos anuales contratados.
3. Respuesta en frecuencia y servicios auxiliaresLos mercados de FCR y aFRR en Alemania, los Países Bajos y los países nórdicos ofrecen entre 20 y 50 €/kW-año. La tendencia para 2026 se dirige hacia productos de respuesta más rápida (subsegundo para FCR) que solo el almacenamiento puede proporcionar.
4. Alivio de la congestión de la redEn los Países Bajos, TenneT y las DSO regionales han lanzado plataformas de adquisición de flexibilidad donde los activos de almacenamiento reciben entre 15 y 25 €/MWh por el despacho para evitar congestión.
Riesgo de Política: Origen PCS y Acceso a Financiación de la UE
En 2026 ha surgido un importante factor diferenciador en materia de riesgo: los proyectos que utilicen sistemas de conversión de energía (PCS) no europeos no podrán optar a la financiación del Banco Europeo de Inversiones (BEI) ni a determinadas cofinanciaciones de los fondos estructurales de la UE. Esto afecta a aproximadamente 23% del mercado potencial de almacenamiento a gran escala que depende de capital subvencionado. Sin embargo, es fundamental comprender el alcance de esta restricción:
- Se aplica específicamente a los instrumentos de financiación pública de la UE (BERD, Fondo de Innovación, Mecanismo Conectar Europa).
- No se aplica a proyectos puramente comerciales e industriales "behind-the-meter", que representan la abrumadora mayoría de las instalaciones C&I.
- No restringe la operación, la conexión a la red o la participación en los ingresos en los mercados de energía.
- Los fabricantes chinos de PC están estableciendo activamente centros de ensamblaje y desarrollo de software en Europa para calificar para el estatus de “origen europeo” para 2028.
Para los clientes comerciales e industriales que implementan sistemas MateSolar, esta restricción es en gran medida irrelevante: las aplicaciones objetivo son instalaciones comerciales detrás del medidor que no dependen de la financiación pública de la UE. Sin embargo, la distinción debe confirmarse explícitamente durante la estructuración del proyecto.
Conexión a la red: el asesino oculto del cronograma
La mayor fuente de retrasos en proyectos en 2026 es la aprobación de la conexión a la red. En Alemania, la Reglamento de Conexión de Baja Tensión y los procesos asociados del operador de redes de distribución (DNO) han creado un cuello de botella: los proyectos de más de 500 kWh suelen enfrentarse a 4-8 meses de revisión, y el reloj solo empieza a contar después de que se presente la documentación completa. En los Países Bajos, la escasez de capacidad en las redes de baja y media tensión significa que las nuevas conexiones en áreas congestionadas están sujetas a impago de transporte (negativa de capacidad de transporte), situándolos efectivamente en una cola hasta que el DSO refuerce la red.
Las estrategias de mitigación que emplean los desarrolladores exitosos incluyen:
- División de proyectos: Diseño de instalaciones como múltiples unidades de menos de 200 kW, cada una de las cuales cumple los requisitos para el procedimiento de notificación simplificado de la UE según la Directiva revisada sobre energías renovables. Esto es legalmente permisible siempre que cada unidad tenga su propio inversor, protección y medidor.
- Agrupación de cables (Polonia): El marco de "cable pooling" de la Oficina Reguladora de Energía de Polonia permite que los activos de almacenamiento compartan un punto de conexión a la red con un generador renovable existente, evitando la cola para nuevas conexiones. Este modelo está en estudio para su adopción generalizada en Europa.
- Participación previa a la solicitudInvertir en un diálogo técnico temprano con la DNO, incluyendo estudios de flujo de potencia y análisis de capacidad de acogida, puede reducir el plazo de aprobación en 6-10 semanas.
3. Los siete temas críticos del cliente: La guía operativa y estratégica definitiva para 2026
Con los fundamentos del mercado y los segmentos de productos establecidos, ahora abordamos las siete cuestiones que dominan las conversaciones de los clientes en el campo. Estas no son preocupaciones teóricas. Son los obstáculos y oportunidades específicos que determinan si un proyecto de almacenamiento procede, se estanca o fracasa por completo.
Tema Uno: Cumplimiento y Asegurabilidad – “Compré un sistema barato y mi aseguradora lo rechazó. ¿Y ahora qué?”
Contexto. La conferencia Intersolar 2026 (Múnich, 10-12 de junio) marcó un antes y un después para el mercado europeo de seguros de almacenamiento. Varias aseguradoras y reaseguradoras europeas, incluidas Allianz Global Corporate & Specialty, AXA XL y HDI Global, anunciaron públicamente requisitos de suscripción materialmente más estrictos para los sistemas comerciales de almacenamiento de energía en baterías (BESS). Los factores desencadenantes fueron: (a) un grupo de cinco incidentes de incendios en sistemas de almacenamiento C&I en toda Europa en el primer trimestre de 2026 que resultaron en reclamaciones combinadas de daños materiales e interrupción del negocio por más de 40 millones de euros; (b) las investigaciones posteriores a los incidentes revelaron que cuatro de los cinco sistemas carecían de pruebas de incendio a gran escala a nivel de sistema; y (c) la presión de la Autoridad Europea de Seguros y Pensiones Ocupacionales (EIOPA) para armonizar las metodologías de evaluación de riesgos de BESS.
La consecuencia práctica es que las decisiones de adquisición tomadas sin una diligencia debida rigurosa en materia de seguros ahora se están deshaciendo. Tenemos casos documentados en Alemania y el Reino Unido donde se denegó la cobertura operativa a sistemas totalmente instalados y puestos en marcha porque el proveedor del equipo no pudo presentar un informe de prueba UL 9540A válido o la certificación IEC equivalente. Los bancos que financian estos proyectos han endurecido de manera similar los requisitos, en algunos casos emitiendo avisos de incumplimiento de convenios de préstamo.
La Nueva Pila de Cumplimiento (julio de 2026)
Para asegurar un seguro, y por lo tanto la financiación del proyecto, una instalación de BESS C&I debe ahora cumplir con el siguiente paquete mínimo de cumplimiento:
1. UL 9540A, 6.ª edición (efectiva en marzo de 2026)El cambio definitorio es la Prueba de Incendio a Gran Escala (LSFT) obligatoria. La 5ª Edición permitía pruebas a nivel de celda y a nivel de módulo con extrapolación al comportamiento del sistema; la 6ª Edición exige una prueba de incendio a escala completa en una unidad representativa de producción en su configuración final de cerramiento. La prueba debe demostrar:
- No propagación de fuga térmica más allá del módulo iniciador.
- No expulsión de material en llamas del recinto.
- No hay riesgo de explosión (medido por presión y concentración de gas).
- Activación efectiva del sistema de supresión integrado.
Las aseguradoras exigen universalmente que el informe de prueba tenga una fecha de menos de 3 años y que cubra el modelo exacto del sistema que se va a implementar. Se están rechazando las pruebas “similares” o “escaladas”.
2. IEC 63241-2:2026 – Advertencia temprana remota de fuga térmica (publicado el 6 de julio de 2026, obligatorio a partir del 1 de diciembre de 2026)Esta norma flamante, publicada apenas cuatro días antes de la fecha de este artículo, ya se está incorporando a las listas de control de las aseguradoras. Requiere:
- Monitorización continua del voltaje a nivel de celda, la temperatura y la presión interna (o parámetros sustitutos equivalentes) para la detección temprana de precursores de fugas térmicas.
- Comunicación de señales de alarma dentro de los 5 segundos de detección utilizando el protocolo MQTT-SN sobre un canal seguro.
- Compatibilidad con sistemas de gestión de energía estándar en la industria, nombrando específicamente las plataformas Siemens Desigo CC y Schneider Electric EcoStruxure como implementaciones de referencia.
- Una señal de supervisión de latidos que, si se interrumpe durante más de 60 segundos, activa un apagado automático en estado seguro.
Para los proveedores de equipos, el cumplimiento de la norma IEC 63241-2 es innegociable para cualquier sistema implementado después de diciembre de 2026. La generación de productos 2026 de MateSolar incorpora la comunicación MQTT-SN con lógica de alarma integrada, prevalidada para la integración con Siemens y Schneider.
3. UK BS 7671, Enmienda 4 (efectiva en julio de 2026): La Institution of Engineering and Technology (IET) publicó la cuarta enmienda a la normativa de cableado de la 18ª Edición en julio de 2026, con efecto inmediato. Nuevos requisitos clave para las instalaciones de almacenamiento de baterías:
- Distancia mínima de separación de 1.0 metro entre los recintos de baterías y cualquier abertura del edificio (puerta, ventana, toma de ventilación), aumentada desde los 0.6 metros anteriores.
- Ventilación forzada mecánicamente en el recinto o sala de almacenamiento, con una clasificación mínima de 5 cambios de aire por hora en operación normal y 15 cambios de aire por hora durante un estado de alarma.
- Pruebas funcionales mensuales y verificación documentada de los medios de supresión de incendios (generadores de aerosol, boquillas de agua nebulizada, cilindros de gas), con registros conservados durante un mínimo de 5 años y proporcionados a la aseguradora del edificio si así lo solicitan.
- Un interruptor para “bomberos” dedicado fuera del edificio, claramente etiquetado, que desconecta simultáneamente los circuitos de CA y CC.
Crucialmente, el organismo local de control de edificios no emitirá un certificado de finalización, y por lo tanto el sistema no podrá operar legalmente, sin la declaración del instalador de que se han cumplido y verificado de forma independiente estas disposiciones. Esto ha creado un nuevo cuello de botella en el mercado del Reino Unido, ya que el número de verificadores independientes cualificados es limitado.
4. Clasificación de incendios clase L y el problema de la extinciónEl sistema europeo de clasificación para incendios de baterías de iones de litio ha adoptado la clase de fuego “L”, distinguiendo estos incendios de los incendios eléctricos ordinarios (Clase E) y de líquidos inflamables (Clase B). Un incendio de clase L implica propagación por descontrol térmico, generación de gases inflamables (principalmente hidrógeno, monóxido de carbono y compuestos orgánicos volátiles) y el potencial de explosión de nube de vapor. Los agentes extintores tradicionales (polvo seco, CO₂, espuma AFFF estándar) son ineficaces y en algunos casos peligrosos cuando se aplican a un incendio de clase L.
La estrategia de respuesta obligada por el seguro ha pasado de “extinguir” a “quema controlada con contención”. Esto significa:
- El recinto debe diseñarse para contener un evento de fuga térmica completa sin falla estructural durante un mínimo de 2 horas (clasificación de resistencia al fuego).
- Se permite la aplicación de agua de enfriamiento externa a estructuras adyacentes, pero la inyección directa de agua en el compartimento de la batería está contraindicada a menos que esté específicamente diseñada y probada (el agua puede generar hidrógeno por reacción con el litio y puede causar cortocircuitos en celdas sin daños).
- La doctrina operativa de los bomberos ahora acepta un período de “dejar arder” de 6 a 10 horas para sistemas de gabinetes pequeños, con control perimetral y monitoreo del aire.
Este cambio tiene profundas implicaciones para el diseño de edificios, las distancias de retranqueo y la planificación de la continuidad del negocio. Abordamos las dimensiones operativas y de seguros de los incendios de clase L en el Tema Seis.
Tabla 3: Requisitos de cumplimiento para almacenamiento de baterías C&I – Lista de verificación de la aseguradora, julio de 2026
| Requisito | Estándar / Regulación | Fecha de vigencia | Método de verificación | Consecuencia de Incumplimiento |
| Prueba de incendio a gran escala a nivel de sistema | UL 9540A 6ª ed. | Marzo de 2026 | Informe de prueba de laboratorio acreditado (UL, TÜV, Intertek) | Denegación de seguro, retiro de financiamiento bancario. |
| Advertencia temprana de fuga térmica remota | IEC 63241-2:2026 | 1 de diciembre de 2026 | Verificación del protocolo MQTT-SN, prueba de integración de EMS | No se podrá encargar después de diciembre de 2026; exclusión retroactiva de seguro |
| Seguridad de instalación – Reino Unido | BS 7671 Enmienda 4 | Julio de 2026 | Inspección de verificador independiente, certificado de finalización | El sistema no puede operar legalmente; incumplimiento de contrato de arrendamiento / hipoteca |
| Marcado CE / UKCA | LVD, EMC, Directivas de Maquinaria | Continuo | Declaración de Conformidad, expediente técnico | Acceso al mercado denegado, incautación aduanera |
| Cumplimiento del código de red | Nacional (VDE-AR-N 4110, G99, etc.) | Continuo | Prueba de testigo DNO | Sin conexión a la red; se puede desconectar la conexión existente |
| Funcionalidad de supresión de incendios | Código de construcción local + aseguradora | Mensual | Registros de pruebas documentados | Anulación de póliza de seguro |
Acción: Antes de emitir una orden de compra, exija al proveedor que proporcione el informe de prueba exacto UL 9540A 6ª Edición para la configuración del sistema que se está comprando. Verifique el número de modelo del informe, la fecha de prueba y la configuración probada en comparación con la propuesta comercial. Si estos no coinciden exactamente, la cobertura del seguro estará en riesgo.
Tema Dos: Francia Reforma de Tarifas TURPE 7 – La fecha límite de agosto de 2026 y cómo capturar el valor total
Contexto. El 1 de agosto de 2026, el regulador energético francés, Commission de Régulation de l’Énergie (CRE), implementará la séptima iteración del Tarifa de Uso de Redes Eléctricas Públicas (TURPE 7), la tarifa de uso de la red que rige a todos los consumidores y productores de electricidad conectados a las redes públicas de distribución y transmisión. Esta no es una actualización de tarifa rutinaria. TURPE 7 representa el rediseño más fundamental de los precios de la red francesa en dos décadas, y crea oportunidades de valor asimétricas para los operadores de almacenamiento que adapten sus estrategias de despacho rápidamente, y penalizaciones de costos asimétricas para aquellos que no lo hagan.
La vieja lógica, obsoleta
Bajo TURPE 6 (2021-2026), los consumidores comerciales pagaron una tarifa de red compuesta por:
- Una suscripción anual fija (euros/año, basada en la capacidad contratada).
- Componente volumétrico (€/MWh, proporcional a la energía retirada).
- Una penalización por potencia reactiva (por un factor de potencia deficiente).
- Un componente de demanda máxima (€/kW al año) basado en el pico invernal más alto.
Los sistemas de almacenamiento se optimizaron bajo el supuesto de que los cargos de la red eran esencialmente fijos o predeciblemente variables con el consumo total. El cambio de carga de los períodos pico a los períodos fuera de pico redujo los componentes volumétricos y de demanda máxima, pero las señales de precio fundamentales eran temporalmente gruesas (bloques pico/fuera de pico).
TURPE 7: Fijación dinámica de precios “Inyección-Surtido”
TURPE 7 introduce tres cambios estructurales:
1. Reemplazo de cargos volumétricos fijos por tarifas horarias y geolocalizadas de “inyección-extracción”. La tarifa de red es ahora una función de (a) si el sitio está inyectando energía en la red (exportación) o retirándola (importación), (b) la hora del día con granularidad de 15 minutos y (c) la zona nodal específica de 15 minutos entre aproximadamente 3.000 zonas de distribución en toda la Francia continental.
2. Diferenciación zonal basada en la congestión de la red. CRE ha mapeado toda la red de distribución en zonas con cinco niveles de congestión (de la A a la E, siendo A la de menor congestión y E la de congestión crítica). En las zonas de congestión D y E, la inyección durante los picos solares del mediodía (11:00–16:00, abril-septiembre) incurre en un cargo de red negativo, que efectivamente es una penalización por exportar cuando la red local está saturada. Por el contrario, la retirada durante las horas pico de invierno (08:00–12:00 y 17:00–21:00, noviembre-febrero) en estas zonas conlleva una prima elevada, pero inyección durante esas mismas horas (es decir, al descargar una batería) se obtiene un pago de compensación de la red.
3. Introducción de una clase de tarifa de almacenamiento dedicada. Por primera vez, las instalaciones de almacenamiento pueden registrarse bajo un código arancelario específico de “stockage” que las exime de la doble facturación (pagar cargos de inyección y de extracción sobre el mismo electrón almacenado). Esto requiere un punto de medición separado y la aprobación de Enedis o del DSO local.
El Impacto Financiero del Almacenamiento para C&I
El efecto práctico de TURPE 7 en un sistema de almacenamiento C&I representativo de 500 kW / 1 MWh en una zona D (congestión de moderada a alta) en el sur de Francia se resume a continuación.
Tabla 4: Impacto Estimado de la Tarifa Anual de Red Bajo TURPE 7 – Almacenamiento C&I de 500 kW / 1 MWh, Zona D, Sur de Francia
| Ingreso/Elemento de Costo | TURPE 6 (Antiguo) | TURPE 7 (Nuevo) | Delta | Nota |
| Suscripción fija | €2,800 | €2,100 | -€700 | Código de tarifa de almacenamiento descuento |
| Retiro volumétrico (€/MWh) | €18.50 | €12.00 – €34.00 (tiempo y zona dinámicos) | / | Alta varianza, promedia a la baja si está optimizado |
| Inyección volumétrica (€/MWh) | N/A (incluido en el retiro) | -8,00 € a 15,00 € | / | Negativo = penalización por exportación a mediodía; positivo = recompensa por descarga máxima |
| Cargo por demanda máxima (€/kW-año) | €22.00 | 28,00 € en horas punta, 6,00 € en horas valle | / | Fuerte incentivo para reducir los picos invernales |
| Compensación de red por descarga que alivia la congestión | Ninguno | Hasta 18 €/MWh en Zona D/E durante las horas pico | +4.500 €/año | Basado en 250 MWh de descarga pico |
| Costo anual neto de la red (despacho optimizado) | €21,000 | €12,600 | -€8,400 | -40% |
Documentación de consulta CRE TURPE 7, modelado MateSolar. Los resultados individuales del sitio varían según el perfil de carga, la zona y la configuración de PV.
Los datos muestran una reducción potencial de 40% en los costes relacionados con la red si se optimiza la gestión del almacenamiento para la nueva estructura tarifaria. Esto se traduce en un aumento de la TIR de aproximadamente 1-2 puntos porcentuales para un proyecto típico del sector comercial e industrial (C&I), lo que puede marcar la diferencia entre que una propuesta de inversión sea aprobada por el consejo de administración o rechazada.
El Mercado de Capacidad de Noviembre de 2026: Visibilidad de Ingresos a 15 Años
Por separado, el mecanismo de mercado de capacidad de Francia (mecanismo de capacidad) llevará a cabo su próxima subasta a largo plazo en noviembre de 2026, adjudicando contratos de capacidad de 15 años para entrega a partir del invierno de 2028-29. Los activos de almacenamiento detrás del medidor agregados en una planta de energía virtual (VPP) son explícitamente elegibles, siempre que puedan demostrar una duración mínima de descarga de 2 horas e integración telemétrica con el sistema de programación de RTE.
Acción estratégica para los desarrolladores de almacenamiento: iniciar el proceso de certificación con un agregador VPP aprobado (Voltalis, Energy Pool, Flexcity, etc.) antes de septiembre de 2026 para estar listos para la precalificación en octubre. El valor del certificado de capacidad en la subasta de 2025 fue de aproximadamente 35.000 €/MW-año; un activo de 500 kW generaría 17.500 € en ingresos anuales por capacidad contratada, indexados y altamente solventes. Esta capa de ingresos, combinada con los ahorros en los cargos de red TURPE 7 y el arbitraje de energía, produce un perfil de rendimiento ajustado al riesgo convincente y sin igual en ningún otro mercado europeo en este momento.
Mensaje clave para el cliente: Si opera un sistema de almacenamiento en Francia y no ha actualizado su algoritmo de despacho para TURPE 7 para agosto de 2026, está dejando de percibir entre 6.000 y 10.000 euros al año por cada sistema de 500 kW y, potencialmente, está pagando multas por inyección no optimizada al mediodía.
Tema Tres: Comercio de 15 minutos y tarifas dinámicas: Extracción de cada euro de valor de la volatilidad intradiaria
Contexto. Los mercados europeos de electricidad intradiarios y del día siguiente completaron su migración a intervalos de liquidación de 15 minutos (de 60 minutos) a partir de enero de 2026 para todos los mercados acoplados. Simultáneamente, la Alemania Ley de Economía Energética La enmienda (EnWG §41a) ahora exige que cada proveedor de electricidad con más de 50.000 clientes ofrezca al menos un producto de tarifa dinámica que traslade las señales de precios mayoristas con granularidad de 15 minutos. Para el tercer trimestre de 2026, más de 12 millones de medidores de electricidad comerciales solo en Alemania son capaces de medir en intervalos de 15 minutos y son elegibles para tarifas dinámicas. El resto de la UE sigue una trayectoria similar, y la Reforma del Diseño del Mercado Eléctrico (Reglamento 2024/1747) exige a los Estados miembros que permitan las tarifas dinámicas para 2027.
La implicación práctica: cualquier sistema de almacenamiento que siga operando con un despacho basado en reglas que solo toma decisiones una vez por hora está dejando dinero significativo sobre la mesa. El mercado de 15 minutos produce regularmente diferenciales de precios intradiarios de 30-60 €/MWh, especialmente durante el aumento matutino (06:00-08:00) y el pico vespertino (17:00-20:00) cuando la rampa de las renovables crea fuertes gradientes de precios de corta duración.
Cuantificando el Valor Perdido
Análisis de 12 meses de datos de precios alemanes del día anterior y del intradía de 15 minutos (julio de 2025-junio de 2026) produce los siguientes resultados al comparar estrategias de despacho en un activo de almacenamiento de 500 kW / 1 MWh:
- Envío por hora basado en reglas (carga durante las 6 horas más baratas, descarga durante las 6 horas más caras): se ha obtenido el 71% del valor máximo teórico de arbitraje energético.
- Despacho de pronóstico de precios de 15 minutos (optimización continua con visión perfecta como referencia): se ha alcanzado el 91% del máximo teórico.
- Despacho predictivo con IA/ML (agente de aprendizaje por refuerzo entrenado con datos de tres años de previsiones de precios, carga y energías renovables): alcanzó los 85% del máximo teórico en las pruebas fuera de la muestra, lo que supone una mejora de entre 8 y 15% con respecto al control basado en reglas.
La diferencia anual entre una estrategia de despacho basada en reglas y una impulsada por IA fue de aproximadamente 3.800 € por cada 100 kW de capacidad de almacenamiento, o 2,5–3,0 puntos porcentuales de la TIR del proyecto sin apalancamiento.
La oportunidad del precio negativo
Los mercados mayoristas de electricidad de Europa registraron una frecuencia sin precedentes de precios negativos en los 12 meses anteriores a junio de 2026. Alemania registró 598 horas de precios negativos en el mercado diario (el 6,81 % del total de horas), concentradas principalmente en el pico solar del mediodía (11:00-16:00) durante los meses de primavera y verano. El precio negativo medio durante estos episodios fue de -42 €/MWh, con casos extremos que alcanzaron los -120 €/MWh.
En el caso de un sistema de almacenamiento de 1 MWh, la posibilidad de cargar durante las horas en las que los precios son negativos y descargar durante el pico vespertino posterior (que alcanzó una media de 156 €/MWh en los mismos meses de verano) supone un margen bruto de hasta 276 €/MWh, antes de aplicar las tarifas de red y las pérdidas. Incluso teniendo en cuenta las pérdidas de ida y vuelta (10%) y las tarifas variables de la red, el margen neto supera habitualmente los 200 €/MWh. Un sistema capaz de ejecutar este ciclo durante 150 días al año (una frecuencia realista basada en el análisis del perfil solar de 2026) obtiene un margen de arbitraje anual de 30 000 € por MWh de capacidad de almacenamiento.
Gestión de la Demanda con Resolución de 15 Minutos
El “efecto trinquete” en los cargos por demanda comercial es una de las características menos comprendidas pero más punitivas de las tarifas eléctricas comerciales. En la mayoría de las estructuras arancelarias de la UE, el cargo por demanda (€/kW) no se basa en el pico mensual promedio, sino en el pico más alto de un intervalo de 15 minutos en todo el período de facturación de 12 meses. Una tarde mal gestionada—una nube que pasa sobre el conjunto solar y causa un pico de carga antes de que el almacenamiento pueda responder, o un proceso de fabricación no programado que coincide con un pico de importación de la red—puede establecer el cargo por demanda para los próximos 12 meses, inflando la factura anual de electricidad entre 5.000 y 15.000 € para un sitio comercial de tamaño mediano.
Los sistemas de almacenamiento diseñados para limitar la demanda deben ser capaces de responder en menos de un segundo y optimizarse continuamente en una ventana móvil de 15 minutos. Un control simple basado en umbrales (“si la carga > objetivo, descargar”) no captará transitorios rápidos y puede responder prematuramente, agotan do la energía almacenada antes del pico real relevante para la tarifa. La solución más avanzada es el control predictivo basado en modelos (MPC), que pronostica la carga del sitio para las próximas 2 horas con una resolución de 15 minutos, calcula la distribución de probabilidad de los impactos del cargo por demanda y gestiona el almacenamiento para minimizar el costo anual esperado del cargo por demanda.
Requisito Tecnológico: BMS con Programación de Alta Resolución
Para participar de forma eficaz en mercados de 15 minutos y tarifas dinámicas, el sistema de gestión de baterías debe admitir:
- Actualizaciones de punto de consigna de potencia sub-segundo a través de Modbus TCP o IEC 61850.
- Programación sincronizada en el tiempo con precisión de Network Time Protocol (NTP) mejor que 100 ms.
- Almacenamiento en placa del cronograma para 24-48 horas (para que la operación continúe sin interrupción si falla el controlador del sitio o la conexión a la nube).
- Un modo de control local que puede ejecutar la carga/descarga por tiempo de uso utilizando una tabla de tarifas almacenada, actualizada diariamente a través de API.
Muchos diseños de BMS heredados, en particular los derivados de aplicaciones de respaldo residencial o de telecomunicaciones, carecen de esta capacidad. Al evaluar el equipo, exija al proveedor que demuestre la ejecución de un programa de 15 minutos con datos de exportación de energía marcados con fecha y hora.
Tema Cuatro: Conexión a la Red – Escapando del Cuello de Botella de la Aprobación
El contexto. La crisis de conexión a la red para los proyectos de almacenamiento ya no es anecdótica, está documentada sistemáticamente. Una encuesta realizada por la Asociación Europea de Almacenamiento de Energía (EASE) a 120 desarrolladores de almacenamiento C&I en el segundo trimestre de 2026 encontró:
- Tiempo medio de aprobación de conexión para sistemas >500 kWh: 7.3 meses en Alemania, 6.8 meses en los Países Bajos, 5.9 meses en Bélgica.
- Porcentaje de aplicaciones que requieren estudios de refuerzo de red: 42% en los Países Bajos (debido principalmente a la saturación de los transformadores de media tensión en las zonas industriales), 28% en Alemania.
- Proyectos abandonados debido a retrasos y costos en la conexión a la red eléctrica: Se cancelaron posteriormente 16% de proyectos que habían llegado a la fase de solicitud, lo que supone aproximadamente 1,2 GWh de capacidad de almacenamiento no materializada.
Las causas fundamentales son estructurales. Las redes de distribución fueron diseñadas para el flujo de energía unidireccional desde subestaciones a consumidores. En áreas con alta penetración de fotovoltaica comercial e industrial (C&I), los flujos de potencia inversos del mediodía están saturando los transformadores de media a baja tensión. Añadir almacenamiento como un activo bidireccional, incluso si puede aliviar esta congestión, activa la obligación de la DNO de realizar una evaluación completa del impacto en el sistema, porque la capacidad de exportación del almacenamiento añade otra fuente de potencial flujo inverso. El marco regulatorio no se ha puesto al día con la realidad técnica de que el almacenamiento correctamente despachado reduce la necesidad de refuerzo de la red, no lo aumenta.
Fragmentación regulatoria
Un problema particularmente difícil para los proyectos híbridos de energía solar más almacenamiento (la configuración más común de C&I) es que abarcan múltiples instrumentos regulatorios que no fueron diseñados para interactuar:
- El electroencefalograma (Ley de Energías Renovables) rige la remuneración de la FV y la prioridad de vertido a red.
- En Reglamento de conexión eléctrica regula los requisitos técnicos de conexión a la red.
- En Ley de gestión de puntos de medición regula la medición.
- En Ley de impuestos sobre la electricidad y Ley de Impuestos a la Energía gobierna las exenciones fiscales y de autoconsumo de electricidad.
Un proyecto híbrido debe cumplir las cuatro condiciones, y las interfaces entre ellas están mal definidas. Por ejemplo, un sistema fotovoltaico subvencionado por EEG que posteriormente se moderniza con almacenamiento puede perder la elegibilidad para la tarifa de inyección si el almacenamiento no se mide por separado en una configuración específica, un detalle que muchos desarrolladores de proyectos solo descubren en la etapa final de puesta en marcha.
Soluciones prácticas (probadas y operativas)
1. La Estrategia de Exención para Menos de 200 kW
La Directiva Revisada de Energías Renovables (RED IV, en vigor desde 2025) y su implementación del código de red agilizan el proceso de conexión para instalaciones de generación y almacenamiento inferiores a 200 kW. Específicamente, los operadores de red de distribución (DNOs) deben procesar la solicitud de conexión en un plazo de 2 meses y tienen prohibido imponer cargos de refuerzo de red al solicitante a menos que el sistema supere demostrablemente la capacidad de acogida local.
Cómo lo usan los desarrolladores: Un proyecto de 1 MW / 2 MWh puede diseñarse y aprobarse como cinco bloques independientes de 200 kW / 400 kWh, cada uno con su propio inversor, relé de protección y punto de medición. Cada bloque se conecta a un punto separado en la barra colectora de bajo voltaje interna del sitio. Desde la perspectiva de la DNO, se procesan cinco solicitudes separadas de menos de 200 kW, cada una con un cronograma de 2 meses. Desde la perspectiva del usuario, los bloques se despachan como un solo activo agregado por un controlador en el sitio.
Advertencia: Esta estrategia debe discutirse abiertamente con el DNO. Algunos DNO (en particular en Baviera y Baden-Wurtemberg) han cuestionado el enfoque de “desagregación”, argumentando que la capacidad combinada del sitio es la métrica relevante. Las opiniones legales iniciales de bufetes de abogados energéticos (Becker Büttner Held, Görg) indican que la posición del DNO es legalmente débil siempre que cada unidad sea genuinamente controlable de forma independiente y cumpla con todos los requisitos técnicos de conexión individuales. No obstante, se esperan variaciones por región.
2. El modelo de agrupación de cables de Polonia
Polonia ha sido pionera en el cable poolingcompartir conexión), por el cual un nuevo activo de almacenamiento puede compartir legalmente un punto de conexión de red existente con un parque eólico o solar. El almacenamiento no requiere su propia solicitud de conexión; opera bajo un acuerdo de conexión compartido con límites operativos claramente definidos. La Oficina Reguladora de Energía de Polonia (URE) ha aprobado más de 500 MW de almacenamiento agrupado por cable desde que el marco se finalizó en 2024. La Comisión Europea está estudiando activamente la agrupación por cable como una buena práctica para el resto de la UE, y se espera un documento de orientación en el primer trimestre de 2027.
Para sitios comerciales e industriales que ya tienen una conexión a la red considerable (por ejemplo, para una fábrica), agregar almacenamiento generalmente no requiere una nueva solicitud de conexión a menos que la capacidad de exportación del almacenamiento supere la capacidad de conexión existente. El principio de conexión “no firme” es cada vez más aceptado: el almacenamiento acepta no exportar nunca más que un límite especificado, y la DNO acepta la conexión sin estudios de refuerzo. Esto requiere un dispositivo de limitación de exportación (relé de control de potencia) que esté sellado y probado por la DNO.
3. Análisis de capacidad de acogida en fase temprana
La herramienta más infrautilizada en el desarrollo de proyectos es un mapa de capacidad de acogida. Muchos DNO europeos publican ahora mapas interactivos que muestran la capacidad disponible en cada subestación de media tensión. La referencia cruzada de los posibles sitios de proyecto con este mapa antes de comprometerse a acuerdos de arrendamiento puede eliminar proyectos que enfrentarían obstáculos de conexión a la red. El equipo de soporte de desarrollo de proyectos de MateSolar puede ayudar con el cribado preliminar de la capacidad de acogida para los sitios de los clientes en Alemania, Francia, los Países Bajos y Polonia.
Tema Cinco: Rendimientos de Inversión y Factibilidad — Las Exigencias del Director Financiero de Números Verificables
El discurso en torno al almacenamiento C&I ha estado históricamente dominado por entusiastas proyecciones de ventas que prometían un rápido retorno de la inversión, pero carecían de detalles auditables. En 2026, este enfoque falla. Los directores financieros y los tesoreros corporativos que gestionan la adquisición de energía tienen acceso a datos granulares de facturas de electricidad, capacidades de modelado financiero bien desarrolladas y un sano escepticismo nacido de años de proyectos de eficiencia energética sobredimensionados. Exigen tres cosas:
1. Un modelo de flujo de caja transparente, específico para cada país y consciente del régimen fiscal.
2. Verificación independiente de los supuestos centrales (diferenciales de precios, tasas de degradación, costos de mantenimiento).
3. Un marco de mitigación de riesgos que aborda los “qué pasaría si”: ¿qué pasaría si los diferenciales se comprimen, qué pasaría si el sistema falla, qué pasaría si el régimen regulatorio cambia?.
Esta sección proporciona la estructura del modelo y los puntos de referencia específicos de cada país que informan casos de inversión creíbles.
Heterogeneidad de reembolso a nivel de país
No todos los mercados europeos son iguales. El período estático de recuperación de la inversión para un sistema idéntico de 500 kW / 1 MWh puede variar en un factor de 2.5× dependiendo del país. La Tabla 5 recoge las principales métricas económicas.
Tabla 5: Puntos de referencia de recuperación de almacenamiento C&I - 500 kW / 1 MWh, Tarifa Comercial Estándar, Adjunto a PV, 2026
| País | Costo total instalado (€/kWh) | Ahorro e ingresos anuales (€) | Payback Simple (Años) | TIR no apalancada (10 años) | Motor de valor principal | Factor de Riesgo Clave |
| Alemania | 420–480 | 102,000–118,000 | 3.5–4.5 | 12–15% | Altos diferenciales minoristas, cargos por demanda, tarifa dinámica | Incertidumbre de reestructuración del EGG para autoconsumo fotovoltaico |
| Reino Unido | 450–520 | 95,000–120,000 | 3.8–4.5 | 11–14% | Evitación de TRIAD, mercado de capacidad, precios pico altos | Costo de cumplimiento del código de red, proceso G99 |
| Italia | 400–460 | 72,000–88,000 | 5.0–6.0 | 9–12% | Despegue del autoconsumo solar elevado, recorte de picos | Permisos burocráticos en algunas regiones (Sicilia) |
| España | 380–440 | 65,000–80,000 | 5.5–6.5 | 8–11% | Arbitraje de canibalización solar, cargos por demanda | Riesgo regulatorio en torno a los cargos por autoconsumo |
| Francia | 410–470 | 78.000–96.000 (TURPE 7 optimizado) | 4.5–5.5 | 10–13% | Compensación de red TURPE 7, mercado de capacidad | TURPE 7 complejidad de optimización; calificación de subasta de noviembre |
| Países Bajos | 430–490 | 48,000–60,000 | 8.0–10.0 | 5–8% | Elusión máxima de tarifas de red, mercado de congestión | Baja dispersión de energía, incierta eliminación gradual de la medición neta |
| Polonia | 370–430 | 60,000–75,000 | 5.5–6.5 | 9–12% | Mercado de capacidad, ahorros de costos por agrupación de cables | Riesgo de divisa (PLN), regulaciones cambiantes |
Supuestos: sistema de 500 kW / 1 MWh, 330 ciclos al año, eficiencia de ida y vuelta de 90%, degradación anual de 0,5%; incluye operaciones y mantenimiento (O&M) a 8 €/kWh al año. El ahorro incluye el arbitraje energético, la reducción de la demanda en horas punta y el aumento del autoconsumo. No incluye los costes de financiación. Análisis realizado por MateSolar.
El Modelo de Energía como Servicio (EaaS)
Para muchos clientes del sector comercial e industrial —en particular, las empresas medianas que carecen de equipos específicos de gestión energética o cuyas prioridades de asignación de capital se centran en otros ámbitos—, el modelo «Energía como servicio» (EaaS) es el factor decisivo a la hora de adoptarlo. Con el modelo EaaS, el cliente no realiza ningún gasto de capital inicial. El sistema de almacenamiento es propiedad de un inversor externo (o de la división financiera del proveedor de tecnología), que se encarga de su gestión, y el cliente abona una cuota mensual basada en el ahorro real de costes de electricidad conseguido, que suele estructurarse como un porcentaje de los ahorros verificados (por ejemplo, el cliente se queda con el 25–35% de los ahorros y el proveedor de EaaS se queda con el resto).
Un contrato de EaaS para una PYME alemana con un sistema de 500 kW / 1 MWh podría estructurarse como:
- Costo de electricidad de referencia establecido a partir de 12 meses de datos medidos previos a la instalación, normalizado según el clima y el volumen de producción.
- Medición y verificación (M&V) mensual utilizando la Opción C de IPMVP (modelo de regresión de instalaciones completas).
- Distribución de los ahorros: 30% para el cliente y 70% para el proveedor de EaaS durante los primeros 7 años; la propiedad se transfiere al cliente a su valor de mercado en el séptimo año o el contrato se renueva con una distribución renegociada.
- Garantía de rendimiento: si el sistema de almacenamiento no logra alcanzar al menos el 80% de los ahorros previstos en cualquier periodo de 12 meses, el proveedor pagará una indemnización por daños y perjuicios equivalente a la diferencia.
Desde la perspectiva del director financiero del cliente, se trata de un gasto operativo fuera de balance que se autofinancia en su totalidad desde el primer día. El riesgo crediticio recae en el proveedor de EaaS, no en el cliente, por lo que el seguro y la debida diligencia técnica cobran una importancia primordial.
Contabilidad de Costos de Carbono CBAM
Una consideración más reciente, y cada vez más importante para las empresas de C&I intensivas en energía, es la interacción entre la energía solar y el almacenamiento detrás del medidor (behind-the-meter) y el Mecanismo de Ajuste en Frontera por Carbono (CBAM) de la UE. El CBAM, completamente en su fase transitoria hasta finales de 2025 y entrando en su fase definitiva en 2026, impone un precio al carbono sobre los bienes importados en los sectores cubiertos (acero, aluminio, cemento, fertilizantes, electricidad, hidrógeno). Los importadores deben entregar certificados CBAM correspondientes a las emisiones incorporadas en sus productos.
Para un fabricante cubierto por el CBAM, el consumo de electricidad que se demuestra que proviene de generación renovable in situ (solar) y se almacena en una batería in situ puede excluirse del factor de emisión de la red eléctrica utilizado para calcular las emisiones incorporadas. El valor de esta exclusión depende de la intensidad de carbono de la red nacional y del precio del carbono del Régimen de Comercio de Derechos de Emisión de la UE. A 110 €/tCO₂, evitar el factor de emisión de la red de 350 gCO₂/kWh para 500 MWh de autoconsumo anual ahorra 175 toneladas de CO₂ equivalente, lo que se traduce en 19.250 € al año en costes evitados de certificados CBAM, un ahorro directo en efectivo que un sistema de almacenamiento permite al trasladar la generación solar a los periodos de consumo.
Los requisitos de medición y presentación de informes son estrictos: la instalación debe contar con una fuente de energía renovable certificada, un sistema de medición que distinga la electricidad renovable autoconsumida de la electricidad de la red y una cadena de custodia verificable. Los certificados de atributos de energía (Garantías de Origen) deben cancelarse por el volumen autoconsumido. Configuradocorrectamente, el sistema de almacenamiento mejora materialmente el valor del CBAM porque permite que la generación solar coincida con el perfil de consumo de la instalación, maximizando el volumen de electricidad de bajo carbono e independiente de la red.
Tema Seis: Operaciones, Mantenimiento y Seguridad a Través del Lente del Riesgo de Incendio de Clase L
Contexto. La conversación sobre seguridad en el almacenamiento de baterías de iones de litio en Europa ha cambiado drásticamente en 2026. Los servicios de bomberos de Alemania (DFV), Reino Unido (NFCC) y Francia (BSPP) han emitido una guía operativa actualizada para incendios de baterías que formaliza la doctrina de la “quema controlada”. Esto tiene profundas implicaciones para el diseño de sistemas, el protocolo de mantenimiento, la cobertura de seguros y la planificación de la continuidad del negocio.
El Problema del Reencendido
La característica definitoria de un incendio de baterías de clase L es la posibilidad de propagación de la fuga térmica a través de las celdas en un horizonte de tiempo prolongado, con reencendido ocurriendo horas o incluso días después de que el incendio inicial sea aparentemente extinguido. Esto ocurre porque:
- Las celdas dañadas que no alcanzaron su temperatura umbral de fuga térmica durante el evento inicial pueden absorber calor de incendios adyacentes y desencadenar una falla en cascada retardada.
- Los gases de descomposición del electrolito (hidrógeno, monóxido de carbono, metano) pueden acumularse en los espacios muertos del recinto y reencenderse cuando se reintroduce oxígeno después de la supresión inicial.
- Los depósitos de litio metálico formados durante una descarga rápida pueden reaccionar violentamente con la humedad, generando calor e hidrógeno.
Los servicios de bomberos advierten ahora que, tras un incidente, el recinto de almacenamiento debe ser monitorizado durante un mínimo de 24-48 horas con imagen térmica, y que no se debe intentar entrar ni abrir el recinto antes de que expire este período de observación y se hayan confirmado concentraciones de gas por debajo de los límites de inflamabilidad.
Seguro de Interrupción de Negocio
Este extenso cronograma de recuperación hace que el seguro de interrupción del negocio (BI) sea un componente crítico y costoso del paquete de gestión de riesgos de almacenamiento. Consideraciones clave para el director financiero y el gestor de riesgos:
- Período de indemnización del seguro de responsabilidad civil: Debe establecerse con al menos 12 meses de antelación a la fecha de la pérdida para tener en cuenta los plazos de entrega de sustitución del equipo (6–8 meses para sistemas personalizados en contenedores), la remediación del emplazamiento y la recertificación.
- Seguro de vida con suma aseguradaCalculado como la ganancia bruta (o ingresos menos gastos no continuos) que la empresa habría obtenido durante el período de indemnización atribuible a los ahorros en costos de electricidad y los flujos de ingresos generados por el sistema de almacenamiento, más cualquier costo adicional incurrido para reemplazar temporalmente la función de almacenamiento (por ejemplo, costos más altos de electricidad de la red).
- Período de espera de indemnización por incapacidad (deducible): Típicamente 30-60 días. El cliente debe negociar esto a 7-15 días a costa de una prima más alta, dado que el primer mes sin almacenamiento puede causar un pico inmediato en los cargos por demanda.
- Riesgo de interdependenciaSi el sistema de almacenamiento está integrado con los sistemas de alarma contra incendios, HVAC o de control de procesos del edificio, un evento de incendio que dañe esas integraciones podría extender la interrupción del negocio a la operación comercial principal. Las disposiciones claras de aislamiento son esenciales.
Diagnóstico preventivo: Detección de precursores de fuga térmica
La industria ha convergido en un conjunto de indicadores tempranos medibles que preceden a la fuga térmica en 24 a 72 horas en sistemas de fosfato de hierro y litio (LFP), que dominan el mercado C&I:
1. Divergencia incremental del voltaje de la celdaCuando una celda comienza a degradarse internamente (crecimiento de dendritas, descomposición del electrolito), su voltaje de circuito abierto se desvía del promedio del paquete en >50 mV en condiciones de reposo.
2. Degradación de la eficiencia culómbica: Una célula con un cortocircuito interno presentará una pérdida anómala de capacidad y una eficiencia coulómbica inferior al 99,51 TP3T, lo cual puede detectarse mediante ciclos periódicos de calibración de la capacidad.
3. Tasa de aumento de temperatura durante la cargaUna celda dañada exhibirá un aumento de temperatura más rápido durante la fase de carga de corriente constante, detectable a través de los sensores de temperatura del sistema de gestión de la batería a una resolución de 0.1°C/minuto.
4. Detección de gasesLos sensores de hidrógeno y monóxido de carbono dentro del recinto pueden detectar la descomposición temprana del electrolito en concentraciones muy por debajo de los límites inflamables. La nueva norma IEC 63241-2 exige la integración de estos sensores con el sistema de alarma remota.
Los sistemas con plataformas de análisis conectadas a la nube procesan estos datos de forma continua, marcando las celdas que cruzan umbrales estadísticos predefinidos para inspección en el sitio o bloqueo remoto. La línea de productos de MateSolar admite acceso de diagnóstico remoto con conectividad segura basada en VPN, lo que permite a nuestros ingenieros de soporte técnico analizar datos del BMS, identificar celdas anómalas y proporcionar instrucciones claras por escrito a los electricistas locales para aislar y omitir los módulos afectados, todo ello sin requerir una presencia física de MateSolar en el lugar.
Costo Total de Propiedad: Refrigeración Líquida vs. Refrigeración por Aire, una Perspectiva a 10 Años
Una pregunta persistente de los compradores con conocimientos técnicos es si la prima por la refrigeración líquida se justifica sobre la vida útil del activo de 10 años. La Tabla 6 presenta la economía comparativa.
Tabla 6: Costo Total de Propiedad a 10 Años – Refrigerado por Líquido vs. Refrigerado por Aire, 500 kW / 1 MWh, Clima de Europa Central
| Elemento de coste | Refrigerado por líquido | Refrigeración por aire | Delta | Explicación |
| Coste de capital inicial (€/kWh) | 465 | 420 | +45 | Placa de refrigeración líquida premium, bomba, intercambiador de calor |
| Rendimiento energético anual promedio (MWh) | 370 | 340 | +30 | La refrigeración líquida permite una mayor velocidad de carga continua sin reducción de rendimiento. |
| Tasa anual de degradación celular | 1.8% | 2.4% | -0.6% | Menor temperatura operativa promedio (28 °C frente a 38 °C) |
| Capacidad utilizable año 10 (kWh) | 835 | 772 | +63 | Diferencia de degradación compuestos |
| Mantenimiento anual (€/año) | 1,500 | 800 | +700 | Análisis de refrigerante, inspección de bomba, reemplazo de sello |
| Reserva de reemplazo (acumulada €/año) | 600 | 900 | -300 | Una mayor vida útil de la celda reduce la contingencia de reemplazo. |
| Diferencial de prima de seguro (€/año) | -200 | 0 | -200 | Algunas aseguradoras ofrecen descuentos por sistemas refrigerados por líquido (menor clase de riesgo de incendio). |
| Costo total de propiedad neto a 10 años (€) | 582,000 | 595,000 | -13,000 | Refrigeración líquida más barata a lo largo de su vida útil, a pesar del mayor costo inicial |
Nota: La ventaja del TCO de la refrigeración líquida se amplifica en climas más cálidos (sur de Europa) y para aplicaciones de ciclos más altos. Para un sistema en el sur de Italia o España, la ventaja del TCO refrigerado por líquido aumenta a 20.000-25.000 € durante 10 años. Los sistemas refrigerados por aire siguen siendo competitivos en aplicaciones de bajo número de ciclos y climas templados, donde el coste de capital inicial es la principal limitación.
Tema Siete: La Ventana de la Batería de Iones de Sodio – ¿Es 2026 el Año en que el Almacenamiento C&I se aleja del Litio?
Contexto. La llegada comercial de las baterías de iones de sodio (Na-ion) para almacenamiento estacionario ha sido una narrativa recurrente de “el próximo año” durante varios años. Sin embargo, en 2026, la conversación ha pasado de la promesa tecnológica a la sustancia del mercado. Varios fabricantes chinos (CATL, HiNa Battery, Natron Energy) ahora ofrecen productos de Na-ion en contenedores y gabinetes con especificaciones publicadas, términos de garantía y plazos de envío. Los fabricantes de equipos originales (OEM) europeos están integrando celdas de Na-ion en sus plataformas de BESS.
Para los compradores de C&I, la pregunta ya no es “si” el ion de sodio se vuelve relevante, sino “para qué aplicaciones y con qué compensaciones”.”
Las Ventajas Convincentes
Vida útil que redefinirá la amortización de capital
Las celdas de iones de sodio están alcanzando vidas útiles demostradas de entre 10 000 y 15 000 ciclos hasta un estado de salud de 80%, en comparación con los 4 000 a 6 000 ciclos de las celdas LFP de alta gama que funcionan en condiciones equivalentes. En una aplicación C&I de alto número de ciclos; (por ejemplo, 1,5 ciclos al día, 550 ciclos al año), un sistema de iones de sodio puede funcionar teóricamente entre 18 y 27 años antes de alcanzar el umbral de capacidad 80%, frente a los 7-11 años de las de LFP.
La implicación financiera es sencilla: si la electrónica de potencia, la gestión térmica y la carcasa del sistema de almacenamiento están diseñadas para una vida útil de 20 años, una batería de ion-sodio reduce la necesidad de un reemplazo de batería a mitad de vida útil (un gasto importante que erosiona la TIR del proyecto). Para un sistema de 500 kWh, evitar un único reemplazo de batería en el año 8 ahorra aproximadamente entre 60.000 y 80.000 € en valor presente, o entre 12.000 y 16.000 € por cada 500 kWh durante 10 años.
2. Perfil de Seguridad Intrínseca
Las celdas de iones de sodio pueden descargarse completamente a 0 V sin daños irreversibles, una característica que elimina el riesgo de energía almacenada durante el transporte, la instalación y el desmantelamiento. Su temperatura de inicio de fuga térmica es significativamente más alta que la LFP (típicamente 220–250 °C frente a 160–180 °C para LFP en condiciones de abuso similares). Esto se traduce en una menor clasificación de riesgo de incendio y, potencialmente, primas de seguro reducidas una vez que los suscriptores desarrollen datos actuariales. Para aplicaciones en edificios ocupados, instalaciones subterráneas o sitios con distancias mínimas de separación, la diferencia de seguridad es material.
3. Rendimiento a Baja Temperatura Sin Penalización Energética
Las celdas de iones de sodio conservan más del 90% de su capacidad nominal a -20 °C, frente al 60-70% de las celdas LFP estándar. En los mercados nórdicos, esto elimina la necesidad de sistemas de calefacción de la carcasa que consumen entre 3 y 5% de la energía almacenada durante los meses de invierno. En el caso de un sistema de 500 kWh en Suecia o Finlandia, el ahorro en energía de calefacción y la menor complejidad del aislamiento simplifican el diseño del sistema y mejoran el rendimiento energético neto.
4. Independencia de la cadena de suministro
La cadena de suministro de materias primas para las baterías de iones de sodio —sodio, hierro, manganeso y carbono— es abundante a nivel mundial y está distribuida geopolíticamente. No existe un equivalente a la concentración de litio en Australia-Chile-China, ni a la concentración de cobalto en la República Democrática del Congo. Para los compradores industriales europeos cada vez más preocupados por la resiliencia de la cadena de suministro y el riesgo geopolítico, este argumento de diversificación resuena fuertemente.
Las compensaciones que deben evaluarse honestamente
Densidad energética y huella
Las celdas de iones de sodio funcionan actualmente a 120-150 Wh/kg a nivel de celda, frente a los 160-180 Wh/kg de las celdas LFP convencionales. A nivel de sistema (incluidos la carcasa, la gestión térmica y la electrónica de potencia), la pérdida de densidad energética volumétrica es de aproximadamente entre 25 y 35%. Para la misma capacidad nominal en MWh, una instalación de iones de sodio requiere más espacio físico, una consideración nada desdeñable en las densas zonas industriales europeas, donde los costes inmobiliarios oscilan entre 50 y 150 €/m² al año.
Cálculo de compensación: Un espacio adicional de 10 m² ocupado durante 10 años a un costo de alquiler imputado de 75 €/m²/año suma 7.500 € al costo efectivo del sistema. Si los ahorros del ciclo de vida del sistema de iones de sodio superan los 15.000 € por 500 kWh, la penalización por huella es financieramente aceptable; si los ahorros son marginales, se vuelve decisiva en contra del ion de sodio.
2. Madurez Tecnológica y Seguridad de la Garantía
Los productos de iones de sodio tienen historiales de campo limitados en entornos comerciales europeos. Las primeras instalaciones comerciales de baterías de iones de sodio a gran escala se desplegaron en 2025 y, simplemente, no existen datos de rendimiento operativo a 5 años. Los términos de garantía de los fabricantes de celdas de iones de sodio están evolucionando; algunos ofrecen garantías de 10 años con garantías de rendimiento, pero la solidez financiera del garante y la aplicabilidad de las reclamaciones de garantía transfronterizas en una clase de tecnología relativamente nueva requieren una cuidadosa diligencia legal.
3. Compatibilidad de la Integración
Las celdas de iones de sodio tienen perfiles de voltaje diferentes a las LFP (voltaje nominal típicamente de 2.8–3.1V frente a 3.2V para LFP). Esto significa que el sistema de conversión de potencia (PCS) y el sistema de gestión de batería deben diseñarse específicamente para la química de iones de sodio. Un PCS diseñado para ventanas de voltaje LFP no se puede simplemente conectar a un paquete de baterías de iones de sodio sin modificaciones de hardware y firmware. Esto limita la capacidad de intercambiar químicas en el campo y crea un riesgo de dependencia de un proveedor que debe evaluarse explícitamente.
El veredicto para 2026
Para los clientes C&I en los siguientes perfiles, el ion de sodio merece una evaluación seria:
- Aplicaciones de alto ciclo (≥2 ciclos/día) donde el costo del ciclo de vida es dominante.
- Instalaciones nórdicas y alpinas donde el rendimiento a bajas temperaturas ahorra costos de calefacción.
- Sitios de seguridad (edificios históricos, hospitales, procesamiento de alimentos) donde el menor riesgo de incendio tiene un valor más allá de las primas de seguro.
- Empresas con mandatos explícitos de diversificación de la cadena de suministro.
Para aplicaciones estándar de ciclo único en climas templados europeos, LFP sigue siendo la opción probada y optimizada en cuanto a costos en 2026. MateSolar monitorea activamente la tecnología de iones de sodio y está calificando proveedores de celdas para su integración en nuestras arquitecturas de plataforma, asegurando que cuando la tecnología alcance la paridad de precios y el estatus probado en campo —esperado en la ventana 2027-2028— exista una ruta de migración fluida para nuestros clientes.
4. Soluciones de Producto Mapeadas a los Requisitos de 2026
Las secciones anteriores han establecido una especificación detallada de lo que requiere una implementación exitosa de almacenamiento C&I en 2026: cumplimiento asegurable, capacidad de despacho de 15 minutos, cumplimiento del código de red, gestión térmica adecuada para el entorno operativo y un factor de forma física adecuado para el sitio y la aplicación. En esta sección, conectamos estos requisitos con arquitecturas de productos específicas disponibles de MateSolar, señalando las características de diseño clave que abordan los desafíos identificados anteriormente.
Para Híbridos Solares Fotovoltaicos Comerciales de Alta Eficiencia + Almacenamiento: Sistema Solar Híbrido Comercial de 500 KW
El sistema solar híbrido de 500 kW sirve como plataforma central de conversión de energía para grandes instalaciones C&I. Diseñado para las condiciones de la red europea, admite:
- Acoplamiento directo en corriente continua de las cadenas fotovoltaicas y los bancos de baterías en un bus de corriente continua común, lo que minimiza las pérdidas por conversión CA-CC-CA y mejora la eficiencia de ida y vuelta de la energía solar a la batería hasta más del 96%.
- Múltiples entradas MPPT independientes para manejar geometrías complejas de tejados comerciales con sombreado parcial.
- Cumplimiento total con los códigos de red VDE-AR-N 4110 (media tensión) y G99 (baja tensión), con documentos de certificación disponibles para la revisión de la aseguradora.
- Interfaz de programación de 15 minutos vía Modbus TCP e IEC 61850, compatible con las principales plataformas de sistemas de gestión de energía.
- Protección contra islas y capacidad de mantener la operación ante variaciones rápidas de frecuencia (RoCoF) probadas conforme a los últimos requisitos del código de red de la UE.
Para sitios de rápido despliegue y de espacio limitado: Sistema de almacenamiento de energía en gabinete exterior refrigerado por líquido de 100kW/232kWh 125kW/261kWh
Esta serie de gabinetes exteriores refrigerados por líquido aborda las demandas centrales de cumplimiento, huella y rendimiento del mercado de 2026:
- Preparado para la asegurabilidad: Enviado con un informe de prueba de incendio a gran escala a nivel de sistema UL 9540A de 6.ª edición, incluido el protocolo LSFT, aceptado por todas las principales aseguradoras de propiedades comerciales europeas.
- Conforme a IEC 63241-2Sistema de advertencia temprana de fuga térmica MQTT-SN integrado, con rutas de integración preconfiguradas para Siemens y Schneider EMS.
- Refrigeración líquida de serie: Mantiene la uniformidad de la temperatura de la celda dentro de 2 °C, lo que respalda directamente la garantía de vida útil de >6,000 ciclos y reduce la clasificación de riesgo de incendio.
- Nodos de potencia de 100 kW y 125 kW: Se ajusta a las dos clases de carga C&I europeas dominantes sin sobredimensionar ni subdimensionar.
- Expansión modularComience con un gabinete; agregue un segundo o tercero a medida que la carga crece o las condiciones arancelarias evolucionan, sin necesidad de volver a obtener permisos o rediseñar.
- Instalación rápidaIntegrado y probado en fábrica; trabajo en obra limitado a base de hormigón, conexión de CA y cable de comunicación—típicamente 1–2 días de puesta en marcha in situ.
Para Aplicaciones a Gran Escala y Sensibles al Costo: Sistema de Almacenamiento de Energía ESS en Contenedor Refrigerado por Aire de 40 Pies y 1 MWh / 2 MWh
Donde el costo de capital por kWh es el principal impulsor y la frecuencia de ciclo es moderada, el contenedor refrigerado por aire de 40 pies proporciona:
- Fiabilidad probada con millones de horas de funcionamiento en despliegues globales.
- Mantenimiento simplificado: sin circuitos de refrigeración líquida que necesiten servicio; todos los componentes accesibles desde la pasarela interior del contenedor.
- Escalable de 1 MWh a 10 MWh mediante la conexión en paralelo de contenedores, con un controlador central que gestiona la operación agregada.
- Huella ISO de 40 pies compatible con transporte estándar, despliegue rápido y reubicación sencilla si expira el contrato de arrendamiento del sitio.
Para requisitos de alta densidad y alto ciclo: Sistema de almacenamiento de energía en contenedor de 20 pies con refrigeración líquida, 3 MWh, 5 MWh
Cuando los requisitos de costo de terreno, recuento de ciclos o rendimiento impulsan el proyecto hacia el extremo de alto rendimiento del espectro, el contenedor refrigerado por líquido de 20 pies ofrece:
- 3–5 MWh por contenedor ISO de 20 pies, reduciendo a la mitad el área de terreno por MWh en comparación con soluciones refrigeradas por aire de 40 pies.
- Refrigeración líquida compatible con una vida útil de la celda de >8.000 ciclos y capacidad de carga/descarga sostenida de 1C, maximizando la captura de valor de arbitraje energético.
- Sistema integrado de supresión de incendios y detección de gases que cumple con los estándares UL 9540A 6ª edición e IEC 63241-2.
- Compatible con el inversor híbrido de 500 kW para una solución de bloque de energía completa y coordinada de fábrica.
5. Preguntas Frecuentes (PF)
La siguiente sección de Preguntas Frecuentes consolida las dudas planteadas con mayor frecuencia durante las consultas técnicas de clientes y las evaluaciones de proyectos en Europa en 2026.
Mi aseguradora está pidiendo un “informe de prueba a nivel de sistema UL 9540A 6ta edición”. El proveedor me dio un informe de prueba a nivel de celda. ¿Es eso suficiente?
No. La 6ª edición de la UL 9540A exige una prueba en el sistema completamente ensamblado en su configuración de recinto final: la prueba de incendio a gran escala (LSFT). Las pruebas a nivel de celda y módulo eran aceptables en ediciones anteriores, pero ahora son explícitamente rechazadas por las aseguradoras europeas para instalaciones nuevas. Debe obtener el informe a nivel de sistema que coincida con su modelo de equipo exacto. Verifique el número de modelo y la fecha de la prueba. Si el proveedor no puede producir este documento, su sistema no será asegurable, lo que generalmente significa que el banco no desembolsará el préstamo del proyecto.
Q2: ¿Cuál es el sistema mínimo de supresión de incendios requerido para un gabinete exterior de 1 MWh en Alemania?
Los códigos de construcción alemanes y los requisitos de las aseguradoras exigen en la práctica un enfoque de múltiples capas: (1) supresión automática a base de aerosoles o gas inerte dentro del recinto de la batería, activada por sensores de humo/gas/temperatura; (2) una conexión externa de agua (acoplamiento Storz) para uso del cuerpo de bomberos para enfriar estructuras adyacentes, no para inyección directa en la batería; (3) un panel de detección y alarma de incendios conectado al sistema principal de alarma de incendios del edificio; y (4) un interruptor de parada de emergencia externo claramente etiquetado (interruptor de bombero). Además, VdS (el laboratorio de pruebas de seguros alemán) ahora requiere la validación de toda la cadena de supresión para incendios de Clase L. Solicite el reconocimiento de VdS o una certificación equivalente al proveedor del equipo.
P3: ¿Puedo dividir legalmente mi proyecto de almacenamiento de 600 kW en tres unidades de 200 kW para obtener el procedimiento simplificado de conexión a la red de la UE?
Sí, siempre que cada unidad de 200 kW sea eléctricamente y funcionalmente independiente: cada una debe tener su propio inversor, su propio relé de protección de red con anti-islanding y su propio sistema de medición. Pueden ser despachadas de forma coordinada, pero el DNO debe verlas como tres puntos de conexión a red separados. Los primeros desafíos legales de algunos DNOs no han tenido éxito en los tribunales hasta la fecha, pero recomendamos una discusión temprana y transparente con el DNO y, si es posible, una revisión legal de la interpretación regulatoria regional específica. El umbral de 200 kW se referencia específicamente en el código de red de la UE para la conexión de instalaciones de demanda (NC DCC).
Mi negocio está en Francia. ¿Necesito hacer algo antes de agosto de 2026 para beneficiarme de TURPE 7?
Sí. De inmediato: (1) determina la zona de congestión TURPE 7 de tu instalación (de la A a la E) utilizando los mapas publicados por CRE/Enedis; (2) contrate a un consultor energético o utilice una herramienta de optimización para simular su carga cada 15 minutos, la generación fotovoltaica y la gestión del almacenamiento según la nueva lógica tarifaria de “inyección-extracción”; (3) asegúrese de que el controlador de su sistema de almacenamiento pueda aceptar y ejecutar un programa de 24 horas con una resolución de 15 minutos que se actualice a diario —a ser posible, mediante una conexión API a un servicio de previsión de tarifas—. La diferencia entre una gestión optimizada y no optimizada en el marco de TURPE 7 puede alcanzar los 40% de sus costes anuales de red, por lo que la inversión en controles adecuados se amortiza en cuestión de semanas.
P5: ¿Cuál es el período de recuperación real y verificado para un sistema de almacenamiento C&I en Alemania en 2026?
Según datos reales monitorizados de más de 50 sitios alemanes C&I agregados por un proveedor externo de M&V, el período de retorno de la inversión simple mediano para un sistema de almacenamiento acoplado a PV de 500 kW / 1 MWh en el segmento de tarifas para PYMES alemanas es de 4,2 años, con un rango de 3,5 a 5,0 años. Las variables clave que impulsan el rango son: (1) la diferencia entre los precios de la electricidad en horas pico y fuera de pico del sitio; (2) la magnitud y forma del perfil de carga del sitio; (3) la calidad de la optimización de la gestión de la PV y el almacenamiento. Los sitios con una gestión profesionalmente ajustada y consciente de intervalos de 15 minutos se agrupan consistentemente en el extremo inferior del rango (3,5-4,0 años).
P6: ¿Cómo funciona la garantía para un sistema de almacenamiento comprado en MateSolar?
MateSolar ofrece una garantía estándar de producto de 10 años y una garantía de rendimiento de 10 años para nuestros sistemas de almacenamiento de energía, con garantías específicas de rendimiento energético anual y retención de capacidad definidas en el certificado de garantía. En caso de defecto de hardware, MateSolar envía piezas de repuesto con instrucciones detalladas de instalación, lo que permite a un electricista local cualificado realizar la sustitución. Para problemas de calidad graves, se organiza la sustitución completa de la unidad. Los problemas de software son resueltos de forma remota por el equipo de soporte técnico de MateSolar, que puede acceder de forma segura al controlador del sistema para diagnosticar, reconfigurar o actualizar el firmware. Para proyectos a gran escala en contenedores, MateSolar puede desplegar ingenieros de servicio de campo en el sitio para la puesta en marcha, pruebas de integración y capacitación, asegurando que el sistema esté totalmente operativo y que el equipo operativo del cliente sea competente en el monitoreo diario y los procedimientos de emergencia.
Q7: Considero el ion-sodio para mi nueva instalación. ¿MateSolar ofrece ya productos de ion-sodio?
A partir de julio de 2026, MateSolar está calificando activamente celdas de ion de sodio de los principales fabricantes y ha prototipado su integración en nuestras plataformas de gabinetes y contenedores enfriados por líquido. Sin embargo, aún no hemos lanzado una línea de productos comercial de iones de sodio porque creemos que la tecnología necesita entre 12 y 18 meses adicionales de validación en campo antes de que podamos ofrecer el mismo nivel de confianza en la garantía y documentación de bancabilidad que ofrecemos para nuestros productos LFP. Esperamos anunciar una opción de ion de sodio en nuestra cartera de productos durante 2027, inicialmente dirigida a aplicaciones de alto ciclo y de clima frío. Nuestros sistemas LFP están diseñados con una arquitectura de voltaje y comunicación que facilita una futura ruta de actualización de módulos de ion de sodio, protegiendo la inversión de nuestros clientes en el balance del sistema.
Q8: ¿Cuál es el tiempo de entrega para un sistema de gabinete exterior de 1 MWh en julio de 2026?
El tiempo de entrega estándar es de 8 a 10 semanas a partir de la confirmación del pedido y la recepción del depósito, asumiendo que no hay personalizaciones inusuales. El sistema se envía completamente ensamblado y probado de fábrica. El flete marítimo a los principales puertos europeos (Rotterdam, Hamburgo, Amberes, Barcelona) añade de 4 a 5 semanas. El transporte terrestre al sitio y la puesta en marcha de la instalación añaden de 1 a 2 semanas. Los clientes deben presupuestar un plazo total de 14 a 17 semanas desde el pedido hasta el estado operativo, incluido el envío. El tiempo de aprobación de la conexión a la red es adicional y se ejecuta en paralelo con la entrega del equipo; recomendamos encarecidamente presentar la solicitud de red al mismo tiempo que el pedido del equipo para evitar tiempos de inactividad en el sitio.
6. Conclusión: Un mercado a gran escala exige un socio a gran escala
El mercado europeo de almacenamiento de energía comercial e industrial en julio de 2026 no es una oportunidad emergente: es una clase de infraestructura establecida y en rápida expansión, con requisitos de cumplimiento definidos, expectativas sofisticadas de los clientes y un riguroso escrutinio financiero. Las 12,4 GWh de instalaciones proyectadas para este año duplicarán la base instalada, y la maquinaria regulatoria ahora está calibrada para un crecimiento sostenido hasta 24 GWh para 2028. El Acuerdo Tripartito de Almacenamiento de Energía de la UE ha proporcionado la certeza política que exigen los inversores. La reforma TURPE 7 en Francia, los mandatos de tarifas dinámicas en Alemania, la liquidación del mercado a 15 minutos y el nuevo marco de cumplimiento de seguros crean colectivamente un entorno de mercado donde equipos de calidad, debidamente certificados y despachados inteligentemente, ofrecen retornos atractivos ajustados al riesgo.
Los desafíos son igualmente claros: la asegurabilidad es el nuevo guardián; los cuellos de botella en la conexión a la red castigan el retraso en la ejecución del proyecto; y la demanda del director financiero de retornos verificables elimina márgenes para promesas vagas. El éxito en este mercado requiere un socio que ofrezca productos certificados de fábrica y aceptados por los aseguradores; que comprenda los detalles arcanos de VDE, G99, TURPE y BS 7671; y que ofrezca la amplitud de productos para adaptarse a la aplicación, desde un gabinete exterior refrigerado por líquido de 100 kW para un centro logístico en Italia, hasta un sistema solar híbrido de 500 kW para una fábrica en Alemania, hasta un bloque de contenedores refrigerado por líquido de 5 MWh para un campus de centro de datos en los Países Bajos.
MateSolar es ese socio. Como proveedor integral de soluciones fotovoltaicas y de almacenamiento de energía, MateSolar combina una profunda ingeniería de productos, experiencia en cumplimiento normativo europeo y un compromiso con el soporte técnico que respeta la realidad de las operaciones de nuestros clientes. Nuestra línea de productos, que abarca el Sistema Solar Híbrido Comercial de 500 KW, el Sistema de Almacenamiento de Energía en Gabinete Exterior Refrigerado por Líquido de 100 kW/232 kWh y 125 kW/261 kWh, el Sistema de Almacenamiento de Energía en Contenedor Refrigerado por Aire de 40 pies de 1 MWh y 2 MWh, y el Sistema de Almacenamiento de Energía en Contenedor con Refrigeración Líquida de 20 pies de 3 MWh y 5 MWh, cubre el espectro completo de potencia y energía del mercado C&I. Cada producto está diseñado desde cero para las condiciones de red europeas, certificado según las últimas normas de seguros y seguridad, y respaldado por una infraestructura de soporte técnico remoto que mantiene los sistemas funcionando al máximo rendimiento.
Ya sea que sea un CFO evaluando su primera inversión en almacenamiento, un contratista EPC que busca un socio de equipos confiable para una cartera de proyectos, o un gerente de instalaciones encargado de garantizar la continuidad del negocio y el control de los costos de energía, lo invitamos a comunicarse con nuestro equipo de ventas técnicas para un análisis detallado y específico del sitio. La economía es convincente. La ruta de cumplimiento está definida. La tecnología está madura. El momento de implementar es ahora.
MateSolar – Proveedor integral de soluciones fotovoltaicas y de almacenamiento de energía.