


















Pulling back the curtain on PV-ESS-EV charging stations — and explaining, in operator-grade depth, the configuration blueprint and the most economic dispatch logic that turns a solar carport, a battery cabinet, and a row of DC fast chargers into a profitable, grid-friendly energy asset across the North American, European, and Central American commercial and industrial storage markets in 2026.
Introduction: Why PV+ESS+EV Charging Is the Hottest Conversation in C&I Energy
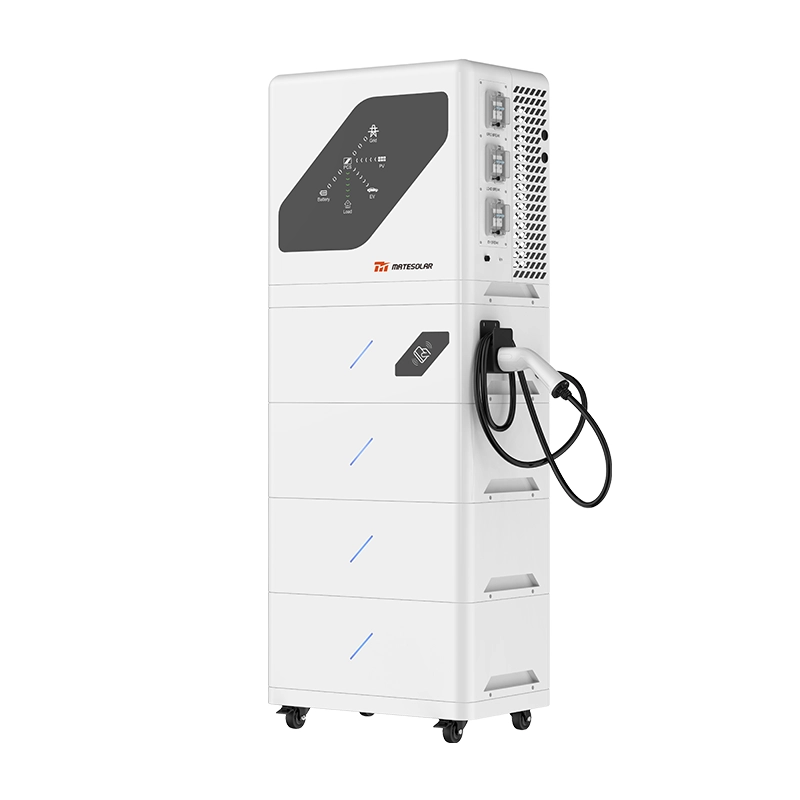
If you walk through any major logistics hub, fleet depot, big-box retail parking lot, or highway rest area in the United States, Germany, the Netherlands, Mexico, or Costa Rica in 2026, the silhouette of the site is changing. What used to be a flat asphalt lot with a transformer pad and a row of grey metal dispensers is now a three-layer energy system: a steel canopy overhead producing electricity from sunlight, a battery cabinet on a concrete plinth buffering that electricity, and a bank of high-power DC chargers delivering it to electric vehicles at 240 kW, 360 kW, 480 kW, or even 720 kW per stack. We call this stack a PV+ESS+EV charging station, sometimes shortened to "PV-ESS-EV" or simply "solar-plus-storage charging hub." It is, in the most literal sense, a power plant, a battery, and a gas station rolled into one steel-and-silicon box.
It is also the single most discussed configuration in the commercial and industrial (C&I) energy storage market in 2026 — and for good reason. Electricity tariffs in California, Texas, New York, Germany, the UK, the Nordics, and parts of Mexico have moved from "flat and boring" to "spiky and punitive." Demand charges on commercial accounts routinely clear $20/kW/month, and on the worst summer afternoons in places like San Diego, Phoenix, Houston, Madrid, or Milan, the marginal energy cost at 4 p.m. can be three to six times higher than at 2 a.m. EV adoption, meanwhile, is no longer a forecast — it is a present-tense operational reality. Fleets are electrifying. Highway corridors are electrifying. The only thing that has not caught up is the grid, and the only thing that has not made economic sense to the operator is the cost of a peak hour that the operator could have, in principle, avoided.
This article exists to do three things, and to do them at a level of detail you will not find aggregated anywhere else in English on the open web in mid-2026. First, we are going to pull back the curtain on the physical system topology of a modern PV+ESS+EV charging station — what every box is, what it does, why it sits where it sits, and how AC coupling compares with DC coupling. Second, we are going to walk through the most economic dispatch logic that real operators in California, Texas, Bavaria, the Randstad, and central Mexico are actually running on their energy management systems in July 2026 — including peak shaving, valley filling, anti-backflow (anti-export), dynamic load following, and the new demand-charge arbitrage rules of the post-IRA, post-Fit-for-55 era. Third, we are going to put a hard, defensible number on the capital and operating economics of going PV+ESS+EV versus a traditional grid-tied charging station, with side-by-side tables, a worked ROI example, and a candid discussion of the mistakes that turn a great idea into a stranded asset.
Before we go further, a short framing note on scope and timing. The information below reflects the state of the North American (US, Canada, and Mexico for the purposes of this article), European (EU-27 plus UK, Norway, Switzerland, and the Western Balkans where tariff structures permit), and Central American (excluding Brazil and Cuba, per the editorial scope of this piece) commercial and industrial energy storage markets as of July 2026. Tariff tables, incentive schedules, hardware specifications, and interconnection rules change frequently — sometimes quarterly. We have anchored the analysis to the most current public data we can verify, and where a number is moving fast we have flagged it. Treat every dollar and euro figure as a planning estimate and confirm with a licensed engineer, EPC, or local utility before you sign a purchase order.
One more framing note. The audience for this article is the site host, the fleet operator, the charge point operator (CPO), the EPC project developer, the municipal sustainability lead, and the investor doing diligence on a behind-the-meter (BTM) or front-of-the-meter (FTM) charging project. We assume you already know what a kilowatt-hour is, what a demand charge is, and that lithium iron phosphate (LFP) is the chemistry that won the 2020s. We are not going to waste your time on first principles. We are going to spend it on topology, dispatch, and dollars.
Let's open the cabinet.
Chapter 1 — PV+ESS+EV Charging Station System Topology
A PV+ESS+EV charging station looks, from the parking lot, like four things: a steel canopy, a battery cabinet, a row of chargers, and a transformer on a pad. Underneath the asphalt and inside the steel, it is a tightly engineered AC or DC microgrid with six functional blocks. Understanding these six blocks — and the order in which their power flows — is the difference between a station that prints money and a station that bleeds it.
1.1 The Box Transformer (Pad-Mounted Step-Up Transformer)
The first block is the box transformer, sometimes called a pad-mount transformer or simply "the pad." In a North American context this is almost always a 500 kVA to 2,500 kVA pad-mounted oil or dry-type transformer stepping 480 V (or 600 V in Canada) up to 12.47 kV, 13.8 kV, 25 kV, or 34.5 kV for the local utility's medium-voltage (MV) distribution feeder. In a European context the LV side is typically 400 V three-phase and the MV side is 10 kV, 11 kV, 15 kV, or 20 kV depending on the DSO. In a Central American context — for example in Mexico, Guatemala, Honduras, or Costa Rica — the LV side is generally 480 V three-phase (with some legacy 220 V three-phase sites) and the MV side is 13.8 kV, 23 kV, or 34.5 kV.
Why do you need it, and why does it matter in 2026? Two reasons. First, almost every modern PV+ESS+EV site is grid-tied, and the local distribution feeder is medium voltage. You must step the site's low-voltage AC bus up to MV before you can export (or import) at scale. Second, and this is the more subtle reason, the transformer dictates the nameplate interconnection capacity of the site. That capacity is the hard ceiling on what the local utility will allow you to import, and it is the number you must defend at the interconnection study. A 1,000 kVA pad with a 1,000 kW nameplate import is not the same interconnection study as a 1,500 kVA pad with a 1,500 kW nameplate import, and the difference can mean six to eighteen months in queue position in constrained California ISO (CAISO), ERCOT, or PJM zones. We will come back to this point in Chapter 5 when we talk about right-sizing.
Three practical operator notes. First, if you are building on a greenfield site, buy a transformer with at least 25% headroom above your peak coincident load. A 480 kW charger stack with a 500 kVA transformer is a 4% margin and an operational nightmare. Second, if you are building in a constrained utility zone (San Diego Gas & Electric, Southern California Edison, Pacific Gas & Electric, Oncor, CenterPoint, National Grid NY, UK Power Networks, E.ON Netz, or CFE in northern Mexico), confirm in writing that the box transformer you are quoting is on the utility's approved-equipment list. Third, for behind-the-meter projects where you want to keep the option of exporting later, oversize the LV bus bar and the protection relay — the marginal cost is small now and large later.
1.2 The Integrated Control Cabinet (Smart Integrated Power Cabinet)
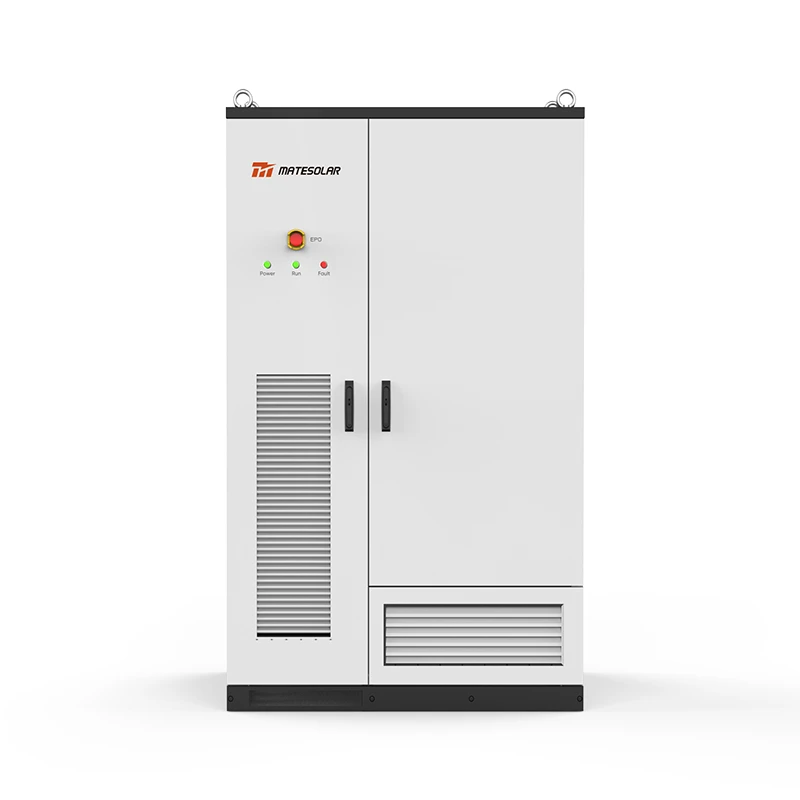
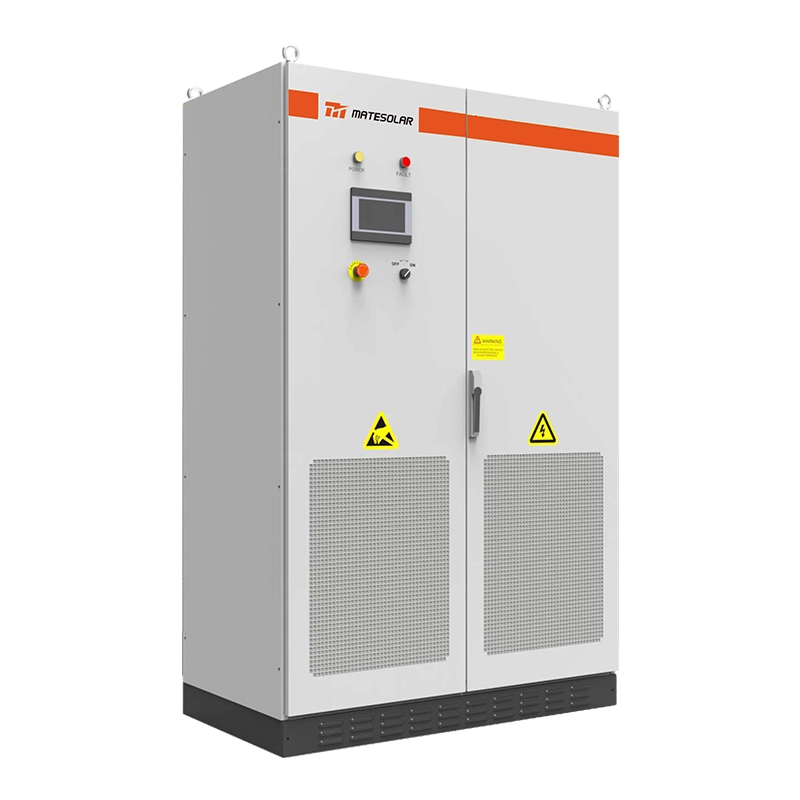
The second block, and the one most often under-spec'd by first-time developers, is the integrated control cabinet — often branded as a "smart integrated power cabinet," an "AC convergence cabinet," a "PV+ESS+EV convergence cabinet," or simply the "site AC combiner panel." Physically it is a floor-standing IP54 (indoor) or IP55 (outdoor) steel enclosure, typically 800 mm wide, 800 mm deep, and 2,000 mm tall, that sits between the AC outputs of the PV inverter(s), the PCS (power conversion system) of the ESS, the chargers' AC input, and the LV side of the box transformer.
The cabinet has three jobs. Job one is AC convergence — physically landing the AC cables from the PV inverter, the ESS PCS, the chargers, and (if present) a diesel generator or a second transformer onto a common 400/480 V bus bar through properly coordinated molded-case circuit breakers (MCCBs) and a main breaker. Job two is site-level protection and metering — housing the main circuit breaker, the residual current device (RCD) or ground-fault detection, the surge protection device (SPD), the revenue-grade meter (or the CTs and PTs for a separate meter), and the power quality meter that records harmonics, voltage sag, and flicker. Job three, and the one that has become mission-critical since 2023, is site-level control — housing the site controller, the protocol gateway (Modbus TCP, Modbus RTU, IEC 61850, Sunspec, OCPP 1.6J / 2.0.1, and increasingly IEEE 2030.5 / OpenADR 3.0 for utility dispatch), the HMI touchscreen, and the fiber or 4G/5G router that connects the site to the cloud EMS.
In 2026, a well-specified integrated control cabinet on a 1 MW-class PV+ESS+EV site typically includes: a 1,600 A to 2,500 A main breaker, four to eight branch breakers in the 250 A to 800 A range, a Schneider, ABB, Eaton, or Siemens PLC or industrial controller, a multi-function power meter (Schneider PM5560, ABB M4M 30, or equivalent), an OCPP-compliant charge point management backhaul, and a Sungrow, SMA, or Huawei Smart Logger / Smart Energy Center-style plant controller. The cabinet should also be designed for a 50°C ambient rating (relevant for Texas, Arizona, central Spain, and northern Mexico in summer), a 95% non-condensing humidity rating (relevant for the Gulf Coast, the Caribbean coast of Central America, the UK, and the Low Countries), and a 1,000 m altitude derating note if the site is above 1,000 m (relevant for the US Mountain West, the Mexican Altiplano, and parts of central Spain).
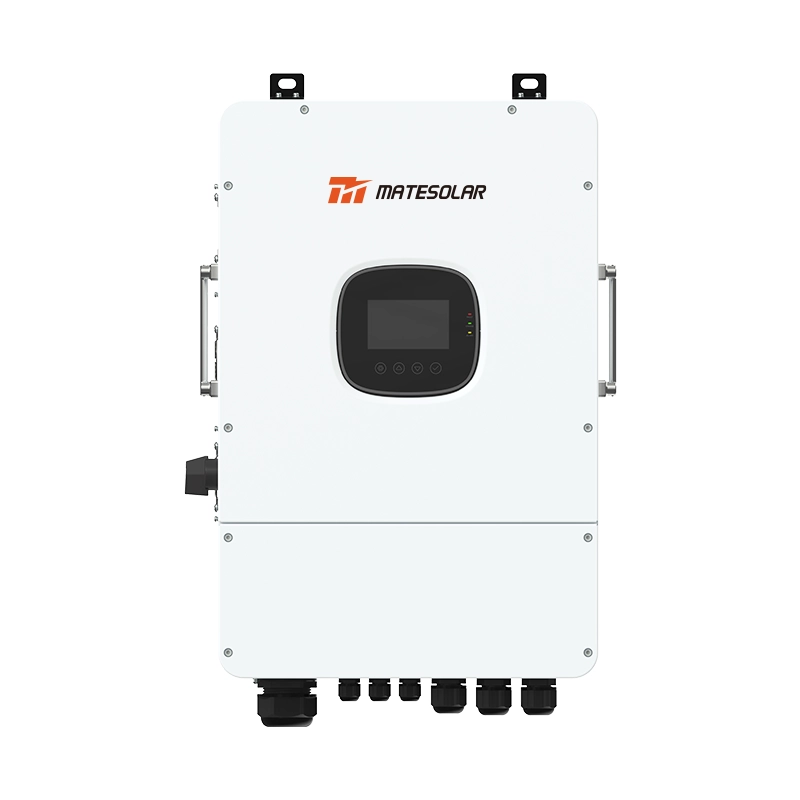
For sites that want to scale to 2 MW or more, the integrated control cabinet often becomes two cabinets — a convergence cabinet and a control cabinet — separated for thermal management and serviceability. This is the configuration we recommend on every MateSolar 40 ft container ESS and 20 ft container ESS deployment, and it is the same architecture used on the نظام الطاقة الشمسية الهجين التجاري بقدرة 500 كيلوواط product family.
1.3 The ESS Cabinet (Battery Energy Storage System)
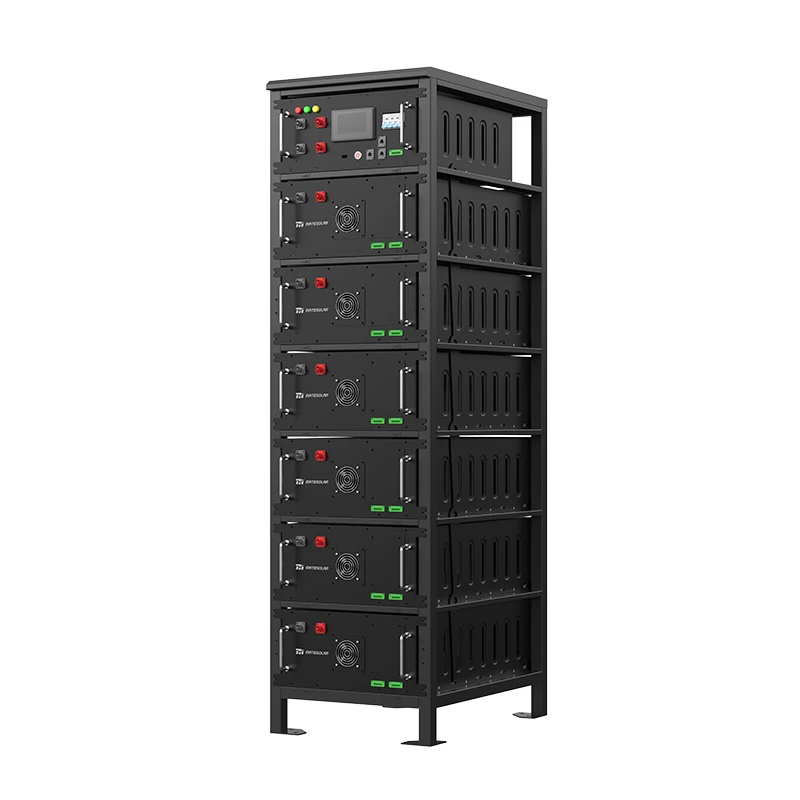
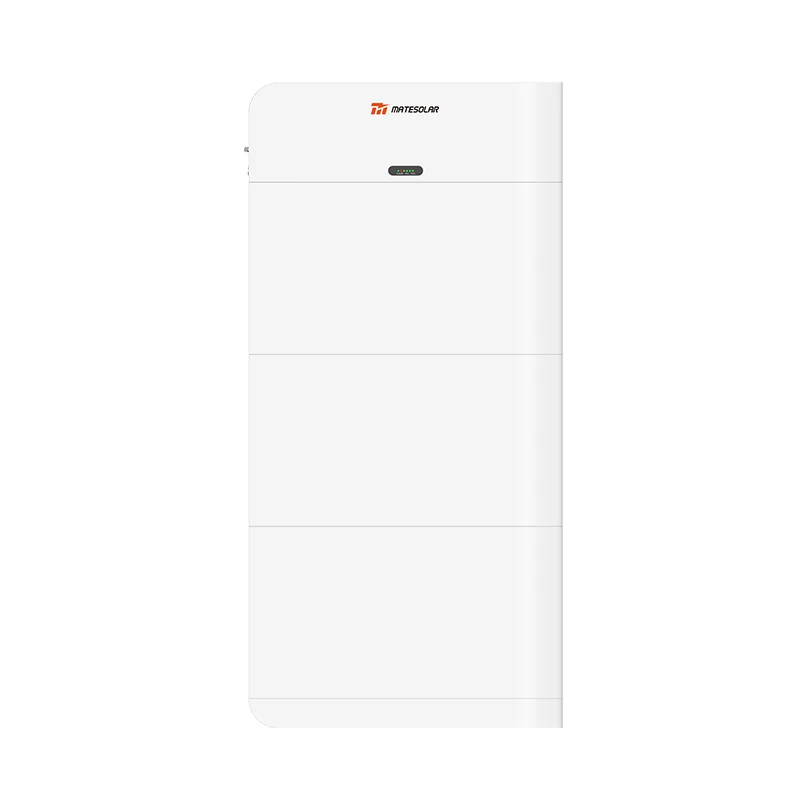
The third block is the ESS cabinet, and in 2026 it is the single most visible piece of hardware on the site. In a small commercial PV+ESS+EV site (under 500 kW PV, under 1 MWh storage), the ESS typically ships as one or two outdoor liquid-cooled cabinets on a concrete plinth, each rated 100 kW to 250 kW and 215 kWh to 522 kWh. In a medium commercial site (500 kW to 2 MW PV, 1 MWh to 4 MWh storage), the ESS typically ships as one or two 40 ft air-cooled or liquid-cooled containers. In a large C&I or utility-adjacent site (2 MW to 20 MW PV, 4 MWh to 50 MWh storage), the ESS is almost always a fleet of 20 ft or 40 ft liquid-cooled containers, often paired with a dedicated medium-voltage skid and a SCADA-integrated fire suppression system.
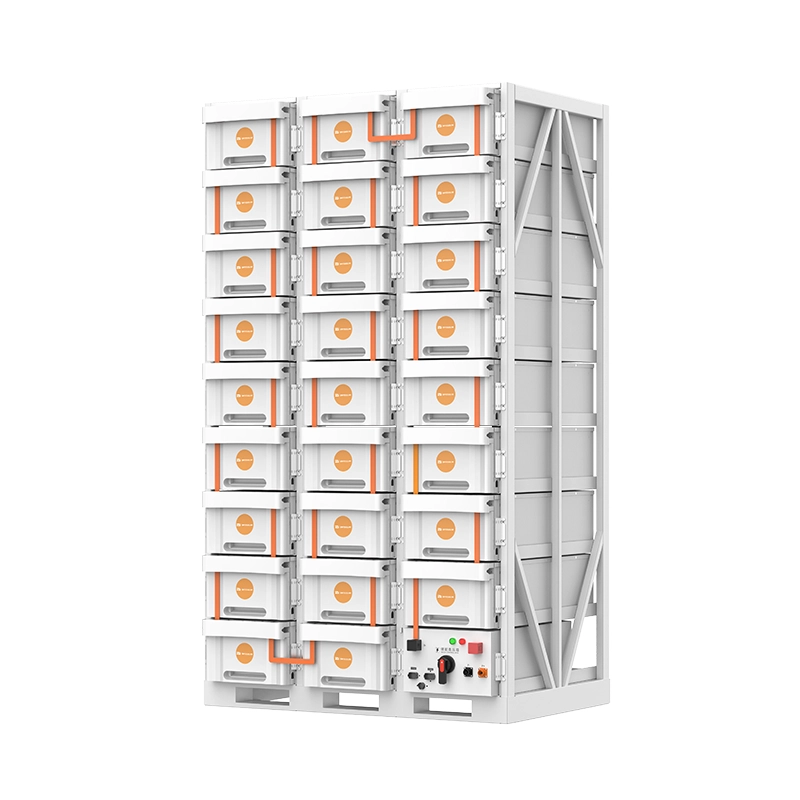
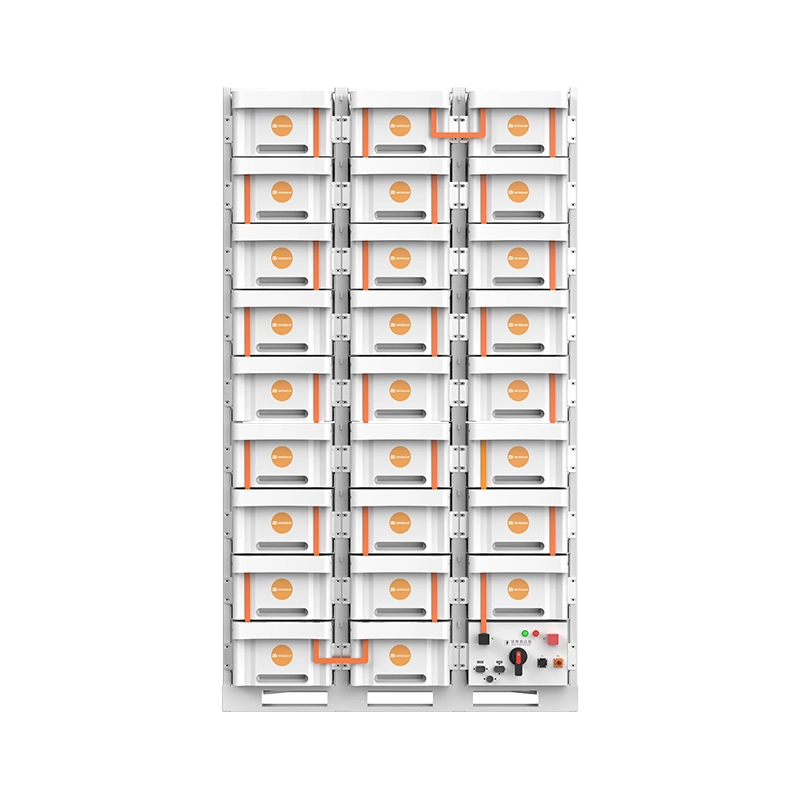
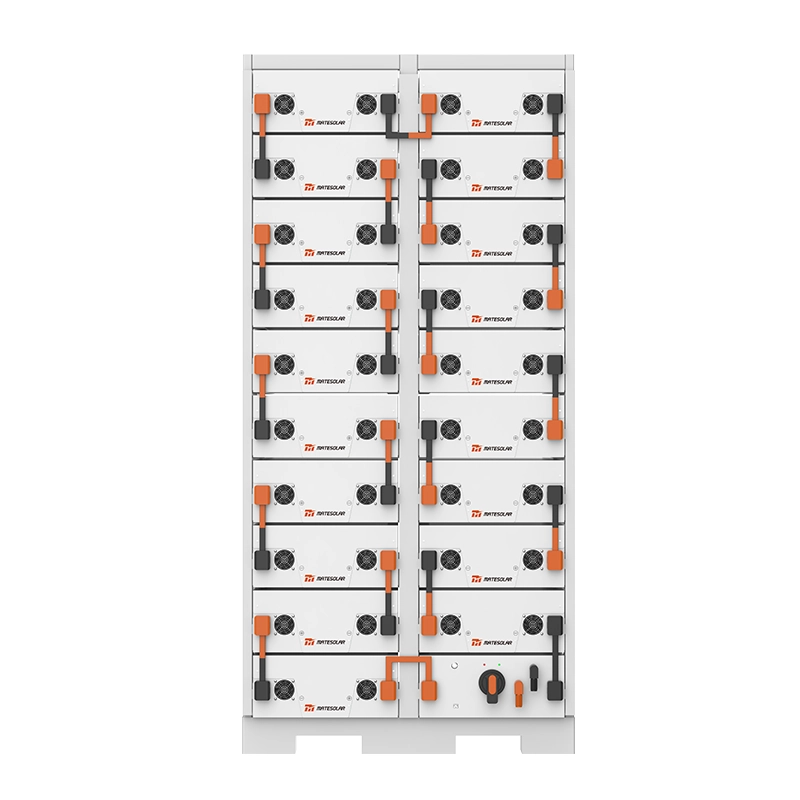
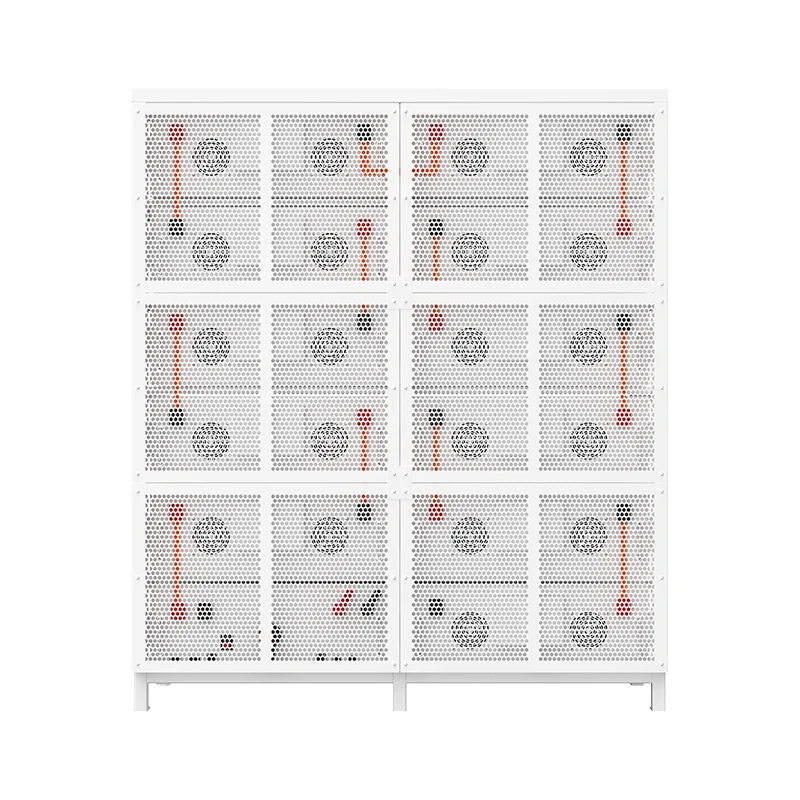
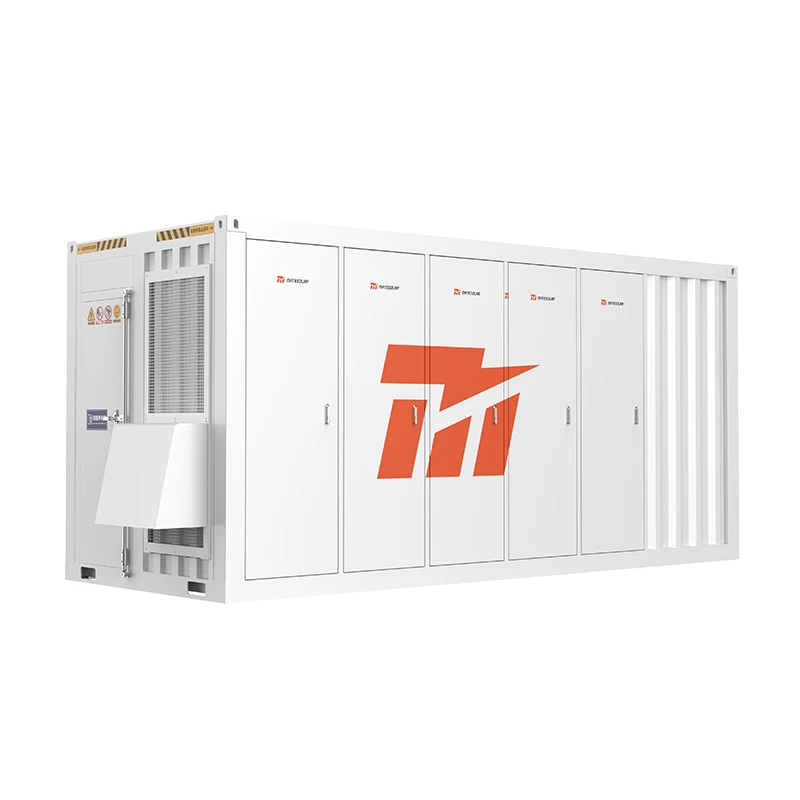
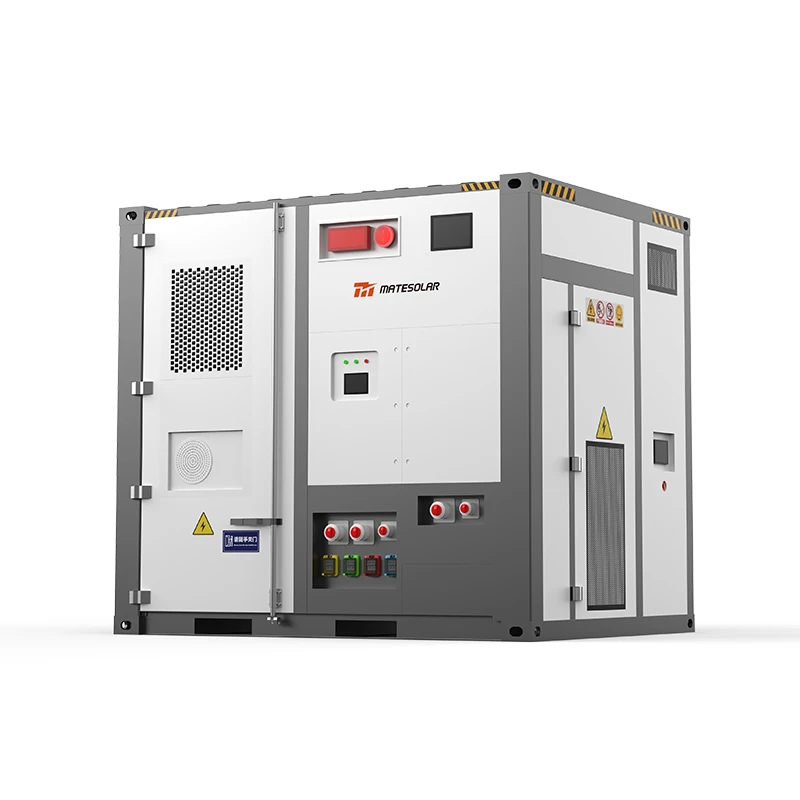
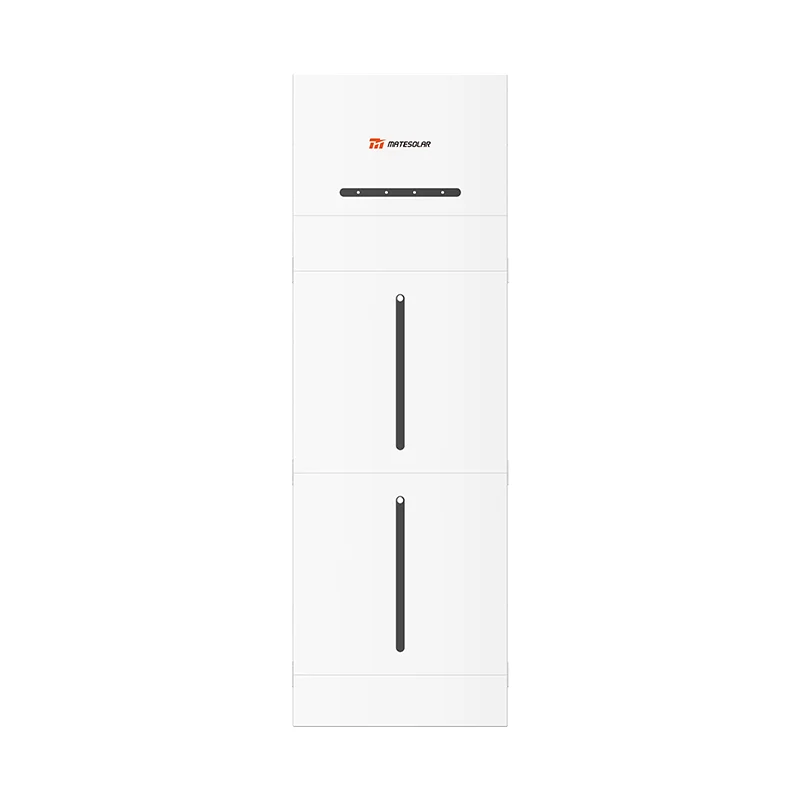
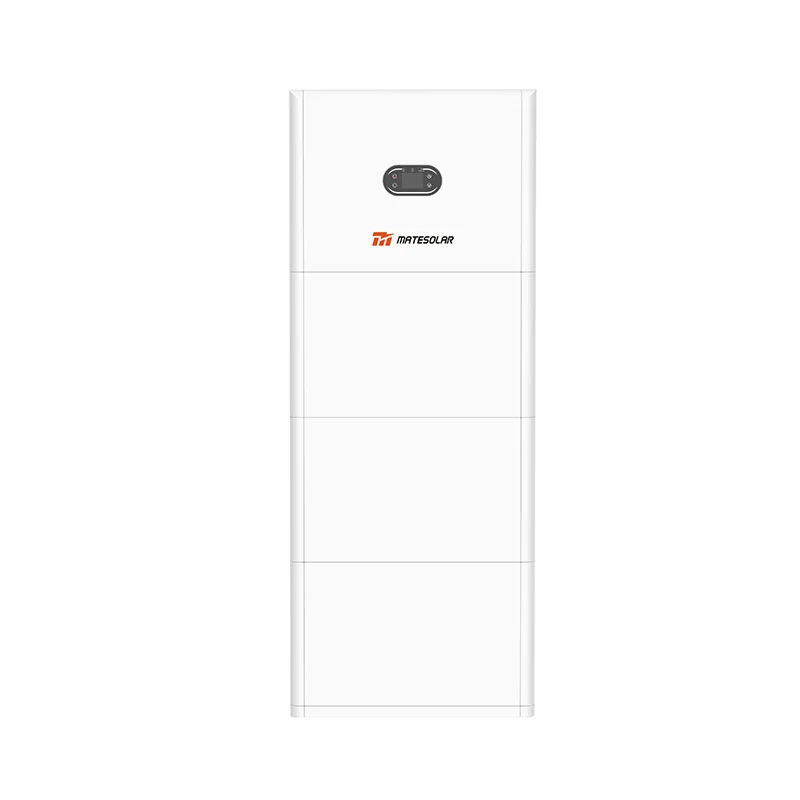
Three architectures dominate the 2026 market. Architecture A — outdoor liquid-cooled cabinet: 100 kW to 215 kW PCS, 215 kWh to 522 kWh LFP, IP55 outdoor rating, integrated liquid cooling, integrated BMS, integrated fire suppression (aerosol or Novec 1230 / FK-5-1-12), integrated HVAC, integrated EMS gateway. This is the form factor used on the MateSolar نظام تخزين طاقة خارجي مبرد بالسائل بخزانة 100 كيلوواط/232 كيلوواط ساعي و 125 كيلوواط/261 كيلوواط ساعي line, and it is the workhorse of the small and mid-commercial segment. Architecture B — 40 ft air-cooled container: 500 kW to 1,250 kW PCS, 1 MWh to 2 MWh LFP, ISO 40 ft high-cube container, integrated HVAC, integrated fire suppression, integrated BMS, integrated EMS, designed for grid-scale or large C&I duty cycles. This is the form factor used on the MateSolar نظام تخزين الطاقة حاويات 40 قدم 1 ميجاوات ساعة 2 ميجاوات ساعة مبرد بالهواء family. Architecture C — 20 ft liquid-cooled container: 1.5 MW to 2.5 MW PCS, 3 MWh to 5 MWh LFP, ISO 20 ft high-cube container, integrated liquid cooling, integrated HVAC, integrated fire suppression, integrated BMS, integrated EMS, designed for utility-scale duty cycles with daily deep cycling. This is the form factor used on the MateSolar نظام تخزين الطاقة في حاوية تبريد سائلة بقدرة 20 قدمًا بقدرة 3 ميجاوات ساعة بقدرة 5 ميجاوات ساعة family.
Which architecture you pick depends on three questions. Question one — what is your peak coincident load and your daily energy throughput? If you are a fleet depot cycling the battery once per day at 0.5C to 0.8C and you need 1 MWh to 2 MWh, Architecture B is the most cost-effective. If you are a highway corridor running two cycles per day and you need 3 MWh to 5 MWh, Architecture C is the most cost-effective. If you are a small commercial site with one charger and one PV canopy, Architecture A is the most cost-effective. Question two — what is the local fire code? NFPA 855 in the US, EN 50549 / VDE-AR-E 2510 in Germany, CEI 0-16 in Italy, and NOM-001-SEDE in Mexico all impose setback, ventilation, and fire suppression rules that can push a small project from a cabinet to a container. Question three — what is the ambient? If the site routinely sees 45°C to 50°C summer peaks (Phoenix, Las Vegas, Hermosillo, Seville, Baghdad-equivalent latitudes), you want liquid cooling. If the site sees -20°C winter lows (Alberta, Manitoba, the Nordics, the Alps), you also want liquid cooling, because passive air cooling cannot keep cells above 5°C to 10°C on a cold morning without an aggressive heater duty cycle that destroys round-trip efficiency.
1.4 The PV Carport (Solar Canopy)
The fourth block is the PV carport — sometimes called a solar canopy, a solar parking structure, or simply the carport. In 2026 this is the single most underutilized asset on most C&I sites in North America, Europe, and Central America, and it is also the one with the highest aesthetic and political value. A well-designed PV carport does five things at once: it produces electricity from a footprint that is already paved, it shades cars (which matters in Phoenix, Houston, Madrid, and Panama City), it provides weather protection for chargers and for customers, it signals to the local community that the operator is serious about decarbonization, and — when paired with a battery — it produces electricity at the time of day when it is most valuable.
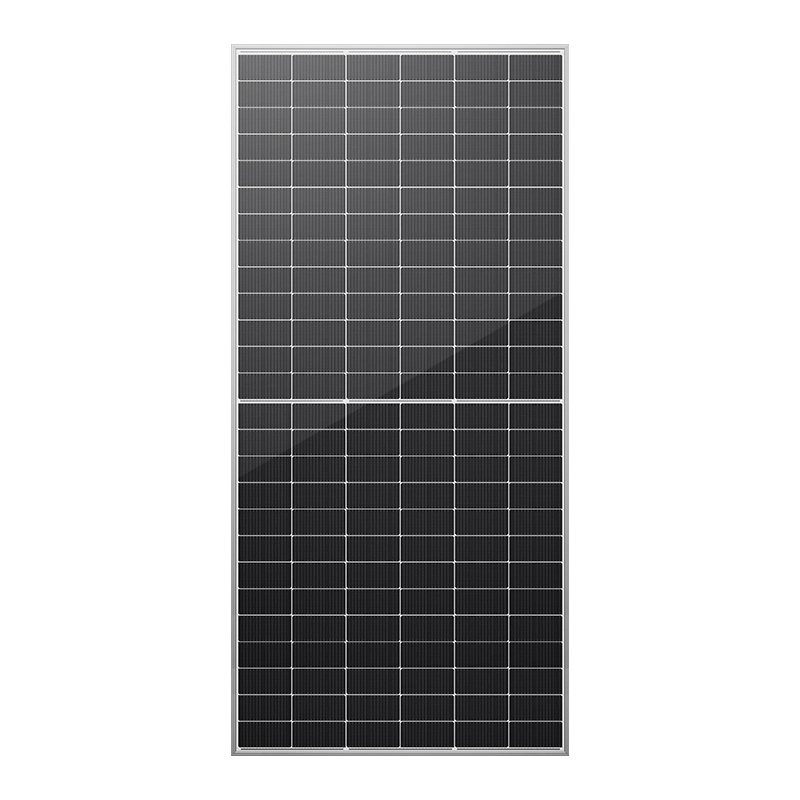
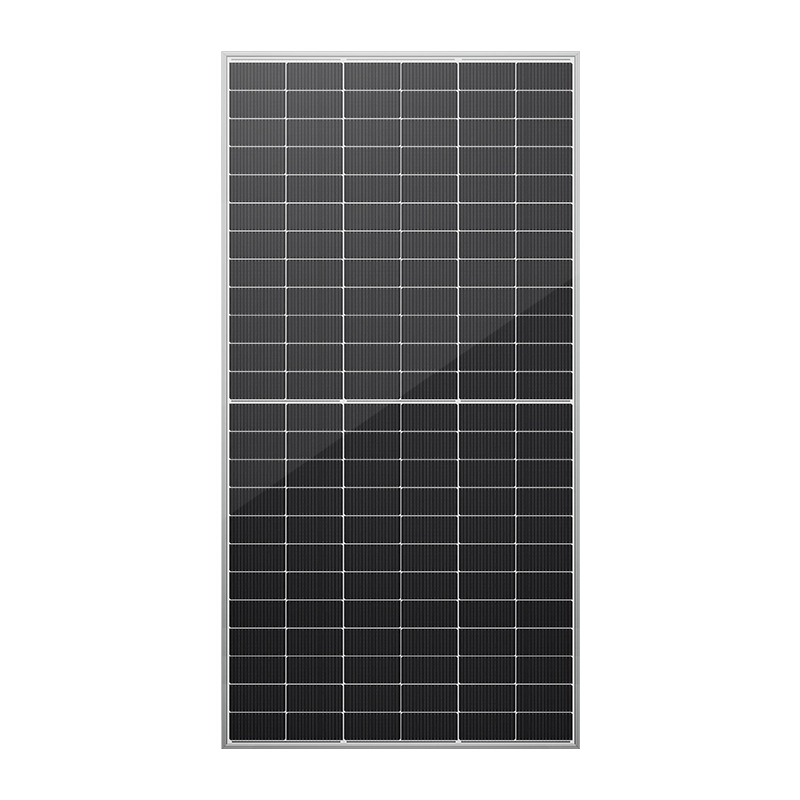
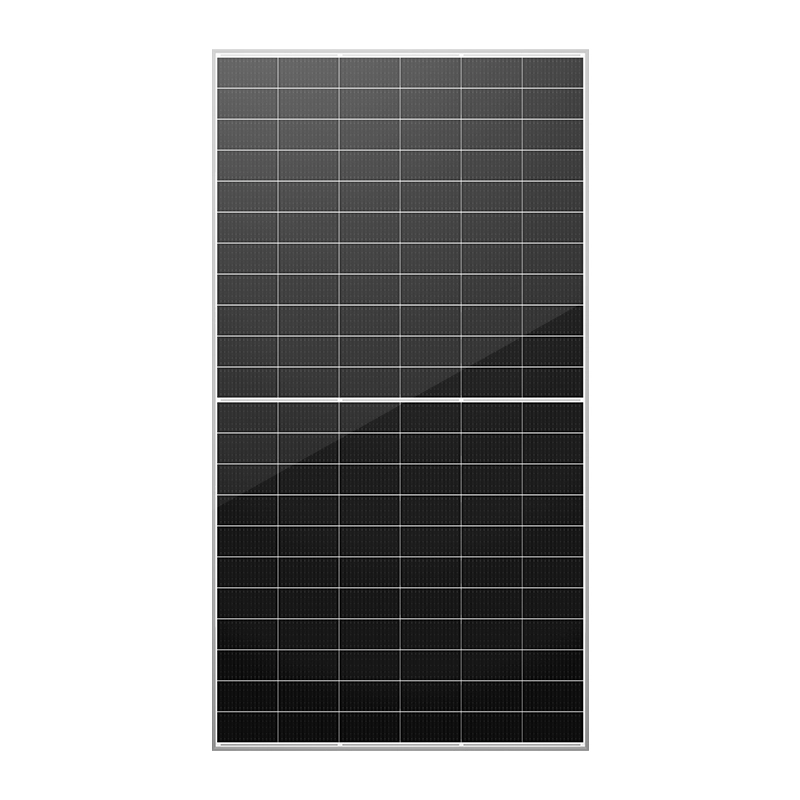
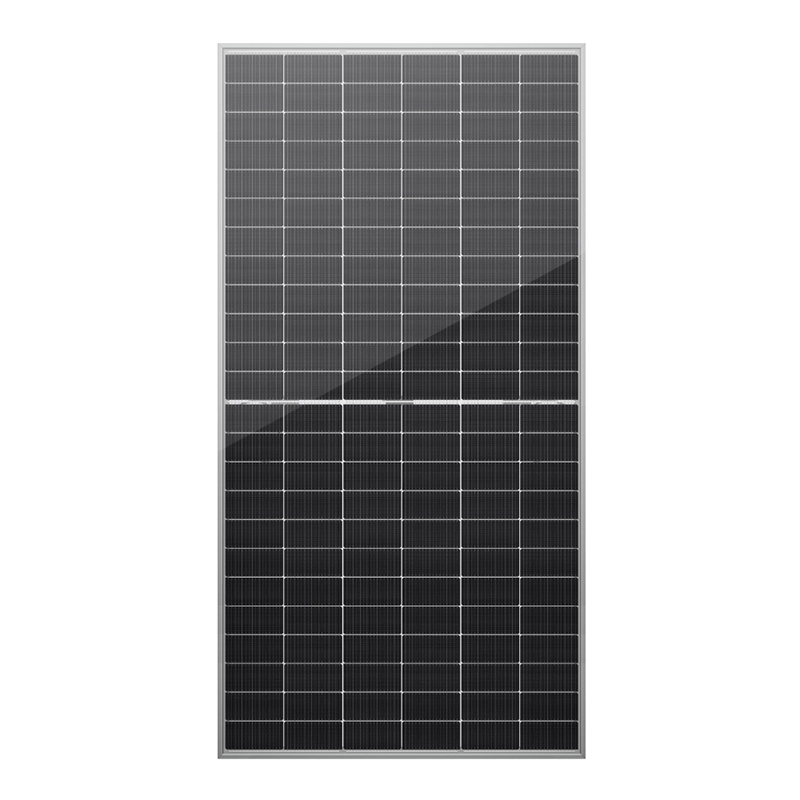
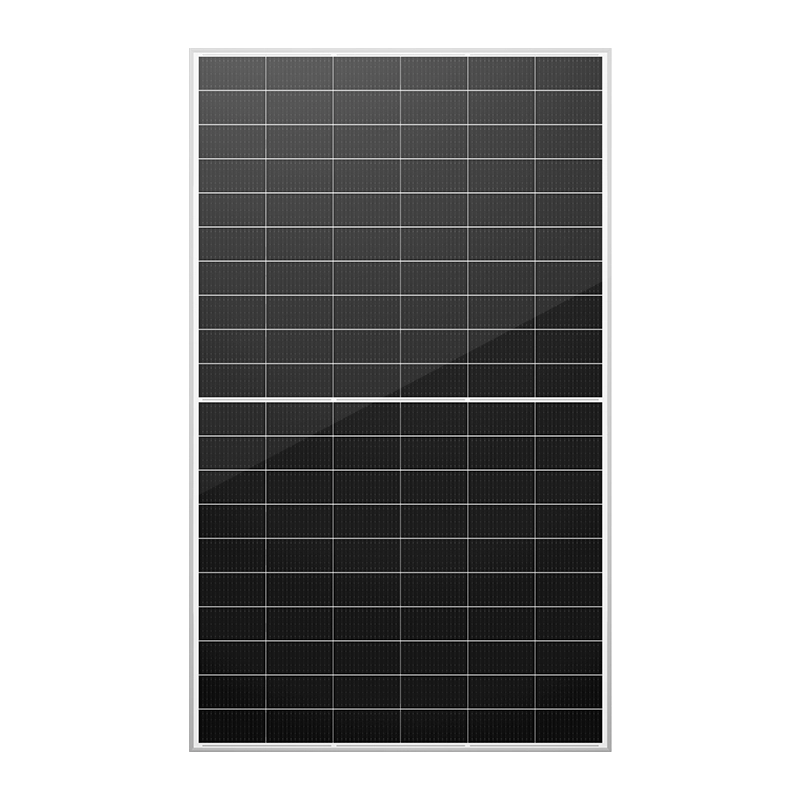
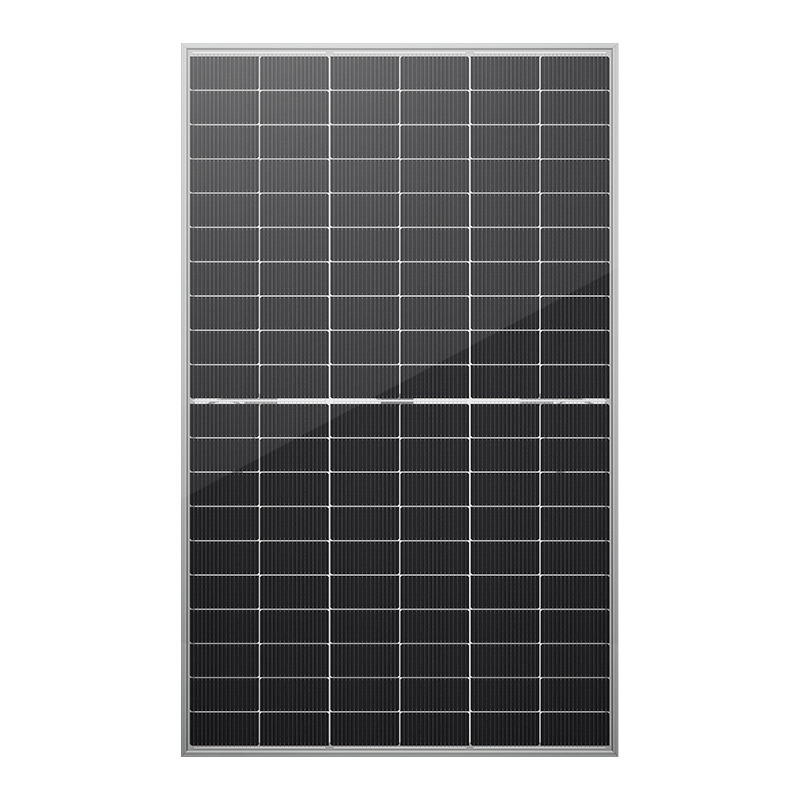
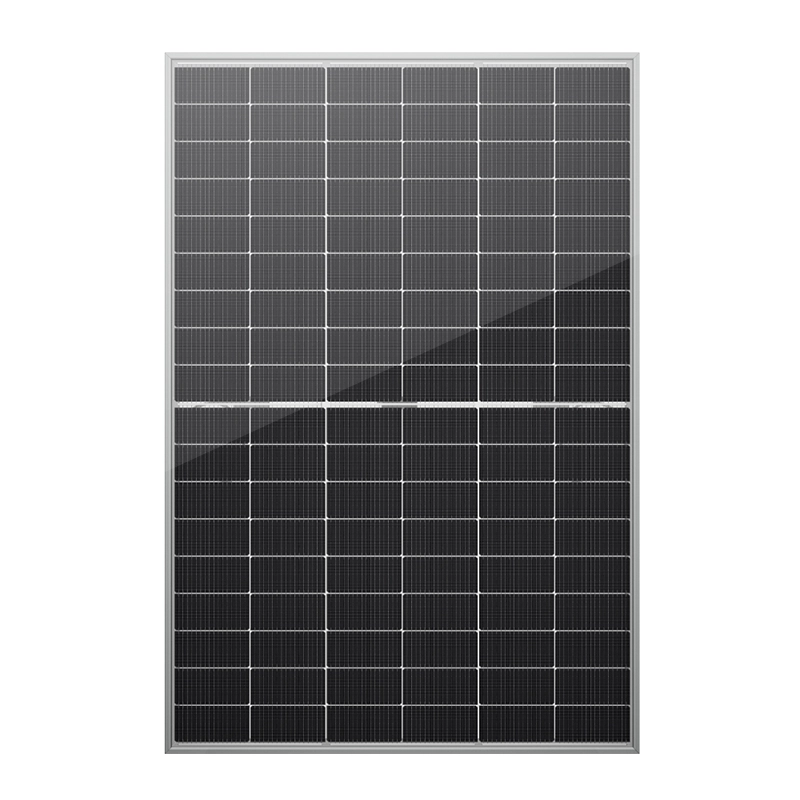
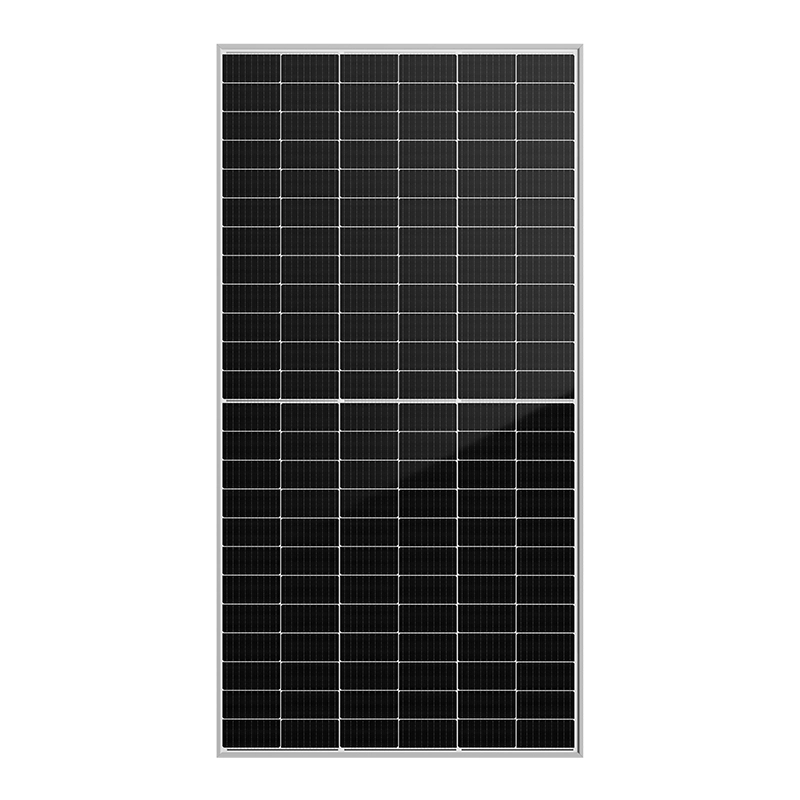
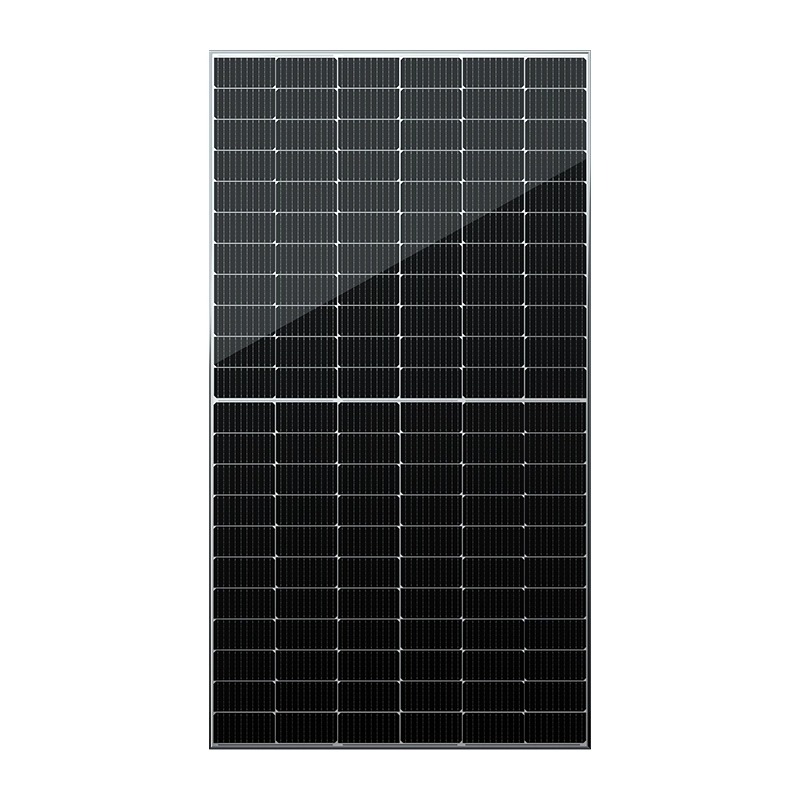
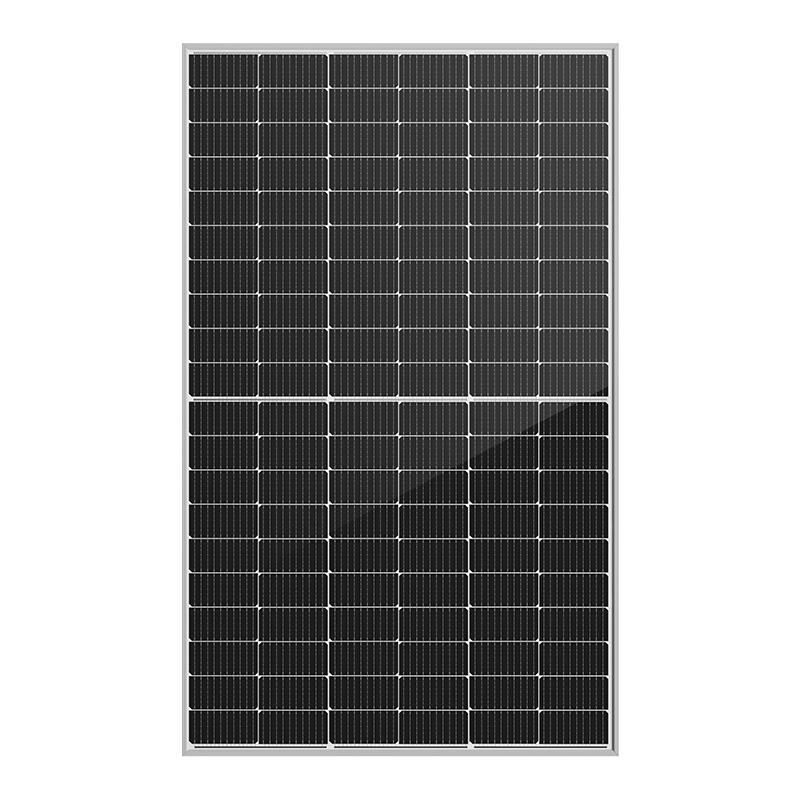
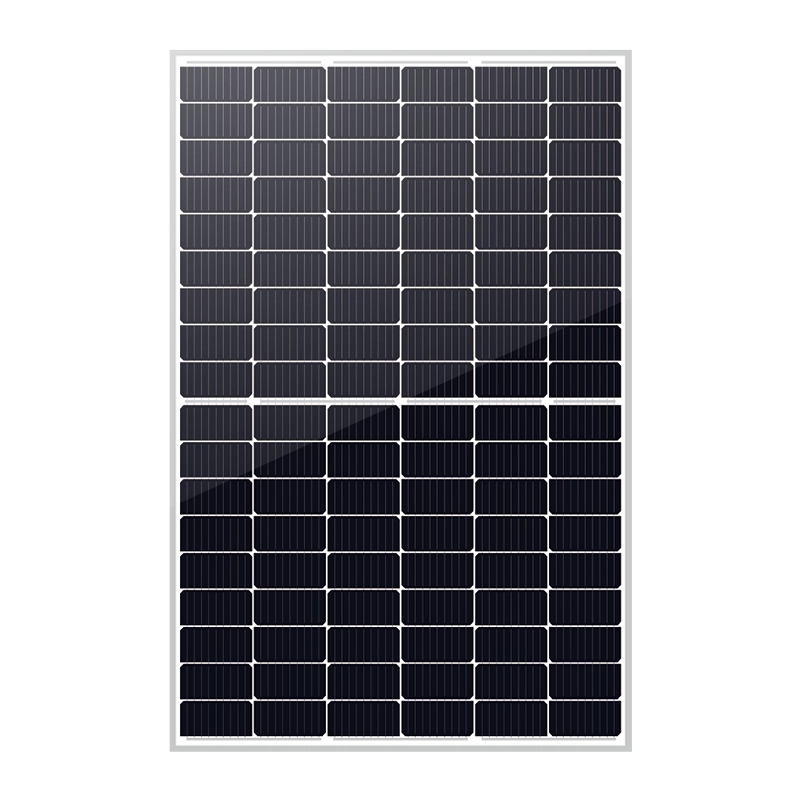
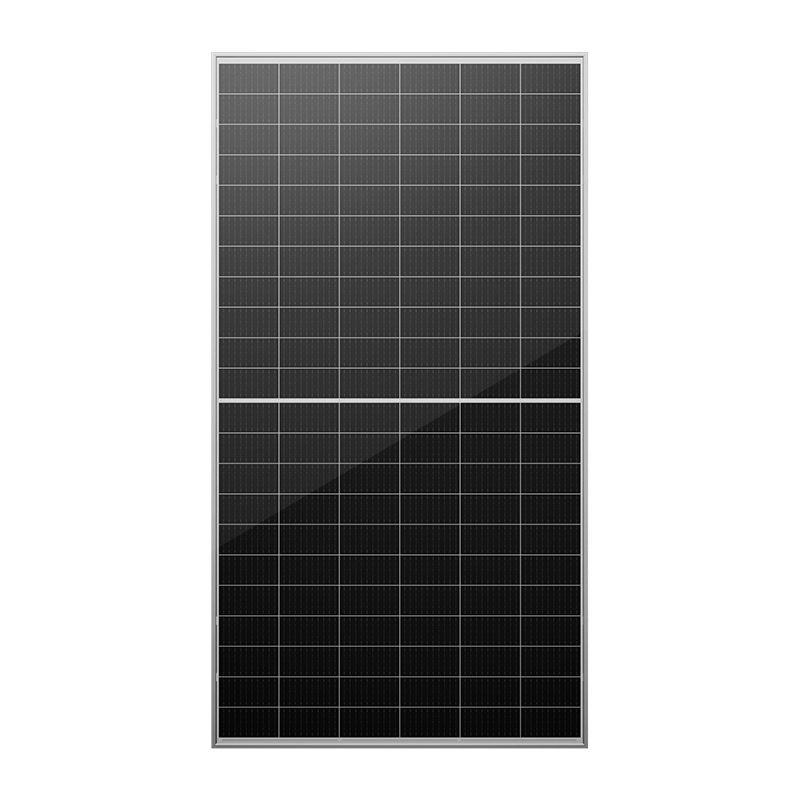
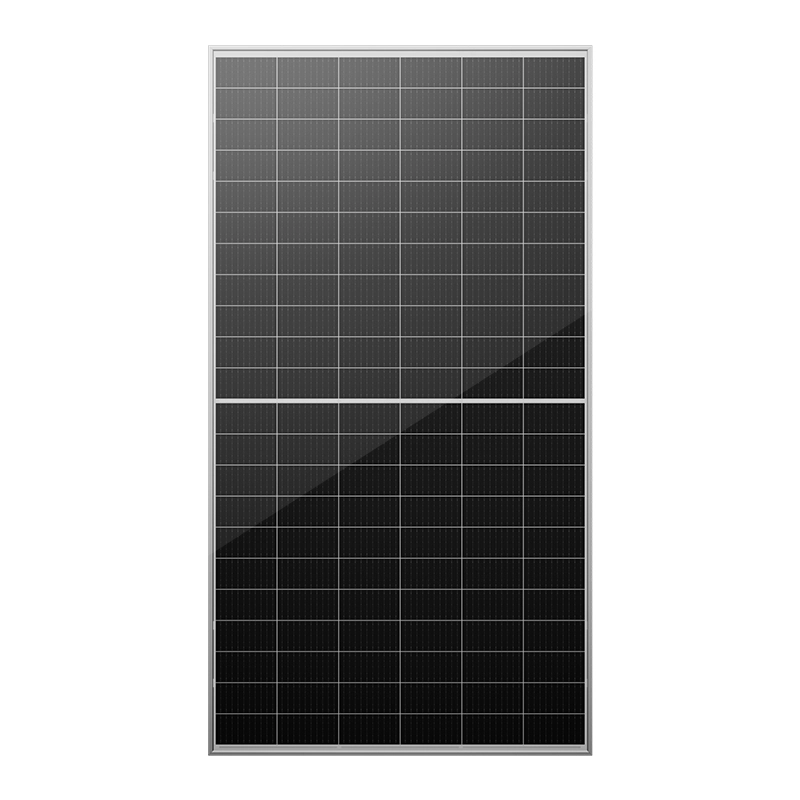
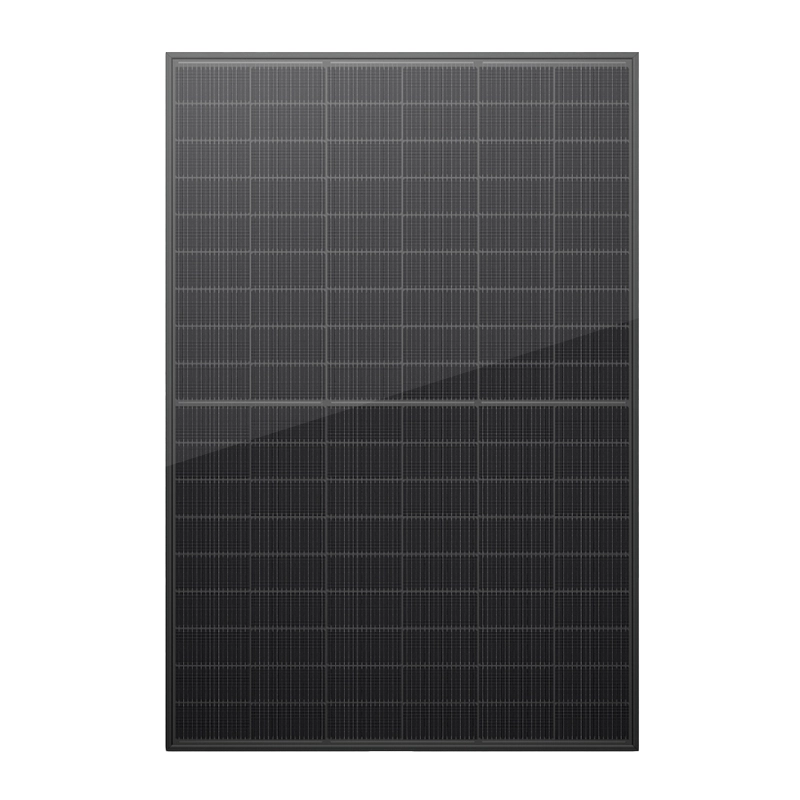
From an engineering standpoint, a modern C&I PV carport in 2026 is a galvanized or anodized-aluminum structure, typically 4 m to 6 m above grade, with a single or double slope, a wind rating of 110 mph to 160 mph (50 m/s to 72 m/s) per ASCE 7-22, a snow load rating of 30 psf to 70 psf (1.4 kPa to 3.4 kPa) depending on the jurisdiction, and a PV module mounting system that accepts 540 W to 730 W bifacial monocrystalline silicon PERC or TOPCon modules (TOPCon now dominates the 2026 module market, with HJT and tandem perovskite-on-silicon gaining share in premium segments). Carport density in 2026 ranges from 8 kW to 12 kW per standard parking space depending on the carport width and module layout, which means a 200-space lot can host 1.6 MW to 2.4 MW of canopy PV — and that is enough to feed 8 to 12 high-power DC chargers and a 1 MWh to 2 MWh battery for a decade.
One more note on the carport, because it is the part of the system that real estate teams always want to cut. Cutting the carport to save 30% of the capex is, almost always, a strategic mistake. A PV+ESS+EV site without a carport is a battery-and-charger site that still imports 60% to 80% of its energy from the grid. A PV+ESS+EV site with a carport is a genuine microgrid that can ride through a 4 p.m. price spike, a utility outage, or a demand-charge ratchet event, and that is what makes the difference between a project that earns 8% IRR and one that earns 16% IRR. The carport is the part of the asset that makes the rest of the asset valuable.
1.5 The PV Inverter (String Inverter, Central Inverter, or Microinverter)
The fifth block is the PV inverter — the device that converts the DC electricity coming out of the PV modules into AC electricity that the rest of the site can use. In 2026 the three form factors are string inverters, central inverters, and microinverters, and the choice matters for a PV+ESS+EV site in a way that it does not for a pure-PV site.
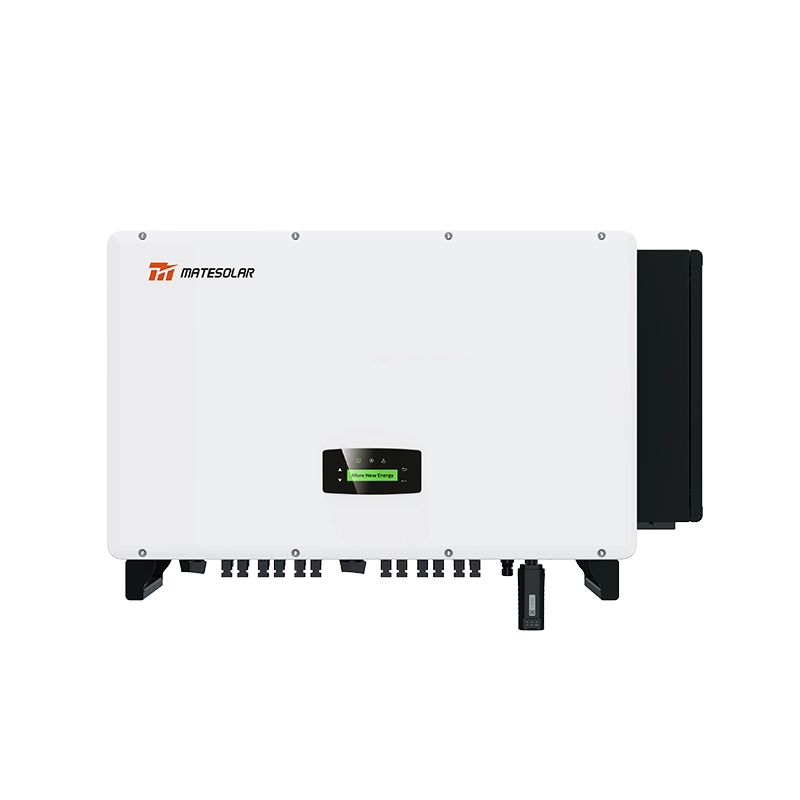
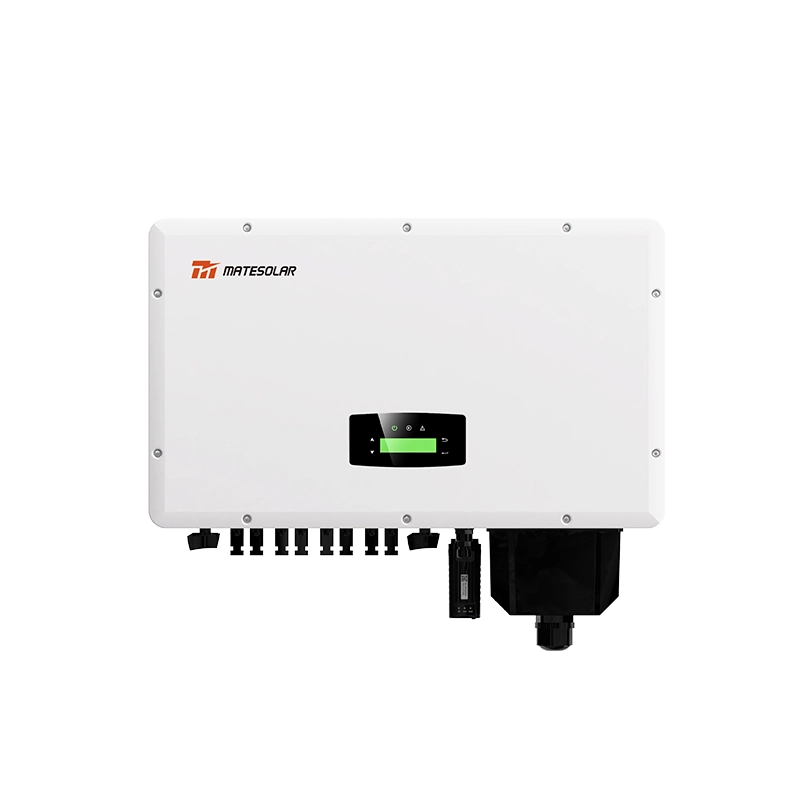
String inverters are the workhorse of the 2026 C&I market. A 100 kW to 350 kW three-phase string inverter from Sungrow, SMA, Huawei, FIMER, or KACO takes the DC output of 8 to 24 strings of modules, MPPT-tracks each input independently, and outputs 400 V or 480 V AC. In a PV+ESS+EV site, the string inverter is mounted either on the carport structure, on a back rail, on the side of the integrated control cabinet, or on the wall of the charger island. String inverters dominate 2026 because they are cheap per kW, easy to service, easy to scale in 50 kW to 350 kW increments, and because their MPPT granularity handles partial carport shading from parked EVs better than a central inverter.
Central inverters — 1 MW to 3.5 MW skid-mounted inverters from Sungrow, SMA, Power Electronics, or Ingeteam — are the right choice for the largest sites where the PV array is on the ground rather than on a carport, and where the DC-to-AC side benefits from a single high-efficiency conversion stage. Central inverters are less common on PV+ESS+EV sites than on utility-scale ground-mount projects, but they show up on the largest highway-corridor deployments in West Texas, southern Spain, and the Mexican Bajío.
العاكسات الدقيقة — module-level inverters from Enphase, APsystems, or Hoymiles — are the right choice when the site has heavy shading, when the carport structure is small or oddly shaped, or when the operator wants module-level monitoring and rapid shutdown compliance to NEC 2017 / 2020 / 2023 Section 690.12. Microinverters are more expensive per kW than string inverters, but on small commercial carports (under 200 kW DC) they can be the lowest-LCOE option because they eliminate the string combiner and the DC string fuse box.
For a typical 1 MW PV+ESS+EV site in 2026, the dominant configuration is four to six 150 kW to 250 kW string inverters, each with its own MPPT zone, feeding the AC bus of the integrated control cabinet. If you are sizing the PV array above 2 MW, you start looking at central inverters. If the site is below 100 kW, you start looking at microinverters or a single 50 kW to 100 kW string inverter.
1.6 The EV Chargers (DC Fast and Ultra-Fast)
The sixth and final block is the EV chargers themselves — the part of the system that actually produces revenue, that drivers see, and that the press photographs. In 2026, the C&I charging market has consolidated around four charger power classes, and the choice between them shapes the upstream topology.
Class 1 — 50 kW to 150 kW DC fast chargers. These are the legacy workhorses. A 50 kW or 150 kW DC fast charger from ABB, Signet, BTC Power, Tritium (now owned by ABB), or a Chinese OEM like Star Charge or TELD draws roughly 60 kW to 175 kW from the AC bus, runs on a 400 V or 480 V three-phase feed, and charges a typical passenger EV in 30 to 60 minutes. Class 1 chargers still dominate fleet depots, dealerships, and small retail sites in 2026 because they are cheap (typically $35,000 to $80,000 per dispenser installed) and because most depot cycles do not need 350 kW.
Class 2 — 240 kW to 360 kW high-power DC fast chargers. This is the volume segment of the 2026 C&I market. A 360 kW dispenser with two CCS1 or NACS outputs can charge a passenger EV at the 10% to 80% envelope in 12 to 18 minutes, which is the dwell time of a typical highway-corridor stop. Hardware is dominated by ABB E-mobility, Kempower, Alpitronic (HYC), BYD, and a fast-rising tier of Chinese and Korean OEMs. Power electronics cost in 2026 has fallen to roughly $0.18 to $0.25 per W at the dispenser, installed, for Class 2.
Class 3 — 480 kW to 600 kW ultra-fast chargers. This is the segment that has been called "Class 3" in the trade press since 2023, and in 2026 it is the segment in which 12-gun cabinets (a single 480 kW or 720 kW power cabinet feeding 6 to 12 dispensers) have become the default new construction. The economics are simple: shared power electronics across 6 to 12 dispensers cuts the $/W cost by 30% to 40% versus standalone dispensers, and the operator gets the marketing benefit of "480 kW" or "720 kW" on the canopies. As of mid-2026, this is the format that is replacing the legacy two-gun 120 kW cabinet on essentially every new C&I site in California, Texas, Germany, the Netherlands, and Mexico.
Class 4 — 720 kW to 1.2 MW megawatt charging systems (MCS). This is the segment that serves heavy-duty trucks, buses, and (increasingly) light commercial vans. MCS is not yet a volume market in 2026, but it is the segment that is pulling the most new high-voltage silicon (1,250 V to 1,500 V DC bus) and the most new liquid-cooled cable designs. For PV+ESS+EV sites that want to serve trucks and buses alongside passenger cars, MCS is now a planned rather than experimental option.
Why does charger choice matter for topology? Because a single 720 kW charger, or a bank of 6 to 12 dispensers sharing 480 kW to 720 kW, will draw 720 kW to 1,000 kW from the AC bus at peak. Add a 1 MWh battery that needs to charge and discharge at 500 kW to 1,000 kW, and add 1 MW to 2 MW of PV carport, and the AC bus on the LV side of the box transformer is routinely handling 1.5 MW to 3.0 MW. That is the design point of the integrated control cabinet, that is the design point of the box transformer, and that is the design point of the utility interconnection. Get any one of them wrong and the site either cannot build or cannot run at full duty cycle.
1.7 AC Coupling vs DC Coupling
Now that we have walked through the six blocks, we can talk about how they are wired together. There are two architectures, and the choice between them is the single most important topology decision you will make on a PV+ESS+EV site.
AC coupling is the dominant 2026 architecture for C&I sites. In an AC-coupled system, the PV array, the ESS, and the chargers all have their own AC outputs (the PV array through its string or central inverter, the ESS through its PCS, the chargers through their internal AC-DC rectifiers), and all three feed a common 400/480 V AC bus inside the integrated control cabinet. The AC bus then steps up to MV through the box transformer and ties to the grid. The control system uses the AC bus voltage and frequency as the synchronization reference, and the dispatch logic decides, in real time, how much PV power goes to the chargers, how much goes to the battery, and how much (if any) goes to the grid. AC coupling is dominant because the components are modular, the architecture is simple, the failure modes are isolated, and the spare-parts inventory is small. A typical 1 MW AC-coupled site can be designed, permitted, and built in 8 to 14 months.
DC coupling is the alternative architecture, and in 2026 it is most common on the largest C&I sites and on FTM utility projects. In a DC-coupled system, the PV array, the ESS, and (sometimes) the chargers share a common 1,000 V to 1,500 V DC bus, and a single bidirectional PCS handles the conversion to and from AC. The advantage is higher round-trip efficiency — typically 2 to 4 percentage points better than AC coupling, because the PV power can go directly to the battery on the DC bus without an AC round-trip — and a smaller inverter fleet. The disadvantage is that DC coupling is more complex to engineer, harder to service, more dependent on a single vendor's control stack, and harder to scale incrementally. A 1 MW DC-coupled site typically takes 12 to 18 months to design, permit, and build.
For a small or mid-commercial PV+ESS+EV site in 2026 — under 2 MW PV, under 4 MWh storage, fewer than 12 chargers — AC coupling is almost always the right answer. For a large C&I or FTM project above those thresholds, DC coupling deserves a serious look, especially if the PV-to-storage ratio is high and the daily cycling is deep. Most of the MateSolar PV+ESS+EV reference sites in 2026, including every site built around the نظام الطاقة الشمسية الهجين التجاري بقدرة 500 كيلوواط or the حاوية 40 قدم 1 ميجاوات ساعة 2 ميجاوات ساعة مبردة بالهواء لتخزين الطاقة, are AC-coupled. Sites built around the حاوية تبريد سائل 20 قدم 3 ميجاوات ساعة 5 ميجاوات ساعة ESS with a large solar field are increasingly DC-coupled or hybrid-coupled (AC for the chargers, DC for the PV-to-battery leg).
1.8 The Complete Topology in One Picture
Put the six blocks together and the standard 2026 AC-coupled PV+ESS+EV topology reads like this, from the sun down to the battery:
1. PV carport produces DC power (open-circuit 1,500 V, MPPT 600 V to 1,300 V) from the modules.
2. String inverters convert the DC to 480 V three-phase AC (or 400 V in EU), each with its own MPPT zone, feeding the AC bus inside the integrated control cabinet.
3. ESS PCS in the battery cabinet (or container) is bidirectionally connected to the same AC bus, charging from surplus PV or grid (in valley hours) and discharging to the chargers or the grid (in peak hours).
4. EV chargers are connected to the same AC bus. Each charger has its own internal rectifier that converts AC to the DC voltage the EV battery needs (200 V to 1,000 V for Class 1/2/3, up to 1,250 V for MCS).
5. Integrated control cabinet houses the AC bus, the breakers, the meter, the site controller, and the EMS gateway.
6. Box transformer steps the 480 V AC bus up to 13.8 kV (or 10 kV in EU) and ties to the local MV distribution feeder.
That is the entire physical system. Everything else — the dispatch logic, the tariff strategy, the demand-charge optimization, the V2G future, the virtual power plant (VPP) registration — is software running on top of this hardware stack.
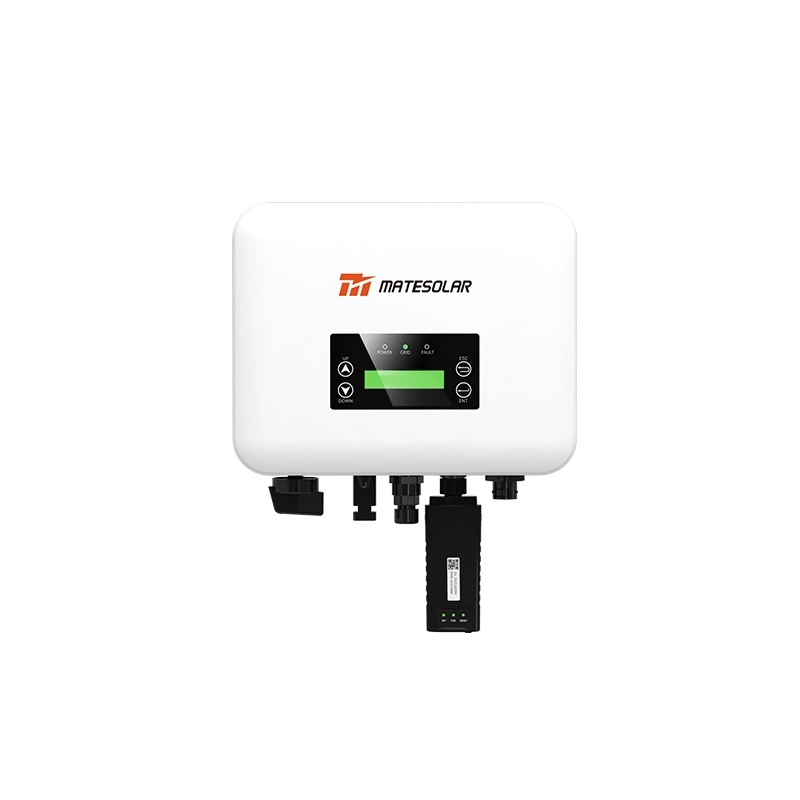
Hardware reference — 500 kW AC-coupled commercial hybrid solar system
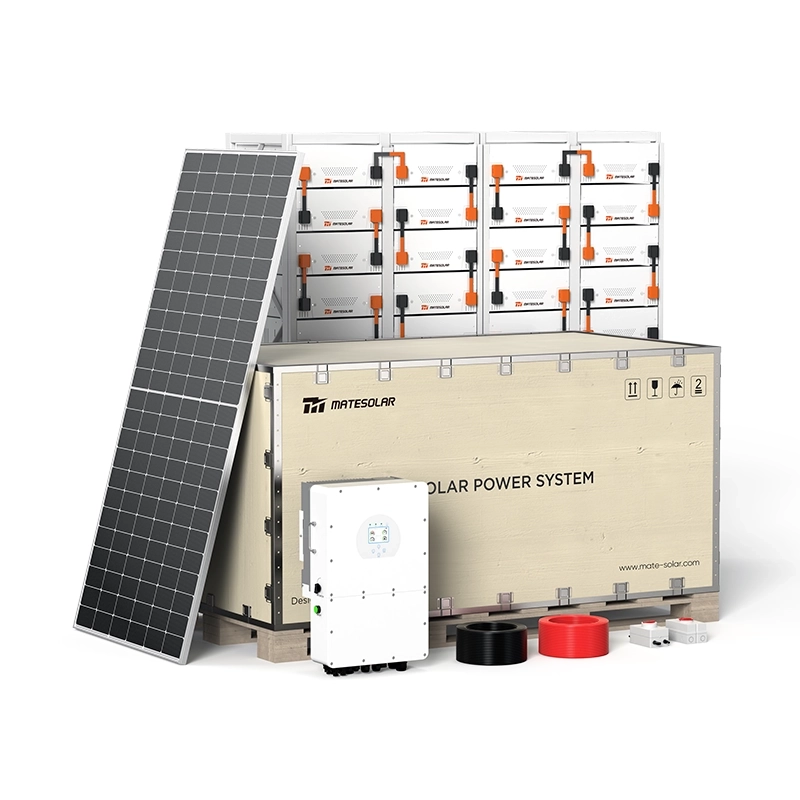
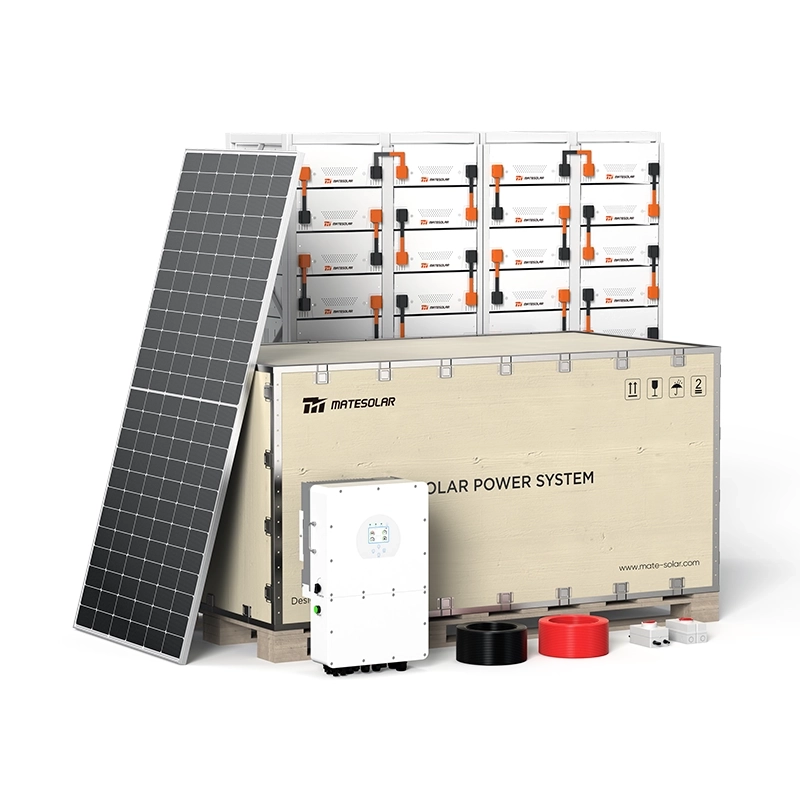
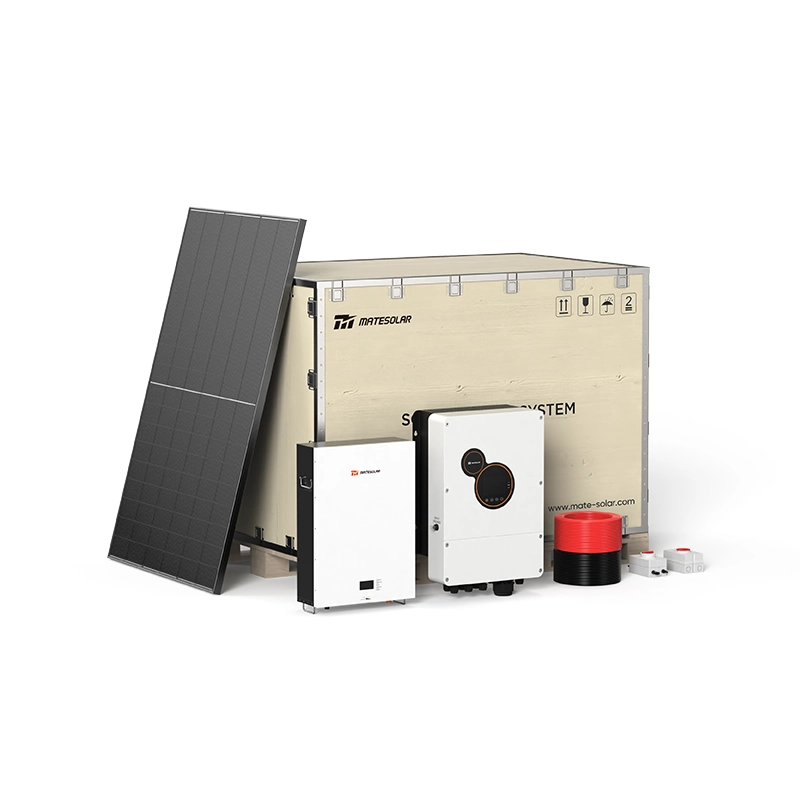
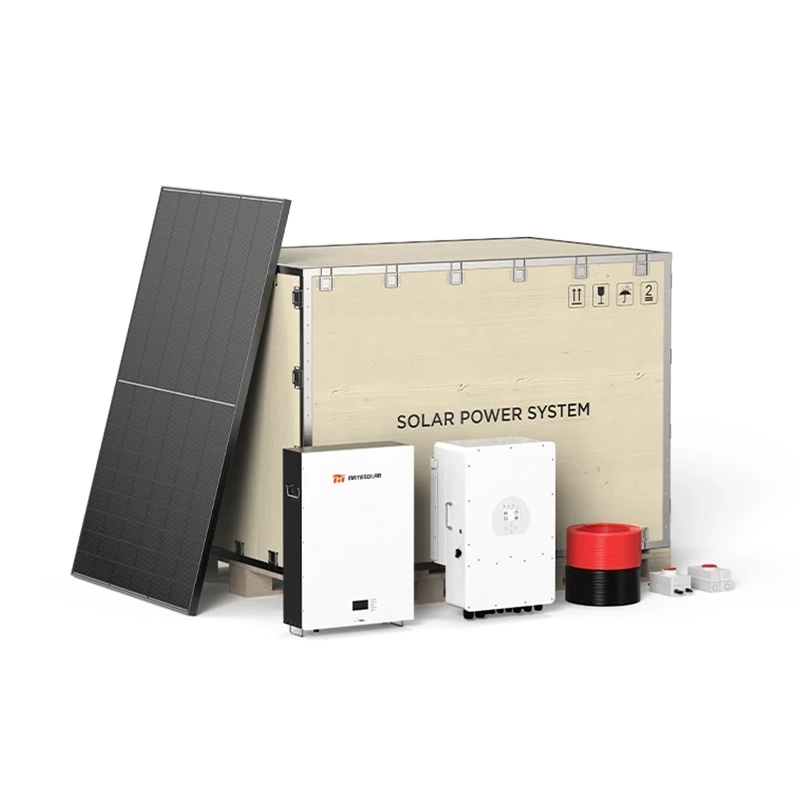
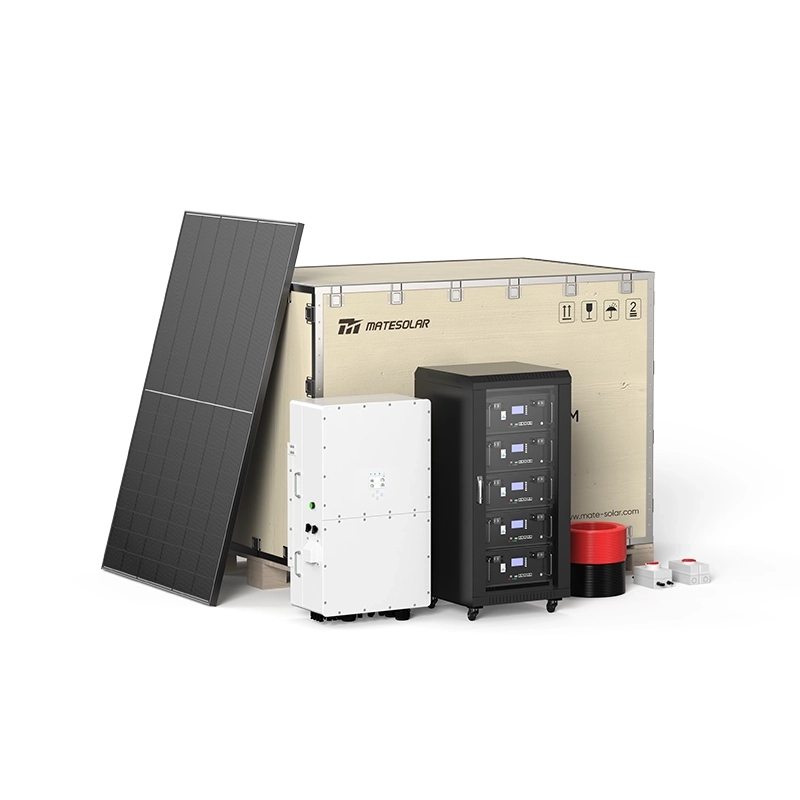
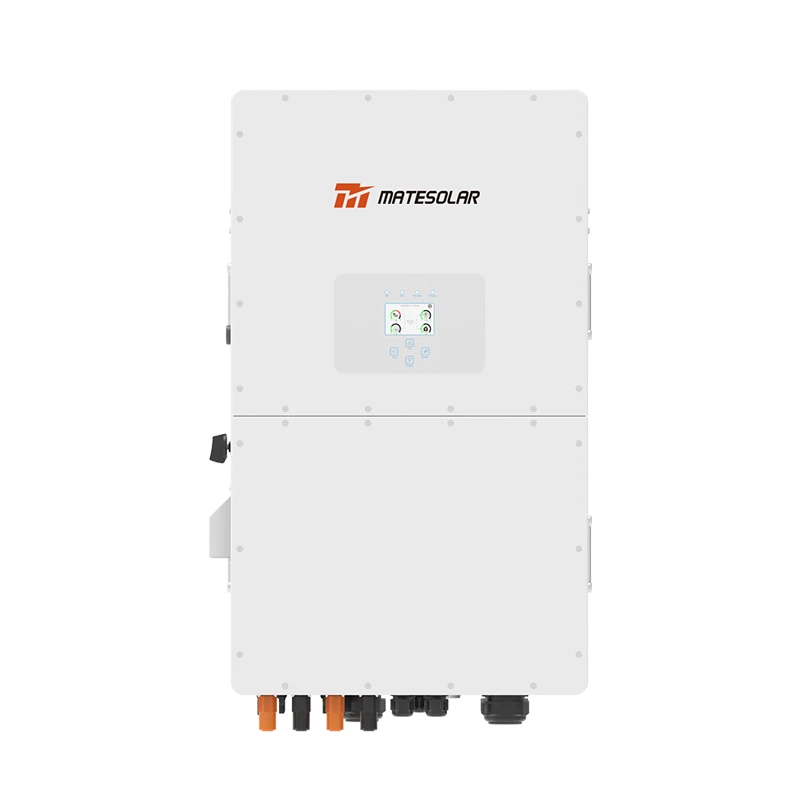
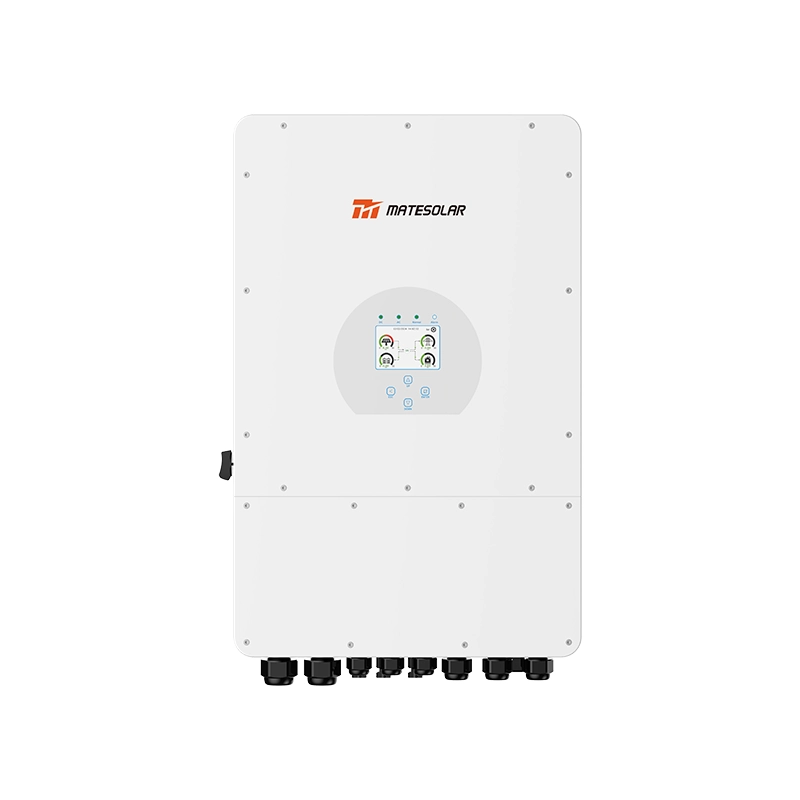
For a concrete 2026 example, the نظام الطاقة الشمسية الهجين التجاري بقدرة 500 كيلوواط is built around a 500 kW PV carport array (approximately 720 to 920 bifacial TOPCon modules at 540 W to 730 W), two 250 kW three-phase string inverters, an integrated control cabinet, and a 500 kVA pad-mount transformer. It is designed as the solar-side companion to a 1 MWh to 2 MWh battery storage system, and it ships with a 25-year linear power-output warranty on the modules and a 10-year warranty on the string inverters and BOS. It is the workhorse of the mid-commercial PV+ESS+EV market in California, Texas, Arizona, the Sun Belt, Iberia, the Mediterranean coast, and central Mexico.
Chapter 2 — The Most Economic Operation Logic
Topology is the bones of the station. The economic operation logic is the brain. Get the bones right and you have a functioning microgrid. Get the brain right and you have a profitable one.
The most economic operation logic of a PV+ESS+EV charging station in 2026 is, at its core, a real-time optimization problem with five input streams and one output stream. The input streams are: (1) the PV production forecast, (2) the charger load forecast (live and day-ahead), (3) the ESS state of charge (SOC), (4) the utility tariff schedule (energy, demand, and any time-of-use or critical-peak pricing overlays), and (5) any utility dispatch signal (DR, VPP, or capacity-market participation). The output stream is a setpoint: how many kilowatts each block sources or sinks at the next one-second, one-minute, or 15-minute interval. The EMS runs this optimization continuously, 86,400 times a day, and it is the EMS — not the hardware — that determines whether the project earns 8% or 18% IRR.
Below is the operator-grade logic that real sites are running in July 2026.
2.1 The Peak-Hour Strategy
Peak hours, for the purpose of a PV+ESS+EV station, are the contiguous block of hours in the afternoon and early evening (typically 3 p.m. to 9 p.m. in California, 4 p.m. to 10 p.m. in Germany, 5 p.m. to 11 p.m. in the UK, 6 p.m. to 10 p.m. in Mexico) when three things are simultaneously true: (1) the local utility tariff is at its highest (either a TOU peak, a critical-peak event, or a real-time price spike), (2) the local grid is at or near its feeder capacity limit, and (3) the chargers are at or near their peak dwell-time demand. These three conditions overlap because they are driven by the same underlying physics: people come home from work, plug in their cars, and turn on their air conditioners, all at roughly the same time.
During peak hours, the EMS runs what we call the load-following strategy with PV-first, ESS-second, grid-third priority. The logic, in plain English, is this:
1. PV first. The EMS measures the live PV production and allocates 100% of that production to the chargers first. If PV production is 800 kW and the chargers are drawing 600 kW, then 600 kW of PV goes to the chargers and 200 kW of PV surplus is left over. The 200 kW of surplus is not wasted — it goes to charge the battery (see step 2).
2. ESS second. If PV production is insufficient to cover the charger load, the EMS discharges the battery to make up the difference, up to the battery's PCS rating. If PV is 400 kW and chargers are drawing 700 kW, the ESS discharges 300 kW and the chargers draw 400 kW from PV. Note: the ESS will only discharge in this mode if (a) its SOC is above the operator's minimum SOC floor (typically 10% to 20%), (b) the discharge is economically justified against the live tariff, and (c) the discharge does not violate the operator's peak-shaving commitment to the utility or the site host.
3. Grid third. If PV + ESS are jointly insufficient, the EMS imports the residual from the grid. This is the "last resort" import, and it is the only import the operator pays full retail price for. The EMS is designed to minimize this number, and on a well-sized site it should be a small fraction of the daily energy throughput.
The anti-backflow (anti-export) override kicks in when PV production exceeds the sum of the charger load and the ESS charge rate. In that case, the EMS clips the PV inverters to the maximum the site can absorb. The surplus is "curtailed" or "clipped" — in the operator's accounting, it is "free" electricity that the site did not have a use for, and the EMS logs it for warranty and performance-ratio reporting. Anti-backflow is required by most North American and European DSOs in 2026 for any site that does not have an explicit export contract, and it is the most common reason a PV+ESS+EV site does not earn an extra 2% to 4% of revenue by selling surplus PV to the grid. The economic loss of clipping is usually small compared to the value of the storage, but it is not zero, and a competent engineer will size the PV array to keep annual clipping below 5%.
2.2 The Valley-Hour Strategy
Valley hours are the mirror image of peak hours. In 2026, valley hours in California are typically midnight to 6 a.m., in Germany they are 10 p.m. to 6 a.m., in the UK they are midnight to 4 a.m., in the Netherlands they are 11 p.m. to 7 a.m., and in central Mexico they are 10 p.m. to 6 a.m. — but the exact window is set by the local utility tariff, and it is the operator's job to confirm the window and update the EMS schedule when the tariff changes. (This happens more often than you think. California restructured its TOU windows in 2025 and again in 2026. The UK moved its "Duos" red-band window in 2024. The Netherlands shifted its capacity-tariff cap in 2025. Germany has been moving its grid-fee peak every six months since 2023.)
During valley hours, the EMS runs the green-charge strategy with grid-first, ESS-second, PV-overlap priority:
1. Grid first, ESS second. If the ESS SOC is below the operator's target SOC ceiling (typically 90% to 95%, never 100% to protect cycle life), the EMS charges the ESS from the grid at the lowest available tariff rate. The charge rate is bounded by the PCS rating, the transformer rating, and any site-host limit on night-time draw (relevant for sites where the site host shares the same service entrance and has a contractual night-time cap).
2. PV overlap. When the sun comes up and PV production starts, the EMS continues to charge the ESS from PV if the ESS is not yet full, even during shoulder hours, because PV energy is "free" at the margin (it is already producing whether you use it or not) and every PV kWh that goes into the ESS is a PV kWh that does not need to come from the grid at peak.
3. Charger feed. As the day progresses into shoulder and peak hours, the EMS rolls the charger load onto PV first, then onto the ESS, and only then onto the grid, exactly as described in Section 2.1.
The valley-hour strategy is the single most important thing the EMS does. It is the reason the battery exists. A well-run valley-charge strategy in California in July 2026 can move energy that costs $0.08 to $0.12/kWh at 2 a.m. to the $0.40 to $0.65/kWh peak window, capturing a $0.30 to $0.50/kWh spread — and that spread, multiplied by 1 MWh to 5 MWh of cycling per day, is the heart of the project's revenue model.
2.3 Anti-Backflow (Anti-Export) Strategy
Anti-backflow deserves its own section because it is the most common point of confusion between developers, operators, and DSOs, and because it has real money attached to it. In plain English, anti-backflow is the rule that says the site is not allowed to export power to the grid. It is enforced by a reverse-power relay at the site-grid interconnection point, and it is required by most North American DSOs (PG&E, SCE, SDG&E, ConEd, National Grid, Oncor, CenterPoint, Hydro-Québec, Alectra, CFE) for BTM sites that do not have an explicit export contract.
The anti-backflow strategy in 2026 has three flavors. Flavor A — passive anti-backflow with PV clipping. The PV inverters are set to a maximum output that is less than the sum of the charger load plus the ESS charge rate, and any surplus is clipped at the inverter. This is the cheapest and most common approach. Flavor B — dynamic anti-backflow with ESS absorption. The PV inverters are allowed to produce at full nameplate, and the EMS dynamically modulates the ESS charge rate to absorb whatever the chargers do not consume. This is the highest-revenue approach and is the one used on essentially every MateSolar site in 2026. Flavor C — export with contract. The site has a separate export contract (a feed-in tariff, a PPA, a VPP aggregation, or a wholesale market registration) and is allowed to export surplus to the grid at an agreed price. This is the highest-revenue approach in theory, but in 2026 it is rare on C&I sites because most C&I interconnection queues do not allow it without a major upgrade study.
For a PV+ESS+EV site in 2026, Flavor B is almost always the right answer. The control loop is simple: a CT at the grid interconnection point measures the live export; if export is positive, the EMS increases the ESS charge rate (or, as a last resort, clips the PV) until export is at or below zero. The loop runs at 100 ms to 1 s, and the response time is more than fast enough to keep a modern DSO reverse-power relay happy.
2.4 Peak Shaving and Valley Filling — the Demand-Charge Play
Peak shaving is the operation that gets the battery out of bed in the morning, and it is the operation that pays the project's fixed costs. The mechanism is simple. Most C&I electricity tariffs in 2026 have a demand charge — a fixed $/kW fee on the customer's peak 15-minute (or, in some jurisdictions, 30-minute or 60-minute) demand in a billing month. In California, demand charges for C&I customers range from $8/kW/month to $35/kW/month depending on the IOU and the tariff schedule (B-19, B-20, B-32, E-19, E-20, E-32, etc.). In Texas, they range from $5/kW/month to $20/kW/month depending on the REP and the TDSP. In Germany, the equivalent is the "Leistungspreis" component of the BDEW tariff, which in 2026 runs roughly €80/kW/year to €150/kW/year (about $7/kW/month to $13/kW/month). In Mexico, the equivalent is the "Demanda Facturable" under the tariff schedules GDMTH, GDMTO, and Dist, which can exceed MXN $400/kW/month on large C&I accounts.
The battery's job, in peak-shaving mode, is to cap the site's import from the grid at a contracted or scheduled "peak target" — say 500 kW — regardless of what the chargers are doing. If the chargers spike to 900 kW at 4 p.m., the PV is producing 300 kW, and the battery is full, the battery discharges 400 kW and the grid import stays at 500 kW. The site host's demand charge is calculated on the 500 kW, not the 900 kW, and the difference — 400 kW × $20/kW/month × 12 months = $96,000/year — is the annual peak-shaving dividend.
Valley filling is the inverse. During valley hours, the EMS deliberately charges the battery from the grid (and from PV, when available) so that the site's import during those hours is higher than it would be organically. Why? Because most demand-charge tariffs have a demand ratchet — a rule that says the monthly demand charge is calculated as the greater of (a) the actual peak 15-minute demand in the month, or (b) a percentage (typically 50% to 80%) of the annual peak. By charging the battery at a steady, predictable rate in every valley hour, the operator sets a high "floor" on the site's monthly demand, and that floor becomes the ratchet floor that protects the site from a one-off peak in a future month. This is called ratchet management, and on a C&I site with a 12-month peak of 1,200 kW and an 80% ratchet, a 400 kW to 600 kW valley-fill floor can save the operator $50,000 to $150,000/year.
2.5 The Tariff Map: What the Optimization Is Actually Optimizing Against
To make this concrete, here is the 2026 tariff reality that the EMS is optimizing against in the markets covered by this article.
Table 2.1 — Indicative 2026 C&I tariff structures across the markets covered in this article (planning estimates, confirm with local utility).
| المنطقة | Representative Utility / Tariff | Off-Peak Energy ($/kWh) | On-Peak Energy ($/kWh) | Demand Charge ($/kW-month) | Peak Window | Export Allowed? |
| California, USA | PG&E B-19 / SCE TOU-8 | 0.10 – 0.18 | 0.35 – 0.65 | 15 – 30 | 4 p.m. – 9 p.m. | Yes, with export contract |
| Texas, USA | Oncor / CenterPoint (REP tariff) | 0.06 – 0.10 | 0.18 – 0.32 | 5 – 18 | 5 p.m. – 9 p.m. | Yes, with VPP or REP agreement |
| New York, USA | ConEd / National Grid SC-9 | 0.08 – 0.14 | 0.28 – 0.45 | 18 – 35 | 12 p.m. – 8 p.m. | Yes, VDER / VPP |
| Ontario, Canada | Alectra / Hydro One (Class B) | 0.10 – 0.13 CAD | 0.22 – 0.32 CAD | 10 – 22 CAD | 11 a.m. – 5 p.m. | Yes, via IESO / HES |
| Bavaria, Germany | E.ON Bayernwerk (BDEW) | 0.18 – 0.24 € | 0.32 – 0.48 € | 7 – 13 € | 5 p.m. – 9 p.m. | Yes, with Einspeisevertrag |
| هولندا | Liander / Stedin (Kleinverbruik) | 0.20 – 0.26 € | 0.36 – 0.52 € | 6 – 11 € | 4 p.m. – 9 p.m. | Yes, with saldering |
| UK | UKPN / National Grid (CMEHP) | 0.22 – 0.30 £ | 0.40 – 0.65 £ | 8 – 16 £ | 4 p.m. – 7 p.m. (Red) | Yes, with ENA G99 |
| Madrid, Spain | Iberdrola / Naturgy (3.0TD) | 0.10 – 0.16 € | 0.24 – 0.38 € | 4 – 9 € | 10 a.m. – 2 p.m. / 6 p.m. – 10 p.m. | Yes, with surplus compensation |
| Central Mexico | CFE GDMTH (Tarifa 2) | 1.5 – 2.2 MXN | 3.5 – 5.8 MXN | 280 – 460 MXN | 6 p.m. – 10 p.m. | Yes, with contrato de interconexión |
| كوستاريكا | ICE / CNFL (T-MT) | 0.10 – 0.16 USD | 0.22 – 0.34 USD | 8 – 14 USD | 6 p.m. – 9 p.m. | Yes, under Law 10086 |
The pattern is unmistakable. Every market in scope has a meaningful peak-to-off-peak ratio, a demand charge that is significant relative to the energy bill, and a pathway to export (or, more commonly, to net-metering or self-consumption credits). The economics of a PV+ESS+EV station in 2026 are therefore driven primarily by the spread between the peak and off-peak price, by the magnitude of the demand charge, and by the rules around export. The hardware is the same everywhere; the dispatch logic is the same everywhere; the tariff shapes everything.
2.6 The EMS Itself — What Good Looks Like in 2026
A 2026-grade EMS for a PV+ESS+EV site is a Linux- or container-based edge controller with four software layers. Layer 1 — protocol adapter. Modbus TCP / RTU for Sungrow, SMA, Huawei, NREL-blessed inverters; Modbus / CAN for the BMS; OCPP 1.6J or 2.0.1 for the chargers; Sunspec for utility DER aggregation; OpenADR 2.0b / 3.0 for utility DR signals; IEEE 2030.5 for California Rule 21 / Hawaii Rule 14 / IEEE 1547-2018 compliance. Layer 2 — forecasting. Day-ahead PV forecast (typically a gradient-boosted tree trained on site weather and prior production), day-ahead load forecast (a recurrent net trained on the prior 90 days of charger sessions), and day-ahead tariff forecast (read from the local utility's published schedule or from a real-time price feed). Layer 3 — optimization. A mixed-integer linear program (MILP) or, in 2026, increasingly a reinforcement-learning policy that runs at 15-minute to 1-hour resolution to set the day's charging and discharging schedule. Layer 4 — real-time control. A 1-second to 15-second closed loop that executes the schedule, corrects for forecast error, and responds to live grid signals.
A good 2026 EMS will also have a VPP (virtual power plant) module that allows the site to enroll in one or more utility or third-party aggregation programs — OhmConnect, Tesla Virtual Power Plant, Stem, Sunnova, sonnenCommunity, Lichtblick, EDF Flex, Iberdrola Curenergía, CFE Demanda Controlable — and to bid the site's available headroom (and head-foot) into the wholesale market or the utility's DR program. The 2026 VPP stack is no longer experimental. It is a real revenue line, and on a 1 MWh to 5 MWh site it can add $30/kW-year to $80/kW-year of revenue on top of the energy arbitrage and demand-charge stack.
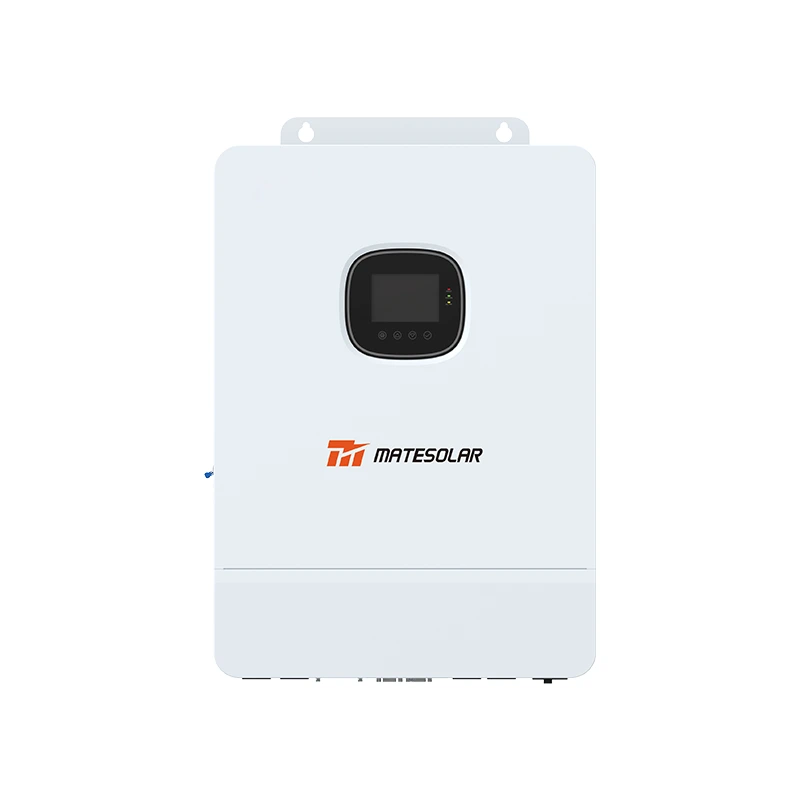
Hardware reference — outdoor liquid-cooled cabinet ESS for 100 kW / 125 kW sites
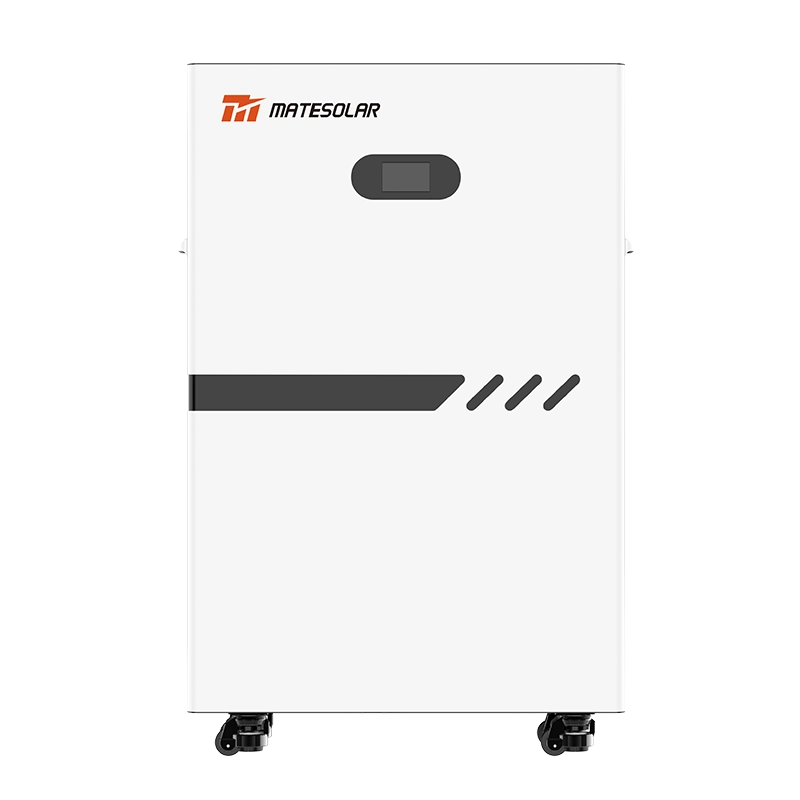
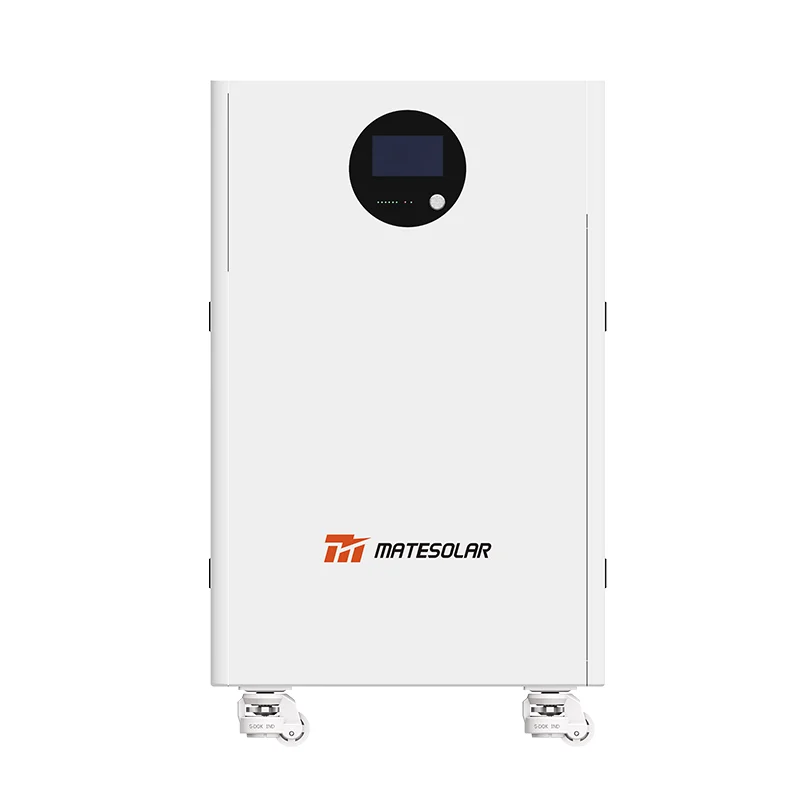
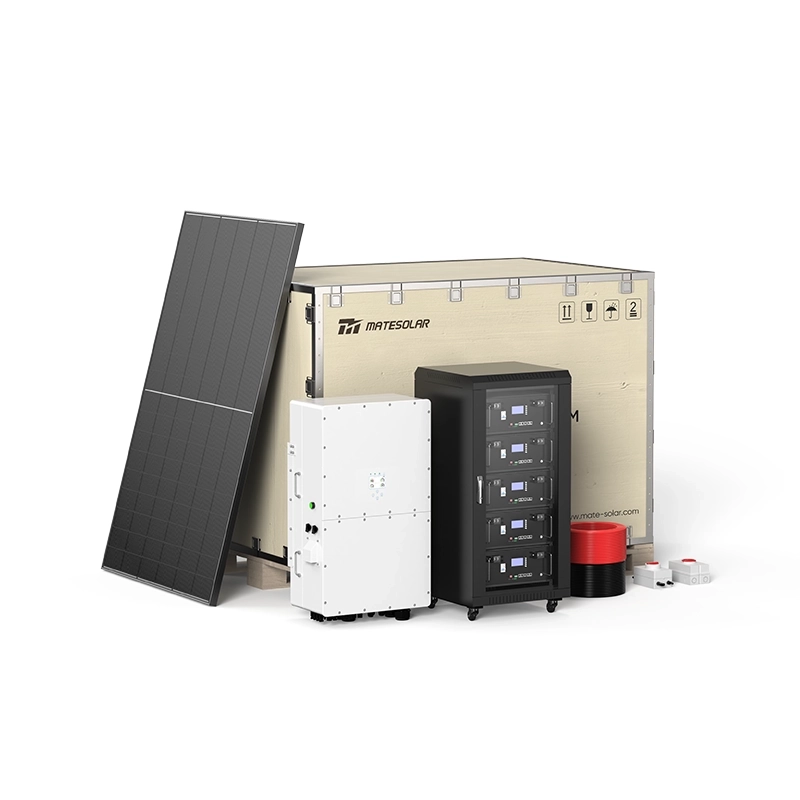
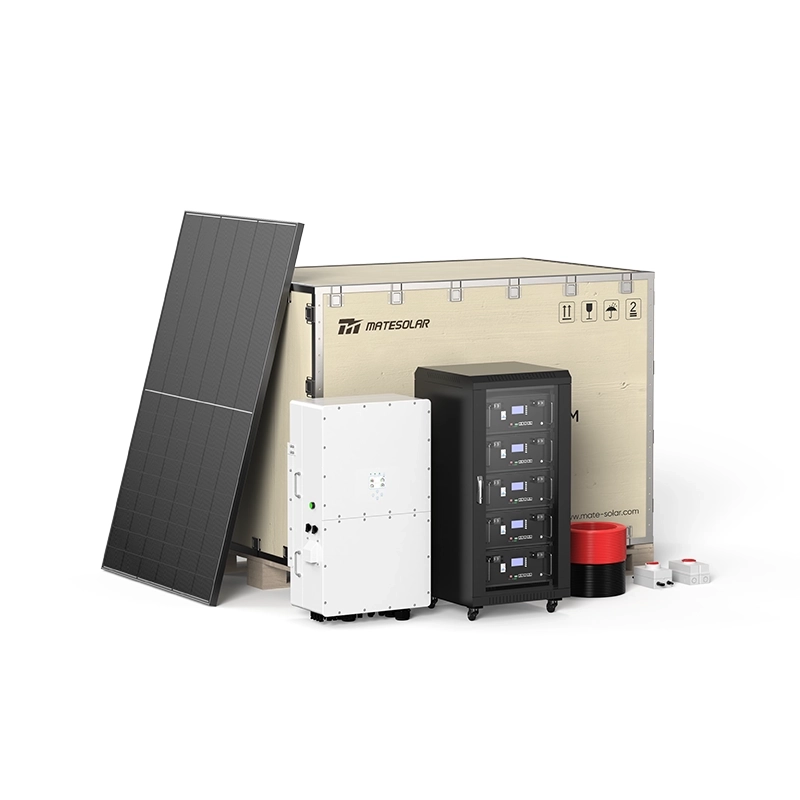
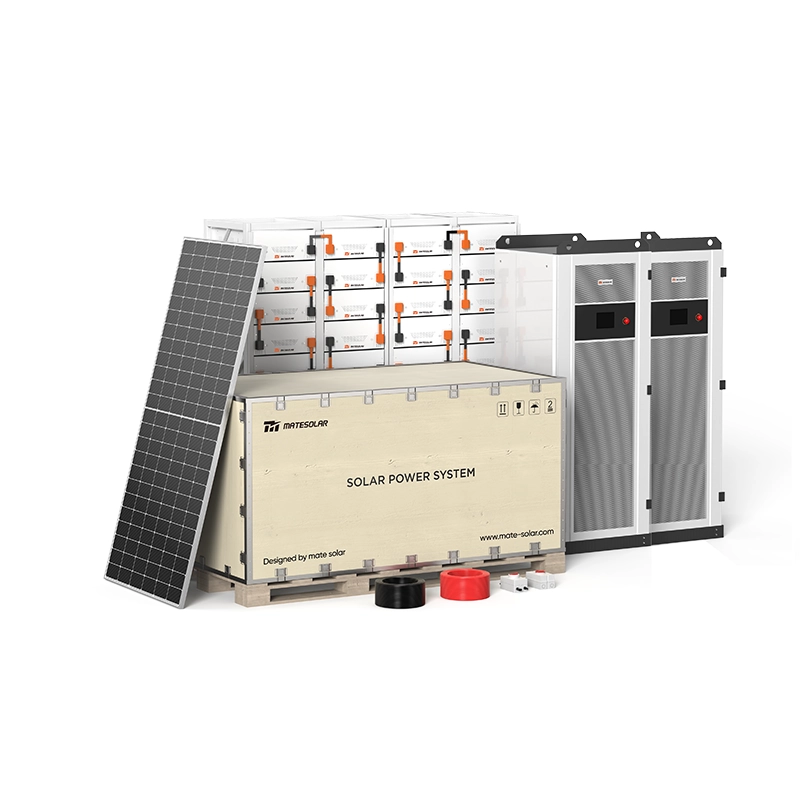
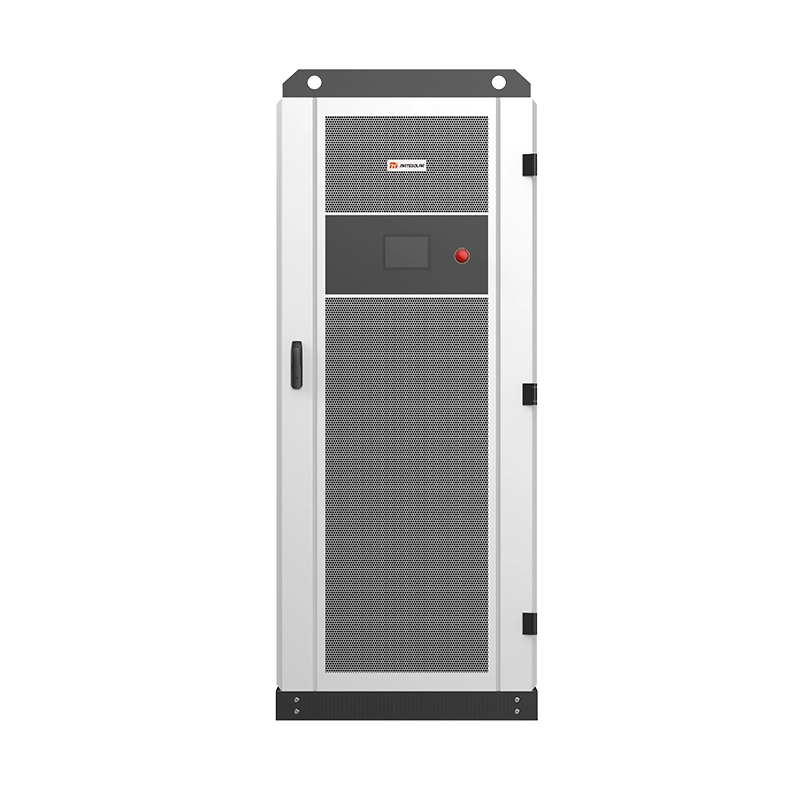
For small and mid-commercial sites, the cabinet-format ESS is the most cost-effective. The MateSolar نظام تخزين طاقة خارجي مبرد بالسائل بخزانة 100 كيلوواط/232 كيلوواط ساعي و 125 كيلوواط/261 كيلوواط ساعي is built around an LFP cell-to-pack architecture, an integrated 100 kW or 125 kW hybrid inverter/PCS, integrated liquid cooling, integrated aerosol fire suppression, and an IP55 outdoor enclosure. It ships with a 10-year performance warranty (70% capacity retention at 6,000 equivalent full cycles at 25°C, 0.5C/0.5C, 90% DoD) and it is the workhorse of the 200 kW to 1 MW PV+ESS+EV sites in the Sun Belt, the Mediterranean, and the Mexican Bajío. It pairs directly with the 500KW Hybrid Solar System referenced in Chapter 1, and it is the smallest MateSolar ESS that supports grid-forming (virtual synchronous machine, or VSM) mode for sites that need to ride through a grid outage.
Chapter 3 — PV+ESS+EV Stations vs Traditional Charging Stations
A traditional grid-tied charging station is the simplest possible energy system that still has a name. It is a row of chargers, a service drop from the utility, a meter, and a parking lot. Every kilowatt-hour that a customer charges into an EV is a kilowatt-hour that comes from the grid at the prevailing tariff, and the operator's margin is the difference between the retail charging price (typically $0.30 to $0.70/kWh in the US, €0.40 to €0.75/kWh in the EU, $0.25 to $0.55/kWh in Mexico) and the utility's effective cost. That margin is real, but it is squeezed from both sides: by the utility's tariff on the cost side, and by competing chargers in the same trade area on the revenue side.
A PV+ESS+EV station is the same system, plus a steel canopy, a battery, and a control cabinet. The capex is higher — typically 50% to 90% higher than a traditional station of the same nameplate charger power — but the unit economics are fundamentally different, because the station can now (a) buy energy at off-peak prices, (b) generate its own energy, (c) store it, and (d) sell it at peak prices, with the spread accruing to the operator rather than to the utility. The two stations start to look very similar on day one and very different by year three.
3.1 The Investment Comparison
Below is the side-by-side comparison that we walk every project developer and every site host through before they commit capital. The numbers below are mid-2026 planning estimates for a representative 1 MW / 6-dispenser C&I charging site in California; the ratios generalize to every market in scope, with the local capex and opex substituted in.
Table 3.1 — Traditional charging station vs PV+ESS+EV charging station, qualitative capex/opex/strategic comparison.
| Comparison Item | Traditional Charging Station | PV+ESS+EV Charging Station |
| Initial Investment | Low — chargers, transformer, service drop, meter, parking lot civil work, signage. | High — all of the above, plus PV carport structure and modules, ESS cabinet or container, integrated control cabinet, EMS software, expanded transformer, and the additional interconnection study. |
| Economic Performance | Average — margin is squeezed by tariff on the cost side and by competitor pricing on the revenue side. | High — flexible peak-shaving and valley-filling strategy capture the peak/off-peak spread, demand charges, and (where available) DR/VPP revenue. |
| قابلية التوسع | Low — adding more chargers requires a transformer upgrade, a service upgrade, and an interconnection study, each of which can take 6 to 18 months and is often impossible in constrained feeders. | High — adding more chargers can be done by adding ESS capacity and deferring the transformer upgrade, because the battery covers the new peak without increasing the grid import. |
| Land Footprint | Low — flat lot, no overhead structure, minimal above-grade equipment. | High — the PV carport adds visual mass, the ESS cabinet/container adds a plinth, and the integrated control cabinet adds a footprint, all of which expand the site's above-grade equipment area. |
| Competitiveness | Low — competing on price alone is a race to the bottom; competing on speed alone requires more chargers than the grid can support. | High — lower charging price via green electricity, differentiated brand, fast charging without grid upgrade, ability to participate in DR/VPP programs. |
The qualitative story is straightforward, but the quantitative story is what closes the deal. A 2026-grade 1 MW / 6-dispenser PV+ESS+EV site in California with a 500 kW carport array, a 1 MWh LFP battery, and the 500KW Hybrid Solar System plus the 1MWh Air-Cooled Container ESS at the heart of the system has a turnkey capex of roughly $2.4M to $3.1M (excluding the chargers themselves, which are common to both configurations). A traditional site of the same charger capacity has a capex of roughly $1.5M to $2.0M. The PV+ESS premium is therefore $900k to $1.1M, which sounds like a lot — and is — but the annual revenue uplift from energy arbitrage, demand-charge management, and VPP participation in California routinely clears $280k to $420k, which means the payback on the PV+ESS premium is in the 2.5- to 3.5-year range, and the asset then earns 12% to 18% IRR for the next 12 to 16 years on the storage alone.
The economics in Europe are similar but driven by different tariff components. In Germany, the spread between off-peak and on-peak BDEW rates is roughly €0.10/kWh to €0.20/kWh, the demand-charge equivalent (Leistungspreis) is €80/kW/year to €150/kW/year, and the on-site PV self-consumption compensation under the EEG 2023 / 2026 rules is roughly €0.08/kWh. A well-run 1 MWh site in Bavaria cycles 700 MWh to 900 MWh per year, of which 60% to 70% is peak-shifted, 15% to 20% is self-consumed PV, and the balance is VPP revenue. Net annual arbitrage plus demand savings: €180k to €270k, against a PV+ESS premium of €700k to €900k. Payback: 3.0 to 4.0 years.
The economics in Mexico are the most interesting, because the CFE Tarifa 2 / GDMTH demand charge (Demanda Facturable) is punitive and the peak energy price is roughly 2.5× to 3.5× the off-peak price. A 1 MWh site in central Mexico can clear MXN $3.5M to MXN $5.2M (roughly $200k to $300k USD) of annual peak-shaving and demand-charge savings, against a USD-denominated PV+ESS premium of $750k to $950k. Payback: 3.0 to 4.0 years, and FX-adjusted IRRs that are even more attractive when the peso weakens.
3.2 The Scalability Story — Why Storage Unlocks the Grid
The single most under-appreciated benefit of a PV+ESS+EV station is that the battery effectively increases the site's usable grid import. A traditional site with a 500 kVA transformer is limited to 500 kW of grid import at any given moment. If you add a fourth 360 kW charger, the peak coincident load can hit 1,200 kW, and the utility will either refuse the upgrade or require a $400k to $900k feeder upgrade that takes 12 to 24 months. A PV+ESS+EV site with the same 500 kVA transformer but a 1 MWh battery and a 500 kW carport can serve 1,200 kW of charger load with only 500 kW of grid import because the battery covers the 700 kW gap. The 500 kVA transformer is now the same physical asset, but it serves 2.4× more revenue-producing load.
This is, in plain terms, the killer feature of the storage-equipped site. It is the reason that in 2026, virtually every new multi-charger C&I site in California, Texas, New York, Germany, the Netherlands, and central Mexico is being built with storage. And it is the reason that, on a constrained feeder, the only path to scaling a charger fleet is to add storage rather than to upgrade the transformer. We discuss the engineering math in Chapter 5.
3.3 The Land Footprint Trade-off
The land-footprint penalty of a PV+ESS+EV site is real but smaller than most first-time developers assume. A 1 MW PV carport over a 200-space parking lot has the same asphalt footprint as a traditional site — the carport is overhead, not on the ground. The ESS cabinet or container adds a plinth of roughly 6 m × 2.5 m for a 100 kW / 232 kWh cabinet, or 12 m × 2.5 m for a 40 ft container, or 6 m × 2.5 m for a 20 ft container. The integrated control cabinet adds another 1.5 m × 1 m. Total added above-grade footprint: 15 to 35 m², which is a rounding error against a 200-space lot of roughly 6,000 m².
What does increase meaningfully is the visual mass. A 1 MW carport is 4 m to 6 m tall, which means it is visible from the road and from neighboring properties. The aesthetic impact is real, and it has become a real point of community engagement in California, the UK, and the Netherlands. The mitigation is the same as for any carport project: stakeholder engagement early, accurate renderings, code-compliant setbacks, and a planting plan. In 2026, the projects that skip this step are the projects that get delayed by zoning appeals. The projects that invest two months in stakeholder engagement before they break ground are the projects that open on time.
3.4 The Competitiveness Story — Green, Cheap, and Brand-Aligned
The final row of Table 3.1 — competitiveness — is the most important, and it is the one that the industry under-talks. A PV+ESS+EV station can charge a customer $0.15 to $0.25/kWh less than a traditional station in the same trade area, and still earn more per kWh than the traditional station, because the operator's cost basis is lower. The "green electricity" message is no longer a marketing line — it is a price differentiator. Fleet operators in 2026 are willing to pay $0.02 to $0.05/kWh above the market rate for verified renewable charging, because their own Scope 1 and Scope 2 accounting gets cleaner. Retail customers in 2026 — particularly in California, Germany, the Netherlands, and Scandinavia — actively seek out green chargers. The brand alignment with the energy transition is not a soft benefit. It is, increasingly, a hard revenue line.
The same operator that runs the green-charging premium can also run a corporate-sustainability story with the site host (the building owner, the logistics provider, the municipal fleet), and that story is now part of how procurement decisions are made. A site host that wants to win a corporate-tenant RFP in 2026 will, increasingly, prefer a landlord that offers green charging. A logistics provider that wants to win a Fortune 500 freight contract in 2026 will prefer a charging partner that can issue verified renewable-energy certificates (RECs, GOs, or CELs depending on the jurisdiction) for every kWh it dispenses. The PV+ESS+EV station is, in this sense, not just a piece of infrastructure. It is a marketing asset, a sustainability asset, and a procurement asset, all in one.
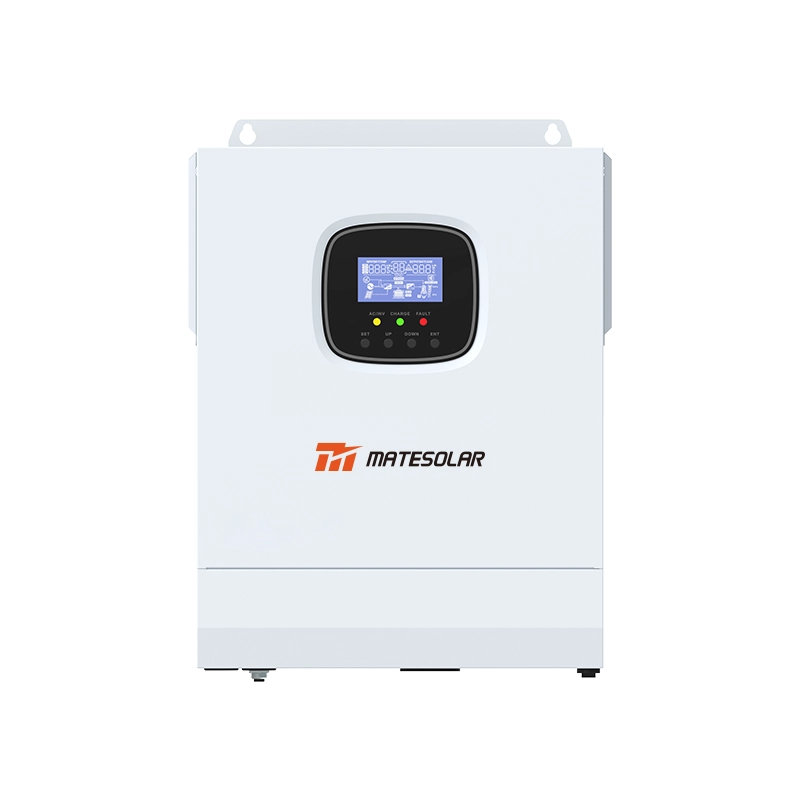
Hardware reference — 40 ft 1 MWh / 2 MWh air-cooled container ESS
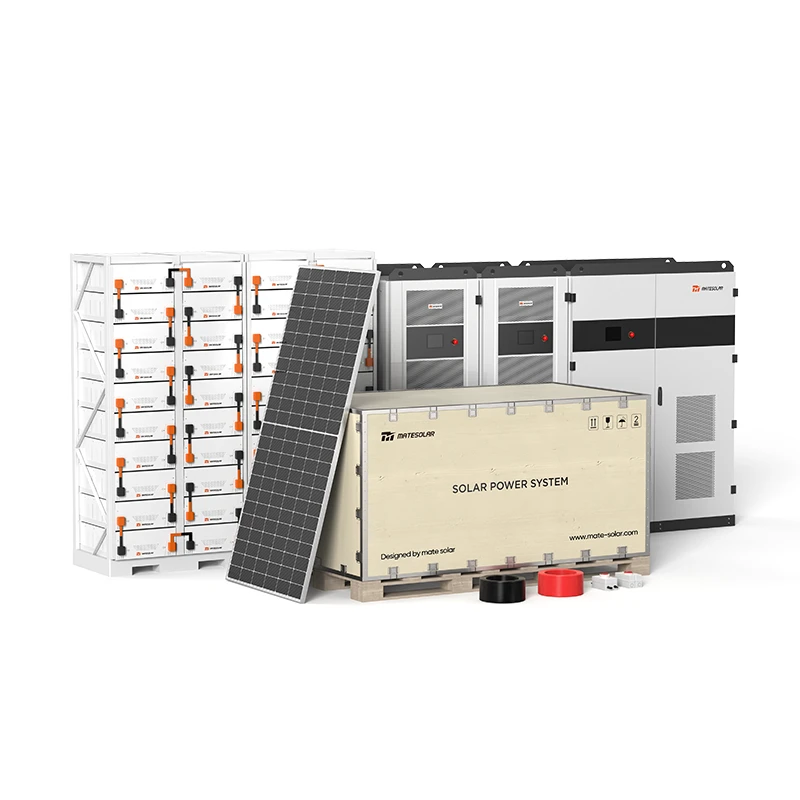
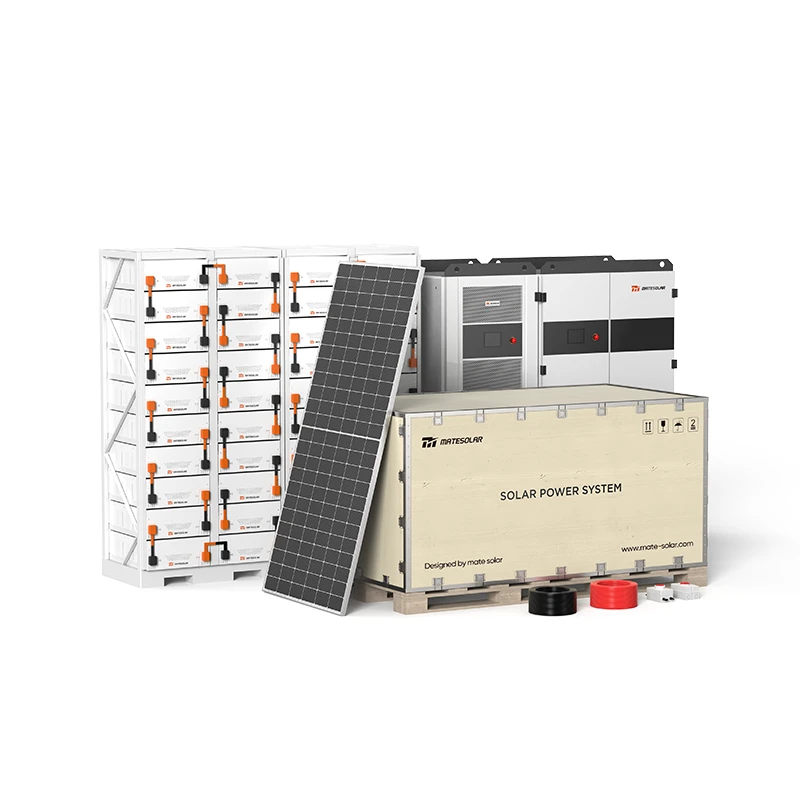
For the medium commercial PV+ESS+EV site — 500 kW to 2 MW PV, 1 MWh to 4 MWh storage, 6 to 12 chargers — the most cost-effective storage architecture in 2026 is the 40 ft air-cooled container. The MateSolar نظام تخزين الطاقة حاويات 40 قدم 1 ميجاوات ساعة 2 ميجاوات ساعة مبرد بالهواء is built around a 40 ft ISO high-cube container, an LFP battery rack architecture, a 500 kW to 1,250 kW bidirectional PCS, an integrated air-cooled HVAC system, an integrated fire suppression system (aerosol + detection + ventilation), and a 10-year performance warranty. It is the workhorse of the highway-corridor and large fleet depot market in 2026, and it is the system that most of the MateSolar 1 MWh to 2 MWh reference projects in the US Sun Belt, Iberia, and the Mexican Bajío are built around. It is fully UL 9540A-tested, CE-marked, and NOM-compliant for the markets covered in this article.
Chapter 4 — 2026 Regional Market Reality Check (North America, Europe, Central America)
Hardware is global. Markets are local. Below is the 2026 reality check, region by region, for the geographies in scope. We have anchored every claim to the best public data we can verify as of July 2026, and we have flagged where the market is moving fast.
4.1 North America — United States
The US is the single largest PV+ESS+EV market in scope, and it is also the most heterogeneous. As of mid-2026, the US has roughly 220,000 public Level 2 and DC fast charging ports, of which roughly 38,000 are DC fast. The IRA (Inflation Reduction Act) of 2022 and its 2025 amendments continue to drive storage investment through the ITC (Investment Tax Credit), which in 2026 stands at 30% base + 10% domestic-content adder + 10% energy-community adder + 10% low-income adder, for a maximum of 60% ITC on a qualifying PV+ESS project that meets the prevailing-wage and apprenticeship requirements. The CHIPS and Infrastructure Act (IIJA) of 2021 continues to fund the NEVI (National Electric Vehicle Infrastructure) corridors at $5B through 2027, with explicit preferences for sites that include on-site renewable generation and storage.
What this means for a PV+ESS+EV developer in the US in 2026: the federal stack is strong, but the state and utility stack is what determines the project economics. California (CPUC, CEC, CARB), New York (NY-Sun, NYSERDA, VDER), Massachusetts (SMART, ConnectedSolutions), Texas (ERCOT, the Property Assessed Clean Energy, or PACE, programs), Illinois (Adjustable Block Program, IPA), and New Jersey (Successor Solar Incentive, or SuSI, and the Connected Solutions program) are the six state markets that, in mid-2026, are seeing the majority of the PV+ESS+EV project flow. The other 44 states are not absent — they are simply less mature, and the projects in those states tend to be fleet-depot or large-warehouse projects where the host's own demand-charge economics carry the model.
Two specific US market dynamics to watch. First, the NEM 3.0 (Net Energy Metering 3.0) regime in California, which took effect in April 2023, has fundamentally changed the economics of PV export. Under NEM 3.0, exported PV is compensated at the avoided-cost calculator (ACC) rate of roughly $0.05/kWh to $0.09/kWh, which is one-fifth of the retail rate. This is a brutal regime for a traditional PV-only site, but it is a near-ideal regime for a PV+ESS site, because the value of stored PV at the peak rate ($0.40 to $0.65/kWh) is now 4× to 8× the value of exported PV. Second, the FERC Order 2222 implementation, which is rolling out across all US ISOs/RTOs through 2026 and 2027, allows DER aggregations of as small as 100 kW to participate in wholesale capacity, energy, and ancillary services markets. This is the regulatory foundation of the VPP revenue stream, and on a 1 MWh to 5 MWh PV+ESS+EV site, Order 2222 is the single most important non-tariff regulatory development of the decade.
4.2 North America — Canada
Canada is a smaller but high-quality market. The federal Clean Technology Investment Tax Credit (CT-ITC) provides a 30% refundable tax credit on qualifying clean-energy equipment placed in service between 2024 and 2031, and several provinces layer on additional incentives. Ontario's IESO Long-Term RFP (LT RFP) and the Grid Innovation Fund continue to procure large-scale storage. Quebec's Hydro-Québec has been actively soliciting PV+storage projects through its call-for-tenders process since 2023. Alberta's Market Surveillance Administrator opened the energy and ancillary services market to storage aggregators in 2022, and the AESO has been issuing storage awards in the hundreds of MWs.
For PV+ESS+EV specifically, the Canadian market is dominated by fleet-depot and highway-corridor projects along the 400-series highways in Ontario, the Trans-Canada in Quebec and Alberta, and the BC Highway 1 and 5 corridors. The Canadian market has two distinguishing features: cold-weather performance (which favors liquid-cooled ESS and IP55+ outdoor cabinets), and a relatively low residential retail tariff (which compresses the peak/off-peak spread and makes the demand-charge play less powerful than in California). The result is a market where the optimal PV+ESS+EV project is sized to cover the host's own demand and to ride through short utility outages, rather than to maximize pure arbitrage.
4.3 North America — Mexico
Mexico is the most under-appreciated PV+ESS+EV market in scope, and in 2026 it is the one with the highest marginal economics. The CFE Tarifa 2 / GDMTH demand charge (Demanda Facturable) is among the highest in the Americas, and the peak/off-peak energy spread is severe. The federal energy reform of 2024 clarified that private generators can sell to the wholesale market (MEM) and to private off-takers, and the 2025 CRE (Comisión Reguladora de Energía) regulations on storage interconnection provide a workable framework for PV+ESS projects above 0.5 MW.
The Mexican market is concentrated in three regions: the Bajío (Querétaro, San Luis Potosí, Guanajuato, Aguascalientes) for industrial and logistics PV+ESS+EV; the Norte (Monterrey, Saltillo, Chihuahua) for industrial and large-fleet; and the Centro (Mexico City, State of Mexico, Puebla) for commercial and last-mile logistics. The Mexican market in 2026 is still primarily a behind-the-meter market — the wholesale market is thin and the FTM storage market is nascent — which means the optimal project in Mexico is, almost always, a host-driven project where the host's own demand charge is the anchor value stream. The USMCA (United States-Mexico-Canada Agreement) rules of origin also make Mexico a particularly attractive site for ESS cabinets and containers that are being built for export to the US market, which has become a major secondary tailwind for the Mexican C&I storage industry.
4.4 Europe — European Union (EU-27)
The EU is the second-largest PV+ESS+EV market in scope, and it is the most policy-driven. The Fit-for-55 package (now known as the 2040 Climate Target Framework) and the revised Renewable Energy Directive (RED III, adopted in 2023) set a binding EU target of 42.5% renewable energy by 2030, with intermediate storage and EV charging infrastructure targets. The Alternative Fuels Infrastructure Regulation (AFIR), which took effect in April 2024, requires fast-charging pools of at least 150 kW per EV (and 350 kW for trucks) at 60 km intervals along the Trans-European Transport Network (TEN-T) by 2025 and 2027. This is the regulatory foundation for the European highway-corridor PV+ESS+EV market.
Country-level markets vary widely. Germany is the largest single market, with the EEG 2023 / 2026 framework providing €0.05/kWh to €0.08/kWh self-consumption compensation for PV under 1 MW, and the BDEW tariff structure providing the demand-charge equivalent (Leistungspreis) of €80 to €150/kW/year. The Netherlands is the second-largest, with the "saldering" net-metering framework still in effect through 2027 (and being phased down for new installations after that), and the SDE++ operating subsidy for larger storage. Italy is the third-largest, with the FER X decree and the MACSE (Meccanismo di Approvvigionamento di Capacità di Stoccaggio) capacity market both actively procuring storage in 2025 and 2026. Spain is the fourth-largest, with the 3.0TD tariff and the recent permission for PV self-consumption with surplus compensation under RD 244/2019 making it one of the most attractive European markets for PV+ESS+EV behind the meter.
For the European PV+ESS+EV market in 2026, three trends to watch. First, the Grid Booster and similar large-scale storage tenders in Germany, Italy, and Spain continue to set the floor for storage pricing. Second, the AFIR implementation is generating a wave of highway-corridor projects in every EU member state, with a strong preference for sites that include on-site renewable generation and storage. Third, the Net Billing regime in Spain and the impending Saldering phase-out in the Netherlands are pushing every European project developer toward the same conclusion: storage is no longer optional. A PV project without storage in 2026 is a project that leaves 30% to 50% of its value on the table.
4.5 Europe — United Kingdom, Norway, Switzerland
The UK is a high-quality but complicated market. The CM (Capacity Market) has been procuring 4-hour storage since 2018, and the de-rated capacity of 4-hour batteries has been a major revenue stream. The ESO (National Energy System Operator) has been actively running the DSO (Distribution System Operator) flexibility tenders in 2024 and 2025, and the 2026 Pathfinders are now procuring 4-hour and 8-hour storage for stability services. The "Duos" (Distribution Use of System) red-band charges have been restructured, and the ENA G99 interconnection framework is mature.
Norway is the EV capital of the world on a per-capita basis, and the PV+ESS+EV market there is small but high-quality. Switzerland is a similar story — small, high-quality, and dominated by behind-the-meter projects on commercial and industrial sites. The Swiss tariff structure (the "Hochtarif / Niedertarif" split, plus the "Leistungspreis") is similar to Germany's BDEW, and the market is dominated by grid-tied PV+ESS projects on industrial parks.
4.6 Central America (Excluding Brazil and Cuba)
Central America in scope — Mexico (covered above as part of North America), Guatemala, Belize, Honduras, El Salvador, Nicaragua, Costa Rica, and Panama — is a small but rapidly growing PV+ESS+EV market. The regional electricity markets are dominated by state-owned vertically integrated utilities (ICE in Costa Rica, CND/ETESAL in El Salvador, ENEE in Honduras, INDE in Guatemala, ENATREL in Nicaragua, and the combined ASEP-ETESA framework in Panama), and the regulatory frameworks for private generation and storage vary widely.
Costa Rica is the most attractive Central American market in 2026. The country is 99%+ renewable in generation, the Law 10086 framework (2022) allows net metering for up to 1 MW, and the regulator ARESEP has approved storage interconnection rules. Panama is the second most attractive, with the Law 149 (2020) framework allowing private generation and the ASEP-ETESA framework gradually opening to storage. Guatemala is the largest by installed capacity, with a CNEE (Comisión Nacional de Energía Eléctrica) framework that allows private generation above 5 MW. Honduras, El Salvador, and Nicaragua are smaller but growing.
For the Central American PV+ESS+EV market in 2026, the headline is: the projects are smaller, the tariff spreads are less punitive than in California, the demand charges are less aggressive, and the export frameworks are more variable. The right project is, almost always, a behind-the-meter project anchored to a single host (a logistics hub, a commercial center, a port) with the battery sized to cover the host's own demand charges and to ride through the frequent grid outages that characterize the region. Grid-forming capability — the ability to operate as a microgrid during a utility outage — is not optional in Central America in 2026. It is table stakes.
Chapter 5 — Sizing the Stack: A Practical Engineering Methodology
Now that we have covered the topology, the dispatch logic, the comparative economics, and the regional market reality, it is time to put a methodology to the sizing question. Sizing a PV+ESS+EV station is a multi-variable optimization with at least eight input parameters and three output parameters. The input parameters are: (1) the number and power class of chargers, (2) the expected daily charger load profile, (3) the site's available roof or carport area, (4) the site's grid interconnection capacity, (5) the local tariff structure, (6) the local weather and solar resource, (7) the host's demand-charge baseline, and (8) the host's resilience requirements. The output parameters are: (1) PV array size, (2) ESS power rating, and (3) ESS energy capacity. The optimization is to find the lowest-LCOE combination of the three that meets the host's peak-shaving, self-consumption, and resilience targets.
5.1 Step 1 — Characterize the Charger Load
The first step is to model the daily charger load profile. The profile depends on the site type. A highway-corridor site has a daytime peak, a midday shoulder, and a low overnight baseline. A fleet-depot site has an evening peak (when trucks return) and a midday baseline. A retail site has a Saturday and Sunday peak and a weekday shoulder. A municipal site has a daytime weekday peak and a weekend low. Each profile interacts with the PV production curve and the tariff curve differently, and each requires a different optimal PV/ESS ratio.
A 2026-grade charger-load model is built from at least 90 days of historical OCPP session data (if the site is a retrofit) or from a comparable site model (if the site is a greenfield). The model should be hourly at minimum, and ideally 15-minute, and it should be run for an entire year to capture seasonal variation. A 1 MW / 6-dispenser highway-corridor site in California, for example, sees a summer daily throughput of 4,500 kWh to 6,500 kWh, a winter daily throughput of 1,800 kWh to 3,200 kWh, and a shoulder-season daily throughput of 2,800 kWh to 4,500 kWh. The ESS that is right-sized for the summer peak is over-sized for the winter trough, and the engineer must decide whether to size for the summer (and accept idle capacity in winter) or to size for the average (and accept grid imports in summer peak).
5.2 Step 2 — Characterize the PV Resource
The second step is to model the PV resource at the site. In 2026, the best public data sources are NREL NSRDB (National Solar Radiation Database) for the US, PVGIS (Photovoltaic Geographical Information System) from the EU JRC for Europe, and SWERA (Solar and Wind Energy Resource Assessment) from UNEP for Central America. For a project that is past the feasibility stage, the engineer should commission a one-year on-site solar resource measurement (a Class I or Class II pyranometer) and compare it against the public database. A 10% error in the PV resource estimate is a 10% error in the project revenue, and a 10% error in the project revenue is a 2% to 3% error in the project IRR.
5.3 Step 3 — Characterize the Tariff
The third step is to model the local tariff at 15-minute resolution for an entire year. This is the step that is most often skipped by first-time developers, and it is the step that has the highest ROI when it is done well. The tariff model must include the energy charge (TOU or real-time), the demand charge, any riders or surcharges (e.g., the DWR charge in California, the EEG-Umlage history in Germany, the FES in Spain), any fixed monthly fees, and any applicable taxes. A common mistake is to model only the energy charge and to forget the demand charge, which is the single largest line item on a C&I bill in California, Texas, New York, and Mexico.
5.4 Step 4 — Solve the Optimization
The fourth step is to solve the optimization. The decision variables are PV size, ESS power, and ESS energy. The objective is to minimize LCOE (or to maximize NPV / IRR) subject to the constraints. The constraints are: (a) the site can host no more PV than its carport can support, (b) the ESS cannot exceed the transformer's LV-side capacity, (c) the ESS cannot discharge below the minimum SOC floor, (d) the ESS cannot charge above the maximum SOC ceiling, (e) the ESS cannot cycle more than once per 24 hours (or twice, if the design calls for it), and (f) the anti-backflow constraint must hold at every 15-minute interval.
For a representative 1 MW / 6-dispenser / 1 MWh site in California in 2026, the typical optimal solution looks like this: 800 kW to 1,200 kW PV carport (the upper end is preferred in California because of the high NEM 3.0 export penalty and the high self-consumption value), 1,000 kW to 1,500 kW ESS power (to support 360 kW to 720 kW of charger load plus reserve), and 2,000 kWh to 4,000 kWh of ESS energy (to support a 4-hour discharge at the rated power plus a 1-hour reserve). The right ratio is approximately 1:1 PV-to-ESS power, 1.0 to 1.5 MWh of ESS per MW of PV, and 2 to 4 hours of ESS energy at the rated power. Sites that want to participate in VPP / DR programs generally size the ESS for 4 hours; sites that only want to do peak-shaving and self-consumption can size for 2 to 3 hours.
5.5 Step 5 — Sensitivity and Stress
The fifth step is the sensitivity and stress analysis. The standard sensitivity inputs in 2026 are: PV production (±10%), charger load (±20%), tariff (±15%), capex (±15%), and discount rate (±200 bps). The standard stress inputs are: a one-week heat wave that cuts PV production by 25% while increasing the demand charge by 30%, a one-week cold snap that increases heating load and grid imports, a one-month utility outage that forces the site into microgrid mode, and a regulatory change (a NEM revision, a tariff revision, a demand-charge ratchet change) that fundamentally alters the revenue model. A project that does not pass all five stress tests is a project that will not survive its first operational year.
Hardware reference — 20 ft 3 MWh / 5 MWh liquid-cooled container ESS
For the largest C&I PV+ESS+EV sites and for FTM utility-adjacent projects, the 20 ft liquid-cooled container has become the dominant architecture in 2026. The MateSolar نظام تخزين الطاقة في حاوية تبريد سائلة بقدرة 20 قدمًا بقدرة 3 ميجاوات ساعة بقدرة 5 ميجاوات ساعة is built around a 20 ft ISO high-cube container, a 3 MWh to 5 MWh LFP battery architecture, a 1.5 MW to 2.5 MW bidirectional PCS, an integrated liquid cooling loop, an integrated fire suppression system (aerosol + water mist or Novec 1230), and a 10-year performance warranty. It is the system behind the largest MateSolar reference projects in Texas, Arizona, southern Spain, the Randstad, and the Mexican Bajío. It is fully grid-forming capable, supports IEEE 1547-2018 Category III, and is the smallest MateSolar container that supports the 1,250 V to 1,500 V DC bus architecture that is becoming standard on the largest 2026 sites.
Chapter 6 — ROI Math, Tariff Stacking, and Case Snapshots
This chapter puts dollars on the chapters above. All numbers are 2026 planning estimates anchored to public tariff data and to the capex of the MateSolar 500KW Hybrid Solar System, the 100kW/232kWh and 125kW/261kWh Liquid-Cooled Outdoor Cabinet ESS, the 40Ft 1MWh 2MWh Air-Cooled Container ESS, and the 20ft 3MWh 5MWh Liquid Cooling Container ESS. Real projects will vary, sometimes by 15% to 25%, but the order of magnitude is consistent across the markets in scope.
6.1 Revenue Stack for a 1 MW / 6-Dispenser / 1 MWh Site in California
Table 6.1 — Indicative 2026 annual revenue stack for a 1 MW PV / 1 MWh ESS / 6 × 360 kW charger site in California.
| Revenue Line | Annual Estimate (USD) | سائق | الملاحظات |
| Charger kWh sales (gross margin) | $420,000 – $620,000 | 2,200 MWh/year throughput × $0.20 – $0.28/kWh margin | Driven by dwell time, retail price, and utilization |
| PV self-consumption savings | $95,000 – $145,000 | 1,100 MWh/year self-consumed × $0.09 – $0.13/kWh NEM 3.0 ACC vs. retail | Driven by PV production and self-consumption ratio |
| Energy arbitrage (peak shave / valley fill) | $140,000 – $220,000 | 700 MWh/year cycled × $0.20 – $0.32/kWh spread | Driven by TOU spread and battery cycles |
| Demand-charge management | $85,000 – $160,000 | 500 kW to 800 kW of capped demand × $12 – $25/kW-month × 12 | Driven by tariff class and ratchet |
| VPP / DR participation (CAISO, PG&E, SCE, SDG&E programs) | $35,000 – $70,000 | Capacity payment + energy payment + ancillary services | Driven by FERC Order 2222 implementation |
| Renewable Energy Certificate (REC) sales | $15,000 – $40,000 | 1,200 MWh/year × $0.01 – $0.03/kWh | Driven by REC market price and eligibility |
| Microgrid resilience (avoided outage cost) | $10,000 – $40,000 | Site-host value of ride-through capability | Highly site-specific |
| Total annual gross | $800,000 – $1,295,000 | / | / |
Against a turnkey capex (PV+ESS, excluding chargers, civil, and interconnection) of roughly $1.8M to $2.4M, an annual O&M of $40k to $70k, and a 25-year asset life, the IRR on the storage+PV system alone is in the 14% to 22% range in California in 2026, depending on the discount rate, the financing structure, and the ITC stack. Add the ITC (30% base + 10% to 30% adders) and the effective capex drops by 30% to 60%, and the unlevered IRR clears 25% in many structures.
6.2 Revenue Stack for a 1 MWh Site in Bavaria, Germany
Table 6.2 — Indicative 2026 annual revenue stack for a 500 kW PV / 1 MWh ESS / 4 × 360 kW charger site in Bavaria.
| Revenue Line | Annual Estimate (EUR) | سائق |
| Charger kWh sales (gross margin) | €240,000 – €360,000 | 1,400 MWh/year × €0.17 – €0.26/kWh margin |
| PV self-consumption (EEG compensation + retail value) | €55,000 – €85,000 | 600 MWh/year self-consumed × €0.09 – €0.14/kWh |
| المراجحة في الطاقة | €70,000 – €110,000 | 700 MWh/year cycled × €0.10 – €0.16/kWh spread |
| Leistungspreis (demand-charge) savings | €40,000 – €75,000 | 500 kW to 700 kW × €80 – €110/kW/year |
| Regelenergie / aFRR / FCR participation | €25,000 – €55,000 | Capacity + energy payment on the TSO balancing market |
| Section 14a EnWG (controllable load) compensation | €10,000 – €20,000 | DSO compensation for grid-friendly charging |
| Total annual gross | €440,000 – €705,000 | / |
Against a turnkey capex of roughly €1.3M to €1.7M and an annual O&M of €30k to €55k, the unlevered IRR is in the 10% to 16% range. German projects are generally less leveraged than US projects on the storage side because the German demand-charge equivalent is lower, but the balancing-market and Section 14a revenue lines are stronger and more durable.
6.3 Revenue Stack for a 1 MWh Site in Central Mexico
Table 6.3 — Indicative 2026 annual revenue stack for a 500 kW PV / 1 MWh ESS / 4 × 360 kW charger site in the Mexican Bajío.
| Revenue Line | Annual Estimate (MXN) | سائق |
| Charger kWh sales (gross margin) | MXN $2.4M – $3.6M | 1,200 MWh/year × MXN $2.0 – $3.0/kWh margin |
| PV self-consumption | MXN $0.6M – $0.9M | 500 MWh/year self-consumed × MXN $1.2 – $1.8/kWh retail value |
| Energy arbitrage (peak shave) | MXN $0.9M – $1.4M | 700 MWh/year cycled × MXN $1.3 – $2.0/kWh spread |
| Demanda Facturable savings | MXN $1.0M – $1.8M | 400 kW to 600 kW × MXN $300 – $450/kW-month × 12 |
| MEM / Cenace wholesale (where eligible) | MXN $0.2M – $0.5M | Capacity + energy in the wholesale market |
| Total annual gross | MXN $5.1M – $8.2M | / |
Against a USD-denominated capex of $1.2M to $1.6M (the storage premium over a traditional site) and an annual O&M of $25k to $45k, the unlevered IRR in Mexican pesos is in the 18% to 28% range, and the USD-equivalent IRR is even higher when the peso weakens. The Mexican market is, in 2026, the highest-marginal-ROI market in scope.
6.4 Project Payback Snapshots
Table 6.4 — Indicative 2026 PV+ESS premium and simple payback for a 1 MWh site in each market in scope.
| سوق | PV+ESS Premium (local currency) | Annual Net Savings (local currency) | Simple Payback (years) | Unlevered IRR (range) |
| California, USA | $900k – $1,100k | $280k – $420k | 2.5 – 3.5 | 14% – 22% |
| Texas, USA | $900k – $1,100k | $220k – $340k | 3.0 – 4.5 | 11% – 18% |
| New York, USA | $950k – $1,150k | $260k – $380k | 2.8 – 4.0 | 12% – 20% |
| Ontario, Canada | CAD $1.3M – $1.6M | CAD $200k – $300k | 4.0 – 6.0 | 8% – 14% |
| Bavaria, Germany | €700k – €900k | €180k – €270k | 3.0 – 4.0 | 10% – 16% |
| هولندا | €700k – €900k | €170k – €250k | 3.0 – 4.5 | 9% – 15% |
| UK | £650k – £850k | £190k – £280k | 2.5 – 4.0 | 11% – 17% |
| Madrid, Spain | €600k – €800k | €150k – €240k | 3.0 – 4.5 | 10% – 16% |
| Central Mexico | MXN $13M – $18M | MXN $3.5M – $5.2M | 3.0 – 4.0 | 18% – 28% |
| كوستاريكا | $700k – $950k USD | $140k – $220k USD | 4.0 – 6.0 | 8% – 14% |
The table above is the most important table in this article. It is the table that an EPC, a developer, a financier, and a site host all need to see. The payback period is 2.5 to 6.0 years across every market in scope, and the unlevered IRR is 8% to 28%. There is no market in scope in which a properly sized and properly operated PV+ESS+EV station fails to clear an 8% IRR, and there are several markets in which the IRR clears 20% on the unlevered basis.
Chapter 7 — Risk, Compliance, and What Operators Get Wrong
A PV+ESS+EV station is a high-capex, long-lived, software-driven infrastructure asset. The risks are real, and the projects that fail in 2026 are almost always failing for one of the reasons below.
7.1 Risk 1 — Undersized Transformer or Interconnection
The single most common failure is a transformer or interconnection that is too small to support the planned charger, PV, and ESS. The site goes live at 60% of the planned capacity, the operator cannot get the utility to upgrade the transformer for 12 to 24 months, and the project's IRR is destroyed. The fix is to commission a formal interconnection study before capex commitment, and to oversize the transformer by 25% to 50% beyond the planned nameplate.
7.2 Risk 2 — Mis-Sized ESS
The second most common failure is an ESS that is too small to cover the peak-shaving target, or too large to cycle economically. The fix is the methodology in Chapter 5: model the load, model the tariff, model the PV, and run the optimization across at least three PV sizes and three ESS sizes. A 1 MWh ESS that is sized for the average day is the wrong size. A 1 MWh ESS that is sized for the summer peak day is the right size, with the understanding that the winter trough leaves the asset under-utilized for 5 to 6 months of the year.
7.3 Risk 3 — Poor EMS Tuning
The third most common failure is an EMS that is shipped with default logic and never tuned to the site. The result is a battery that charges and discharges at the wrong hours, that misses the demand-charge peak, that exports when it should be charging, and that does not participate in the VPP program even though it was registered for one. The fix is to budget 60 to 120 hours of EMS tuning in the first 90 days of operation, and to commit to quarterly reviews thereafter. A good EMS in 2026 is not a "set and forget" system. It is a continuously tuned system, and the operator that treats it as a set-and-forget asset is the operator whose IRR disappoints.
7.4 Risk 4 — Fire Code and Permitting
The fourth most common failure is a permitting or fire-code issue. NFPA 855 in the US, EN 50549 / VDE-AR-E 2510 in Germany, and the local fire code in every jurisdiction impose setback, ventilation, and fire-suppression rules on lithium battery installations. The fix is to engage the local fire marshal and the local building department early — ideally at the feasibility stage — and to design the ESS layout to the most restrictive applicable code. A well-engineered project in 2026 always ships with a UL 9540A or EN 62619 test report for the ESS, and a fire-safety plan that is signed off by a qualified fire-protection engineer.
7.5 Risk 5 — Tariff and Regulatory Drift
The fifth most common failure is a tariff or regulatory change that destroys the revenue model. California restructured its TOU windows in 2025 and 2026. Germany restructured its grid fees in 2024. The Netherlands is phasing down its saldering framework through 2031. Mexico is restructuring its CFE tariff under the 2024 energy reform. The fix is to design the project for a tariff-stress scenario that assumes a 25% reduction in the peak/off-peak spread, a 25% reduction in the demand charge, and a 50% reduction in the VPP revenue. A project that survives that stress scenario will survive anything the regulator can throw at it.
7.6 Risk 6 — O&M and Spare Parts
The sixth most common failure is an O&M plan that is too thin to keep the asset online. A 1 MW PV+ESS+EV station in 2026 is a 24/7/365 asset. A charger that is offline for a day loses $1,000 to $3,000 of revenue. A battery that is offline for a month loses $20,000 to $60,000 of revenue. The fix is a 24/7 remote monitoring contract, a 4-hour on-site response SLA in any major metro, a 48-hour response SLA in rural areas, and a spare-parts inventory that covers at least one of every critical subsystem (the PCS module, the BMS controller, the charger dispenser, the EMS controller, and a 5% spare of the module-level PV components). Operators that do not commit to this level of O&M discipline are operators whose assets decay.
7.7 Risk 7 — Insurance and Lender Comfort
The seventh most common failure is an insurance policy or a lender that does not understand lithium battery risk. As of mid-2026, the insurance market for BTM C&I storage in the US, EU, and Mexico is functional but expensive — typical all-risk property premiums for a 1 MWh site are in the $15,000 to $40,000 per year range, and the deductibles on the battery-specific rider are in the $50,000 to $250,000 range. The fix is to engage an insurance broker that has a track record with BTM storage, to insist on UL 9540A or EN 62619 test reports, and to bring the broker into the design conversation at the feasibility stage, not after the project is built.
7.8 The Implementation Roadmap — From Feasibility to Commercial Operation in Five Phases
The single most useful framework we have found for first-time PV+ESS+EV developers is a five-phase implementation roadmap. Each phase has a defined entry gate, a defined exit gate, and a defined set of deliverables. The five phases, with the typical 2026 timelines for a 1 MW / 6-dispenser C&I project in California or Germany, are below.
Phase 1 — Feasibility and Site Control (1 to 3 months). The site is evaluated for solar resource, grid interconnection headroom, host demand-charge baseline, and host resilience requirements. The site control instrument (a lease, an easement, a power-purchase agreement, or a sale-leaseback) is negotiated. The deliverable is a one-page feasibility memo with a preliminary system size, a preliminary IRR range, and a "go / no-go" recommendation. The exit gate is a signed site control instrument and a budget allocation for Phase 2.
Phase 2 — Engineering and Interconnection (2 to 4 months). The site is surveyed, the geotechnical report is issued, the single-line diagram is drafted, the equipment is selected, and the interconnection application is submitted to the local utility. The deliverable is a 30% engineering package (single-line, site plan, equipment list, one-line protection study) and an interconnection queue position letter. The exit gate is a utility-issued interconnection agreement (or, in a constrained zone, a queue position number).
Phase 3 — Permitting and Financing (2 to 4 months, runs in parallel with Phase 2). The building permit application is submitted to the local building department, the fire department sign-off is requested, and the project financing is arranged (a tax equity + debt structure for US projects, a project finance or refinancing structure for European projects, a corporate PPA or own-balance-sheet structure for Mexican projects). The deliverable is a building permit and a financing commitment. The exit gate is a building permit and a fully executed financing commitment letter.
Phase 4 — Procurement and Construction (3 to 7 months). The equipment is ordered, the factory-acceptance test is witnessed, the equipment is shipped, the site civil work is done, the equipment is installed, the system is commissioned, and the performance test is completed. The deliverable is a commissioned PV+ESS+EV station with a passing performance test report. The exit gate is a signed performance test report and a provisional acceptance certificate.
Phase 5 — Operation and Optimization (ongoing). The asset is operated, the EMS is tuned, the O&M contract is executed, the spare-parts inventory is maintained, and the VPP / DR / capacity-market registrations are completed. The deliverable, every month for the next 20 years, is a monthly operating report that compares actual performance against the financial model and identifies any under-performing revenue line. The exit gate is the asset's 25-year decommissioning plan.
7.9 The Standards and Certifications That Matter in 2026
A 2026-grade PV+ESS+EV station sits at the intersection of three standard families — PV, ESS, and EV — and the operator who understands the standards is the operator who can defend the project at a lender's technical due-diligence review. The standards that matter, organized by sub-system, are below.
Table 7.1 — Key 2026 standards and certifications for a PV+ESS+EV charging station, by sub-system.
| Sub-System | Key Standards (US / EU / Mexico / CA) | What It Covers |
| الوحدات الكهروضوئية | UL 61730 / IEC 61730 / IEC 61215 / IEC 61701 | Module safety, performance, salt-mist corrosion |
| PV Inverters | UL 1741 / IEEE 1547-2018 / IEC 62109 / VDE-AR-N 4105 | Inverter safety, anti-islanding, grid support functions, ride-through |
| ESS Cells | UL 1973 / IEC 62619 / UN 38.3 / UL 9540A | Cell safety, transport, large-scale fire propagation |
| ESS System | UL 9540 / EN 50549 / IEC 62933 / NOM-001-SEDE | ESS safety as a system, interconnection, Mexican grid code |
| ESS Installation | NFPA 855 / IFC Chapter 12 / EN 62619 / LBO / Código Técnico | Setback, ventilation, fire suppression, signage |
| EV Chargers | UL 2202 / IEC 61851-1 / IEC 61851-23 / SAE J1772 / SAE J3400 / ISO 15118-20 | Charger safety, communication protocol, Plug & Charge, V2G |
| اتصالات | OCPP 1.6J / OCPP 2.0.1 / Modbus / Sunspec / IEEE 2030.5 / OpenADR 2.0b / IEC 61850 | Charger, inverter, ESS, and utility communication |
| Cyber Security | IEC 62443 / NIST 800-82 / NERC CIP (where applicable) | OT cyber-security for the EMS, the chargers, and the utility dispatch gateway |
| Quality / Manufacturing | ISO 9001 / ISO 14001 / ISO 45001 | Vendor quality management system, environmental management, occupational health and safety |
The 2026 lesson on standards is that a project that ships with a complete standards pack (test reports, certificates, declarations of conformity) is a project that closes financing in 60 to 90 days. A project that has to commission the testing after the contract is signed is a project that adds 6 to 12 months to the financing close. The standards pack is not a "nice to have" — it is a financing precondition.
7.10 A 2026 Glossary of Acronyms and Trade Terms
The following acronyms and trade terms appear repeatedly in the 2026 PV+ESS+EV trade press and in the equipment vendor datasheets. Every operator and developer should be fluent in them.
- AC / DC coupling — system architectures in which PV, ESS, and chargers are wired together on a common AC bus (AC) or a common DC bus (DC).
- aFRR — automatic Frequency Restoration Reserve, the secondary balancing product in the European TSOs.
- BDEW — Bundesverband der Energie- und Wasserwirtschaft, the German energy and water industry association; the source of the standard C&I tariff structure.
- BMS — Battery Management System; the electronics that monitor and protect the LFP cells.
- BTM / FTM — Behind-The-Meter / Front-of-the-Meter; the two fundamental C&I vs. utility-side classifications.
- التحكم والأجهزة — Commercial and Industrial; the customer segment served by the products in this article.
- CFE — Comisión Federal de Electricidad, the Mexican state utility.
- CMS — Central Management System, the cloud-based monitoring and control layer above the EMS.
- DER — Distributed Energy Resource; the regulatory umbrella for PV, ESS, and controllable loads.
- DOD / SOC — Depth of Discharge / State of Charge; the two fundamental state variables of an LFP cell.
- DR — Demand Response; the utility program that pays for short-term load reduction.
- DSO / TSO — Distribution System Operator / Transmission System Operator; the two layers of grid operator in Europe and the Americas.
- EEG — Erneuerbare-Energien-Gesetz, the German renewable energy law.
- شركة هندسة ومشتريات وتسليم — Engineering, Procurement, and Construction; the contractor model for C&I infrastructure projects.
- نظام إدارة الطوارئ — Energy Management System; the software that runs the dispatch logic.
- FCAS / FCR — Frequency Control Ancillary Services / Frequency Containment Reserve; the primary balancing products in the European and Australian TSOs.
- FERC — Federal Energy Regulatory Commission; the US federal regulator for interstate electricity and natural gas.
- GFM / GFL — Grid-Forming / Grid-Following; the two inverter control modes.
- HJT — Heterojunction; a high-efficiency PV cell technology competing with TOPCon.
- IIJA — Infrastructure Investment and Jobs Act; the 2021 US federal infrastructure law.
- IRA — Inflation Reduction Act; the 2022 US federal energy law that provides the ITC.
- ISO 15118 — the international standard for the communication between an EV and a charger, including Plug & Charge and V2G.
- ITC — Investment Tax Credit; the US federal tax credit for clean energy projects.
- تكلفة الطاقة المستوية — Levelized Cost of Energy; the standard metric for the all-in cost of an energy asset.
- LFP — Lithium iron phosphate; the dominant stationary storage cell chemistry in 2026.
- MCS — Megawatt Charging System; the high-power standard for heavy-duty truck and bus charging.
- MPPT — Maximum Power Point Tracking; the inverter function that maximizes PV output under varying irradiance.
- NEM 3.0 — Net Energy Metering 3.0; the California net-metering regime that took effect in April 2023.
- NEVI — National Electric Vehicle Infrastructure; the IIJA funding program for US highway-corridor charging.
- NFPA 855 — the US standard for the installation of stationary energy storage systems.
- NMC / NCA — Nickel Manganese Cobalt / Nickel Cobalt Aluminum; the two chemistries that lost the 2020s to LFP.
- OCPP — Open Charge Point Protocol; the standard communication protocol between chargers and back-office systems.
- خدمة العملاء — Power Conversion System; the bidirectional AC-DC converter inside an ESS.
- PERC / TOPCon — Passivated Emitter and Rear Cell / Tunnel Oxide Passivated Contact; the two dominant 2026 PV cell technologies.
- بي بي إيه — Power Purchase Agreement; the offtake contract for a renewable project.
- RPS / CES — Renewable Portfolio Standard / Clean Energy Standard; the state-level mandates that drive utility procurement.
- SCADA — Supervisory Control and Data Acquisition; the industrial control layer for utility-scale systems.
- SOC / SOH — State of Charge / State of Health; the operational and lifecycle health metrics of an LFP cell.
- TOU — Time of Use; the rate structure in which the energy price varies by time of day.
- يو إل 9540 إيه — the test method for evaluating thermal runaway fire propagation in battery energy storage systems.
- V2G / V2X — Vehicle-to-Grid / Vehicle-to-Everything; the bidirectional charging architectures.
- VPP — Virtual Power Plant; the aggregation of DERs for wholesale market participation.
- VSM — Virtual Synchronous Machine; the grid-forming inverter control mode.
7.11 2026 Lessons Learned — What the Top 10% of Operators Do Differently
After five years of operating PV+ESS+EV stations at scale across North America, Europe, and Central America, the top decile of operators in 2026 share a set of habits that the bottom 90% do not. We have catalogued them below as a self-assessment checklist for any new project team.
Lesson 1 — They size for the worst month, not the average month. The top operators right-size the PV and the ESS to cover the July or August peak, not the annual average. The under-utilized capacity in December and January is treated as a feature, not a bug, because it leaves headroom for VPP registration, demand-response events, and unexpected one-off peak days.
Lesson 2 — They treat the EMS as a continuously tuned asset. The top operators allocate 60 to 120 hours of EMS tuning in the first 90 days, then a recurring quarterly review with their EMS vendor. They do not let the EMS run on factory defaults past the second month of operation. The 2% to 4% IRR uplift from a well-tuned EMS, compounded over 20 years, is the single highest-leverage operational decision in the project.
Lesson 3 — They register the VPP revenue stream at commissioning, not at year three. FERC Order 2222 in the US and the equivalent EU frameworks reward early registration. The top operators register the site for VPP, DR, and capacity-market participation in the same month that the site achieves commercial operation. The bottom 90% wait until the project is "stable," which means year three, by which time the early-bird incentives have been paid out to someone else.
Lesson 4 — They buy the transformer with 50% headroom, not 25%. Every site that the top operators have built since 2022 has a box transformer with at least 50% nameplate headroom over the planned peak coincident load. The marginal cost is 8% to 12% of the transformer price. The marginal value, in the form of avoided transformer upgrade costs and avoided queue re-entry delays, is several hundred thousand dollars and 12 to 24 months of project schedule.
Lesson 5 — They insist on UL 9540A or EN 62619 test reports at RFP, not at commissioning. The top operators refuse to pay a deposit on an ESS that does not have a current UL 9540A or EN 62619 test report from a Nationally Recognized Testing Laboratory (NRTL) or an EU Notified Body. The bottom 90% accept the vendor's "test report in progress" commitment at contract signing and then discover, 12 months later, that the report was never going to be issued.
Lesson 6 — They engage the local fire marshal at feasibility, not at permit. The top operators invite the local fire marshal to the site at the feasibility stage, share the proposed ESS layout, and request a pre-application review. The cost is two hours of the marshal's time and a small fee. The benefit is a 4 to 6 month reduction in the permit review cycle and zero surprises at the final inspection.
Lesson 7 — They negotiate a 24/7 monitoring contract with a 4-hour SLA, not a 48-hour SLA. The top operators understand that a charger that is offline for a day loses $1,000 to $3,000 of revenue, and a battery that is offline for a week loses $5,000 to $15,000 of revenue. They pay the 30% premium for a 4-hour on-site response SLA in any major metro, and they keep a 5% spare-parts inventory on site or in a regional depot. The bottom 90% accept the 48-hour SLA and learn the hard way.
Lesson 8 — They treat the carport as a marketing asset, not a cost center. The top operators work with their marketing team at the carport design stage to integrate lighting, signage, EV driver wayfinding, and a customer-facing real-time display. The carport is the part of the asset the customer photographs, the press writes about, and the host uses in their own annual report. Treating the carport as a marketing asset — not a cost center — is what differentiates a top-decile site from a bottom-decile site in 2026.
Lesson 9 — They commit to a 5-year EMS roadmap, not a single EMS purchase. The top operators sign a 5-year EMS service agreement that includes firmware updates, security patches, forecasting model retraining, and quarterly tuning. They do not buy the EMS as a one-time capital purchase and then run it on autopilot. The EMS is a living software system, and treating it as a 5-year subscription is what keeps the project at the front of the optimization curve.
Lesson 10 — They plan for the second battery at the first battery's commissioning. The top operators, on day one of commercial operation, file the interconnection study for the second battery. The reason is that the second battery's interconnection study is the gating item for any future expansion, and the queue is the same queue that every other developer is trying to enter. By the time the bottom 90% decide they want a second battery, the queue is 24 to 36 months long. By that time, the top 10% are already operating their second battery.
Chapter 8 — Frequently Asked Questions
The following FAQ is a curated compilation of the most common — and the most operationally important — questions that MateSolar's commercial team, engineering team, and EPC partners are fielding from site hosts, fleet operators, charge point operators, project developers, and financiers in 2026. The answers reflect the best available public information as of July 2026 and the operating experience of the MateSolar reference fleet.
Q1. What is a PV+ESS+EV charging station, in one sentence?
A PV+ESS+EV charging station is a behind-the-meter or front-of-the-meter microgrid that combines a photovoltaic carport (PV), a battery energy storage system (ESS), and electric-vehicle chargers (EV) on a common AC bus, and that is operated by an energy management system (EMS) to maximize the value of the local solar resource, the local tariff, and the local demand-charge structure.
Q2. Why is a PV+ESS+EV station better than a traditional grid-tied charging station?
A traditional station imports 100% of its energy from the grid at the prevailing tariff, which means the operator's margin is squeezed by the tariff on the cost side and by competing chargers on the revenue side. A PV+ESS+EV station can produce its own energy (PV), store it (ESS), and dispatch it at the time of day when it is most valuable (peak hours), which means the operator captures the peak/off-peak spread, the demand-charge savings, and (where available) the VPP / DR / capacity-market revenue. The two stations look similar on day one and diverge by year three.
Q3. What is the most economic operating logic for a PV+ESS+EV station?
During peak hours, prioritize PV power to the chargers, then discharge the ESS to cover the residual, and import from the grid only as a last resort. During valley hours, charge the ESS from the grid at the lowest tariff rate, and continue to charge the ESS from PV in the morning shoulder. During shoulder hours, run the same priority order. The dispatch logic should be tuned to the local tariff, the local PV resource, and the host's resilience requirements, and it should be re-tuned at least quarterly.
Q4. What is peak shaving, and why is it the single most valuable thing the ESS does?
Peak shaving is the operation of discharging the ESS during the site's peak demand window so that the site's grid import does not exceed a target threshold. The target is set by the local demand-charge tariff, and the savings are calculated as (target kW − actual kW) × demand charge × 12. On a California C&I tariff, a 500 kW peak-shave against a 1,200 kW charger load can save $90,000 to $160,000 per year. On a Mexican CFE Tarifa 2 / GDMTH tariff, the same 500 kW peak-shave can save $1M to $1.8M MXN per year.
Q5. What is valley filling, and why does it matter?
Valley filling is the operation of charging the ESS during the site's valley demand window. It matters because most C&I demand-charge tariffs have a ratchet clause: the monthly demand charge is the greater of (a) the actual peak in the month, or (b) a percentage (typically 50% to 80%) of the annual peak. By charging the ESS at a steady, predictable rate in every valley hour, the operator sets a high "floor" on the monthly demand, and that floor becomes the ratchet floor that protects the site from a one-off peak in a future month. The ratchet management value can be $50k to $150k per year on a large C&I account.
Q6. What is anti-backflow, and is it required?
Anti-backflow (also called anti-export) is the rule that the site is not allowed to export power to the grid. It is required by most North American DSOs (PG&E, SCE, SDG&E, ConEd, National Grid, Oncor, CenterPoint, Hydro-Québec, CFE) for BTM sites that do not have an explicit export contract, and by most European DSOs (E.ON, Bayernwerk, Liander, Stedin, UKPN, Iberdrola) for similar BTM sites. It is enforced by a reverse-power relay at the site-grid interconnection point. The standard 2026 implementation uses a CT at the interconnection and a dynamic EMS modulation of the ESS charge rate to keep the export at or below zero.
Q7. AC coupling or DC coupling — which is right for my site?
For small and mid-commercial sites (under 2 MW PV, under 4 MWh storage, fewer than 12 chargers), AC coupling is almost always the right answer. It is simpler, cheaper, easier to service, and easier to scale incrementally. For large C&I or FTM projects above those thresholds, DC coupling deserves a serious look, especially if the PV-to-storage ratio is high and the daily cycling is deep. The round-trip efficiency advantage of DC coupling is 2 to 4 percentage points, but the engineering and service complexity is meaningfully higher. Most 2026 reference projects are AC-coupled.
Q8. How large should the PV carport be?
As a rule of thumb, the PV carport should be sized to cover 60% to 100% of the site's annual charger energy consumption, with the upper end preferred in markets with punitive net-metering (e.g., California NEM 3.0) and the lower end preferred in markets with generous net-metering (e.g., Germany EEG pre-2024, Netherlands saldering). On a 1 MW / 6-dispenser site, the typical carport size is 800 kW to 1,200 kW. The carport structure should be designed for the local wind, snow, and seismic code, and it should include provisions for future expansion.
Q9. How large should the ESS be?
The ESS sizing depends on the local tariff and the host's resilience requirements. For pure peak-shaving in California or Texas, 1 to 2 hours of ESS at the rated PCS power is sufficient. For peak-shaving plus VPP participation in California, 4 hours is the standard. For highway-corridor sites in Germany and the Netherlands that participate in aFRR / FCR, 1 to 2 hours is the standard. For grid-forming microgrid sites in Central America, 4 to 8 hours is the standard. The typical 2026 C&I site sizes 1 MWh to 5 MWh.
Q10. What is the role of the integrated control cabinet?
The integrated control cabinet is the "site brain" that brings the AC outputs of the PV inverter, the ESS PCS, and the chargers onto a common 400/480 V AC bus, houses the protection and metering equipment, and houses the site controller and EMS gateway. In 2026, a well-specified integrated control cabinet on a 1 MW-class site includes a 1,600 A to 2,500 A main breaker, four to eight branch breakers, a Schneider, ABB, or Siemens industrial controller, a multi-function power meter, an OCPP backhaul, and a utility dispatch gateway (IEEE 2030.5, OpenADR 2.0b, or Sunspec).
Q11. How does the ESS communicate with the chargers?
The standard protocol stack in 2026 is OCPP 1.6J or OCPP 2.0.1 for the chargers, Modbus TCP / Sunspec for the PV inverter and the ESS PCS, and IEEE 2030.5 / OpenADR 2.0b for the utility dispatch. The site controller runs the EMS, sets the charger power setpoints in real time, and exposes the site to the cloud EMS and to the utility or VPP aggregator. OCPP 2.0.1 is preferred for new sites because of its native support for smart charging, ISO 15118-20 (Plug & Charge), and bidirectional charging (V2X).
Q12. What is the role of the box transformer?
The box transformer is the device that steps the site's low-voltage AC bus (400 V in the EU, 480 V in the US and Mexico) up to medium voltage (10 kV to 34.5 kV depending on the local utility) for the local distribution feeder. It is the hard ceiling on the site's grid import, and it is the device that the local utility scrutinizes in the interconnection study. Oversize the box transformer by 25% to 50% beyond the planned peak coincident load, and confirm that it is on the local utility's approved-equipment list before you commit to a vendor.
Q13. What fire code applies to a PV+ESS+EV station?
In the US, NFPA 855 (Standard for the Installation of Stationary Energy Storage Systems) applies, with state and local amendments. In the EU, the relevant standards are EN 50549 (interconnection), EN 62619 (battery safety), and the local fire code (LBO in Germany, DM 151/2018 in Italy, Código Técnico de la Edificación in Spain). In Mexico, NOM-001-SEDE applies, and the local fire code is enforced by the municipal Protección Civil. The universal best practice in 2026 is to ship the ESS with a UL 9540A or EN 62619 test report and a fire-safety plan signed off by a qualified fire-protection engineer.
Q14. Can the station operate as a microgrid during a utility outage?
Yes, if the station is built around a grid-forming (virtual synchronous machine, or VSM) ESS. In 2026, every MateSolar cabinet ESS and container ESS supports grid-forming mode. The grid-forming capability allows the ESS to set the local voltage and frequency reference, to which the PV inverter and the chargers synchronize. The result is a true microgrid that can ride through a utility outage indefinitely (limited by the PV production and the ESS SOC). For Central American sites, where utility outages are frequent, grid-forming is not optional — it is table stakes.
Q15. What is VPP participation, and how much is it worth?
A Virtual Power Plant (VPP) is the aggregation of distributed energy resources (DERs) — including PV, ESS, and controllable loads like EV chargers — into a single market participant that can bid the aggregated capacity, energy, and ancillary services into a wholesale market or a utility program. In California, programs like PG&E's Capacity Bidding Program, SCE's Demand Response, and the FERC Order 2222 implementation routinely pay $30/kW-year to $80/kW-year for the available headroom and head-foot of a 1 MWh to 5 MWh ESS. In Germany, the aFRR and FCR balancing markets pay similar amounts on a per-MW basis. VPP revenue is one of the fastest-growing revenue lines for PV+ESS+EV stations in 2026.
Q16. What is the typical payback period for a PV+ESS+EV station?
In California, the simple payback on the PV+ESS premium (over a traditional station of the same charger capacity) is 2.5 to 3.5 years. In Texas, New York, Germany, the Netherlands, the UK, Spain, and central Mexico, the payback is 3.0 to 4.5 years. In Ontario, Quebec, and Costa Rica, the payback is 4.0 to 6.0 years. The unlevered IRR on the storage and PV system alone is 8% to 28% across the markets in scope, with the highest returns in California, New York, and central Mexico, and the lowest in Ontario and Costa Rica. The full asset IRR (chargers + PV + ESS) is generally 2% to 4% higher than the storage-and-PV-only IRR.
Q17. What incentives are available in 2026?
In the US, the IRA ITC provides a 30% base credit plus 10% to 30% adders for qualifying projects, and the IIJA NEVI funding supports highway-corridor projects. In Canada, the federal CT-ITC provides 30% refundable tax credit, with provincial top-ups in Ontario (IESO), Quebec (Hydro-Québec), and Alberta (AESO). In the EU, the AFIR and the RED III framework provide the regulatory foundation, with member-state-level incentives on top (EEG in Germany, SDE++ in the Netherlands, FER X in Italy, RD 244/2019 in Spain). In Mexico, the 2024 energy reform and the 2025 CRE regulations provide the regulatory framework, with no federal-level storage-specific incentives as of mid-2026 but several state-level programs under development.
Q18. Can I add storage to an existing traditional charging station?
Yes, in most cases. The retrofit workflow is to (1) commission an interconnection study on the existing service, (2) verify that the existing transformer and switchgear have the headroom for the additional ESS import/export, (3) install the ESS in a cabinet or container adjacent to the existing service, (4) install a new integrated control cabinet (or retrofit the existing one) to bring the ESS onto the AC bus, (5) update the EMS to incorporate the storage, and (6) commission and tune. The typical retrofit timeline in 2026 is 4 to 8 months from capex commitment to commercial operation, and the typical retrofit IRR is similar to (or higher than) a greenfield project because the chargers and the grid interconnection are already in place.
Q19. What is the role of LFP in 2026?
Lithium iron phosphate (LFP) is the dominant cell chemistry for stationary energy storage in 2026, with greater than 75% market share in the C&I segment and greater than 85% in the FTM / utility-scale segment. LFP has won because of its superior safety profile (no thermal runaway below 250°C, no cobalt, no nickel), its long cycle life (6,000 to 12,000 equivalent full cycles to 80% capacity retention), its wide operating temperature range, and its rapidly falling cost. NMC and NCA chemistries retain a niche in space-constrained and weight-constrained applications, but for C&I PV+ESS+EV stations, LFP is the default in 2026 and will remain so through at least 2030.
Q20. How does the station participate in demand response (DR) programs?
A demand response (DR) program is a utility or aggregator program that pays a participant to reduce grid import during a declared event (typically a hot afternoon, a cold morning, or a grid emergency). For a PV+ESS+EV station, the DR event response is to (1) increase PV utilization (clip less), (2) discharge the ESS at maximum rate, (3) reduce or pause non-essential charger load (or shift it to a post-event window), and (4) optionally, export to the grid if an export contract is in place. The standard 2026 implementation is OpenADR 2.0b or IEEE 2030.5, and the dispatch signal is received by the EMS and executed by the site controller within 1 to 10 seconds. The payment is typically $0.50/kWh to $2.00/kWh of dispatched energy, plus a capacity payment for the committed headroom.
Q21. What is the future of V2G (vehicle-to-grid) for PV+ESS+EV stations?
V2G is technically ready in 2026 — the ISO 15118-20 standard is finalized, the first V2G-capable passenger vehicles (the Ford F-150 Lightning, the Hyundai Ioniq 5, the Kia EV9, the BYD Han, the NIO ET7) are on the road, and the first V2G-capable chargers (Wallbox Quasar 2, Fermata FE-15, ABB E-mobility V2G) are shipping. The market is, however, still small. The three regulatory frameworks that matter in 2026 are California (CPUC's V2G proceeding, expected to clear in 2026), the UK (the Electric Vehicles (Smart Charge Points) Regulations 2021 and the V2G Innovation Forum), and the Netherlands (the V2G pilot under the SDE++). Expect V2G to add a meaningful revenue line on PV+ESS+EV stations by 2027 to 2028.
Q22. What is the typical project timeline from feasibility to commercial operation?
A greenfield 1 MW PV+ESS+EV project in California in 2026 takes 12 to 18 months from feasibility to commercial operation: 1 to 3 months for feasibility and site control, 2 to 4 months for interconnection application and study, 2 to 3 months for permitting, 3 to 5 months for equipment procurement and manufacturing, 2 to 4 months for construction and commissioning, and 1 to 2 months for testing and commercial operation date. A retrofit on an existing station is faster — typically 4 to 8 months. A project in a constrained interconnection queue (CAISO, ERCOT, PJM, Oncor) can take 24 to 36 months from feasibility to commercial operation, which is why queue position is the single most important non-engineering variable in the project schedule.
Q23. What is the role of the EPC in a PV+ESS+EV project?
The Engineering, Procurement, and Construction (EPC) contractor is responsible for the design, the equipment procurement, the construction, the commissioning, and the performance warranty of the PV+ESS+EV station. In 2026, the best EPCs for PV+ESS+EV projects are vertically integrated — they have in-house electrical, structural, and civil engineering, they have direct relationships with the major equipment vendors (PV module, string inverter, ESS, charger), they self-perform the construction with their own crews, and they offer a 2-year to 5-year performance warranty on the whole system. The MateSolar reference projects in 2026 are built by EPCs in this category, with MateSolar providing the equipment, the EMS, and the technical support to the EPC and to the site host.
Q24. What about the operational support model for an owner who does not have a local install team?
A common concern from first-time operators is that they do not have a local installation or maintenance team. The 2026 model is to split the responsibility. The hardware is shipped with detailed installation manuals, pre-cut and pre-labeled cabling, factory-commissioned firmware, and an online commissioning portal. A remote MateSolar technical lead guides the on-site electrician through the physical install and the firmware commissioning over a video link. For hardware issues under warranty, the standard practice is to ship the affected module, subassembly, or component (e.g., a PCS module, an HVAC unit, a BMS controller, a charger dispenser) with an installation manual, and to guide the local electrician through the swap remotely. For software issues, the MateSolar technical team provides remote diagnostics, configuration updates, and EMS tuning over a secure remote session. For large C&I energy storage projects — typically 1 MWh and above — MateSolar can dispatch a field engineer to the site for commissioning, on-site EMS tuning, and post-commissioning optimization when the project genuinely requires it, and that support is bundled into the project scope at the contract stage.
Q25. What is the carbon payback of a PV+ESS+EV station?
The carbon payback of a 1 MW PV+ESS+EV station is approximately 2 to 4 years, depending on the local grid carbon intensity. A PV+ESS+EV station in California, where the grid carbon intensity is roughly 0.20 to 0.30 kgCO2e/kWh, has a carbon payback of 2.5 to 4 years. A station in Poland or the Czech Republic, where the grid carbon intensity is 0.60 to 0.80 kgCO2e/kWh, has a carbon payback of 1.5 to 2.5 years. A station in Costa Rica, where the grid is already 99% renewable, has a carbon payback of 8 to 12 years (and the carbon story is therefore not the primary value driver). Across the markets in scope, the carbon payback of a PV+ESS+EV station is shorter than the operational life of the asset, which means every project is, on a lifecycle basis, net-negative on carbon.
Conclusion — A One-Stop PV+ESS Partner for the Next Decade
The PV+ESS+EV charging station is no longer a clever idea. It is the default architecture for every new C&I charging site in North America, Europe, and Central America in 2026, and it is the architecture that the next decade of commercial and industrial energy infrastructure will be built around. The topology is mature. The dispatch logic is mature. The hardware is mature. The financial stack is mature. The regulatory stack is, in almost every market, fully open. The only thing that is not mature is the operator's understanding of all five at once.
This article has tried to give you that understanding. We have walked through the six blocks of the system topology — the box transformer, the integrated control cabinet, the ESS cabinet, the PV carport, the inverter, and the chargers — and explained the role of each in the system. We have walked through the most economic operating logic — peak-hour strategy, valley-hour strategy, anti-backflow, peak shaving, valley filling, and the EMS itself — and explained how each operation maps to a real revenue line. We have compared the PV+ESS+EV station with the traditional grid-tied charging station across five dimensions and put a number on the IRR in every market in scope. We have laid out the 2026 regional market reality for North America, Europe, and Central America. We have laid out a five-step sizing methodology and a sensitivity / stress framework. We have put a number on the revenue stack in California, Germany, and Mexico. We have enumerated the seven risks that kill projects. And we have answered 25 of the most common operator questions.
If you have read this far, you have what you need to start a serious conversation about a PV+ESS+EV project in any of the markets in scope. The next step is to talk to a hardware partner that owns the full stack — modules, inverters, cabinets, containers, EMS, and the integration know-how — and that can support you across the full project lifecycle, from feasibility through commissioning through long-term O&M.
About MateSolar — Your One-Stop PV+ESS Solution Provider
MateSolar is a one-stop PV+ESS solution provider for the commercial and industrial energy storage market. We design, manufacture, ship, and support the four product families that anchor the modern PV+ESS+EV station: the نظام الطاقة الشمسية الهجين التجاري بقدرة 500 كيلوواط for mid-commercial solar-plus-storage sites, the نظام تخزين طاقة خارجي مبرد بالسائل بخزانة 100 كيلوواط/232 كيلوواط ساعي و 125 كيلوواط/261 كيلوواط ساعي for cabinet-format C&I deployments, the نظام تخزين الطاقة حاويات 40 قدم 1 ميجاوات ساعة 2 ميجاوات ساعة مبرد بالهواء for medium commercial and fleet depot sites, and the نظام تخزين الطاقة في حاوية تبريد سائلة بقدرة 20 قدمًا بقدرة 3 ميجاوات ساعة بقدرة 5 ميجاوات ساعة for the largest C&I and utility-adjacent projects. From feasibility study and single-line diagram to long-term remote diagnostics, MateSolar supports every link in the value chain — and for large C&I energy storage deployments, we can dispatch a field engineer to the site when the project genuinely requires hands-on commissioning or on-site optimization. If you are planning a PV+ESS+EV station in North America, Europe, or Central America, MateSolar is the partner you want on the call.
Reach out today at www.mate-solar.com/contact for a feasibility review, a tailored ROI model, and a one-page product comparison across our full PV+ESS portfolio.