


As of May 2026, the United States energy storage market is undergoing a profound transformation—from demand-pull to supply-constrained expansion. AI data centers have emerged as the single most powerful driver of battery energy storage system (BESS) demand, with the North American power grid facing widening electricity deficits. According to China Securities research, the North American grid electricity gap is projected to reach 39.9 GW in 2026, 51.8 GW in 2027, and 67.8 GW in 2028, with AI data centers being the primary contributor. Simultaneously, developers plan to add a record 24 GW of utility-scale storage in 2026, up significantly from 15 GW added last year, and total U.S. battery storage capacity is forecast to rise from 44.6 GW to over 67 GW by the end of Q1 2027.
However, explosive demand is colliding with severe supply-side constraints. Transformer shortages are delaying or canceling nearly half of planned U.S. data center projects in 2026. FEOC compliance thresholds under OBBBA are raising the bar for ITC eligibility, with a 55% MACR requirement for energy storage projects commencing construction in 2026. And the March 2026 release of UL 9540A Sixth Edition has made large-scale fire testing mandatory, significantly raising industry entry barriers.
For Commercial & Industrial (C&I) energy storage buyers, developers, and financiers, navigating this complex landscape requires a partner with proven technical expertise, regulatory knowledge, and supply chain resilience. This comprehensive guide examines the six most urgent pain points facing C&I storage stakeholders in 2026, providing actionable insights, technical benchmarks, and strategic guidance for successful project deployment.
Зміст
1. The 2026 U.S. Energy Storage Landscape: Market Overview and Key Drivers
2. Pain Point #1: AI Data Center Infrastructure—Supply Chain Resilience and Expedited Delivery
3. Pain Point #2: EPC and Project Developers—FEOC Compliance, ITC Maximization, and Equipment Availability
4. Pain Point #3: Industrial and Retail Customers—PJM Capacity Markets and NEM 3.0 Profitability
5. Pain Point #4: Outdoor Cabinet Applications—UL 9540A Compliance and Extreme Environmental Protection
6. Pain Point #5: Critical Infrastructure Backup—Grid-Forming Technology and Long-Duration Reserve
7. Pain Point #6: Project Financiers and ISO Participants—Revenue Stacking and Bankability
8. Frequently Asked Questions
9. Conclusion: Partnering for Success in the New Energy Storage Era
1. The 2026 U.S. Energy Storage Landscape: Market Overview and Key Drivers
1.1 The AI Electricity Gap
The explosive growth of artificial intelligence computing is fundamentally reshaping U.S. electricity demand. AI data centers are now the primary driver of load growth across major Independent System Operators (ISOs), with power deficits projected to compound annually through 2028. The following table summarizes the projected North American grid electricity gap:
Table 1: Projected North American Grid Electricity Deficit (2026–2028)
| Рік | Projected Deficit (GW) | Primary Drivers | Cumulative AI-Driven Storage Demand (2025–2028 GWh) |
| 2026 | 39.9 | AIDC load, thermal retirements, transmission constraints | 18–80 |
| 2027 | 51.8 | Accelerating AIDC expansion, coal retirements | 80–180 |
| 2028 | 67.8 | Full AIDC demand realization, peaking capacity shortfall | 180–279 |
| 2030 | ~85 | Forecasted AIDC capacity, EV charging infrastructure | >300 |
Source: China Securities Research; GGII AI Data Center Energy Storage Forecast.
The International Energy Agency has reported that over the past five years, global data centers have increased their share of worldwide electricity consumption at an annual rate of 12%. The University of Chicago has made a breakthrough discovery demonstrating that grid-forming BESS technology can enable data centers not only to meet their own power needs but also to actively enhance grid stability, turning a potential liability into a grid asset.
1.2 EIA 2026 Storage Capacity Forecast
The U.S. Energy Information Administration projects that 2026 will be a record-breaking year for utility-scale battery storage additions. By Q1 2027, total U.S. battery storage capacity is expected to surge from 44.6 GW to over 67 GW. Texas (ERCOT) leads with 53% of new capacity (12.9 GW), followed by California (CAISO) with 14% (3.4 GW) and Arizona with 13% (3.2 GW).
Table 2: Top U.S. States by Planned 2026 Utility-Scale Storage Additions
| State/Region | Planned 2026 Capacity (GW) | Share of National Total | ISO/RTO | Primary Drivers |
| Texas | 12.9 | 53% | ERCOT | Data center load, wind/solar integration |
| California | 3.4 | 14% | CAISO | NEM 3.0 solar+storage, evening peak demand |
| Arizona | 3.2 | 13% | WECC | Data center expansion, utility procurement |
| Other States | 4.5 | 20% | MISO, PJM, NYISO, ISO-NE | Various regional drivers |
| Всього | 24.0 | 100% | / | / |
Source: EIA, February 2026
1.3 Global C&I BESS Market Trajectory
The global C&I battery energy storage market is forecast to reach
By 2036, this figure is projected to reach $21 billion—a roughly fivefold increase from 2026 levels. Key growth drivers include the construction of AI data centers, the deployment of 5G/6G telecommunications networks, and the expansion of electric vehicle (EV) charging infrastructure. In 2025, the associated cost in China stood at $87 per kilowatt-hour, whereas the cost for comparable NMC (nickel-manganese-cobalt) batteries was $128 per kilowatt-hour.
2. Pain Point #1: AI Data Center Infrastructure—Supply Chain Resilience and Expedited Delivery
The Challenge
For data center operators, cloud providers, and AI infrastructure developers in 2026, the most pressing question is not якщо storage is needed, but how to get equipment in time to meet energization deadlines. Nearly half of planned U.S. data center projects in 2026 face delay or outright cancellation due to critical power equipment shortages—specifically transformers, switchgear, and batteries. While roughly 12 to 16 GW of capacity is planned to go live in 2026, only about one-third of that is actually under active construction because electrical equipment lead times have grown increasingly extended.
The ripple effects are severe. Data center construction timelines that once spanned 18–24 months are now stretching to 36–48 months or longer, with transformer delivery times reaching 18–36 months for custom units. Spot market prices for large power transformers have increased 300–400% since 2023. Many developers are now scouring secondary markets for used equipment, with mixed results in reliability and warranty coverage.
Core Requirements
| Вимоги | Critical Details |
| Supply chain resilience | Guaranteed delivery windows with binding commitments |
| Expedited delivery | Dedicated production slots for data center projects |
| Transformer integration | Complete solution including medium-voltage transformers |
| Turnkey deployment | Pre-commissioned systems ready for rapid installation |
| Масштабованість | Modular design enabling staged capacity expansion |
Strategic Solutions
Fast-Track Delivery Programs
Leading C&I storage providers now offer priority production allocation for data center customers. For projects requiring deployment within 12–18 months, partners should provide:
- Dedicated manufacturing lines for data center BESS orders
- Pre-stocked critical components (inverters, battery modules, thermal management units)
- Expedited logistics partnerships for air/sea freight optimization
- Parallel testing and certification to reduce site commissioning time by up to 40%
Complete Power Infrastructure Integration
The transformer bottleneck cannot be solved piecemeal. A comprehensive solution includes:
- Integrated medium-voltage step-up transformers (500 kVA to 5 MVA range)
- Pre-engineered switchgear with ANSI/IEEE compliance
- Turnkey interconnection support with local utility coordination
- Single-source warranty coverage for all power components
Real-World Delivery Benchmarks
For customers exploring their storage options, comprehensive hybrid solar systems are available for commercial-scale deployment needs. Explore our Комерційна гібридна сонячна система потужністю 500 кВт designed for efficient C&I applications.
3. Pain Point #2: EPC and Project Developers—FEOC Compliance, ITC Maximization, and Equipment Availability
The Challenge
For Engineering, Procurement, and Construction (EPC) firms and Independent Power Producers (IPPs), 2026 presents a compliance gauntlet that directly impacts project economics. Under the One, Big, Beautiful Bill Act (OBBBA), energy storage projects commencing construction in 2026 must satisfy Foreign Entity of Concern (FEOC) restrictions to qualify for Investment Tax Credit (ITC) benefits. The Material Assistance Cost Ratio (MACR) threshold for energy storage is 55% in 2026, meaning over 55% of project material costs must derive from non-FEOC sources. This threshold increases to 60% for energy storage in 2027.
MACR Calculation Framework
Under IRS Notice 2026-15, issued in February 2026, the MACR calculation methodology applies to clean energy tax credits under Sections 45Y, 48E, and 45X. Developers must either:
1. Use the prescribed safe harbors established in the Notice, or
2. Calculate the MACR directly based on detailed supply chain documentation
Table 3: FEOC MACR Thresholds by Project Type (2026–2028)
| Project Type | 2026 Threshold | 2027 Threshold | 2028 Threshold |
| Energy Storage | 55% | 60% | 60% |
| Wind | 40% | / | / |
| Solar | 40% | / | / |
*Source: IRS Notice 2026-15; Microgrid Knowledge*
ITC Stacking Potential (2026)
A fully compliant project can achieve significant tax credit stacking:
- Base ITC: 30%
- Domestic content adder: +10% (subject to WTO ruling, see below)
- Energy community bonus: +10% (for qualifying locations)
- Low-income community adder: +10–20% (qualifying projects)
- Maximum potential: up to 70% effective tax credit
However, the WTO ruled in February 2026 that the U.S. domestic content bonus violates international trade rules, recommending removal by October 1, 2026. This policy uncertainty requires developers to model multiple ITC scenarios and maintain supply chain flexibility.
Compliance Documentation Requirements
To achieve FEOC compliance, project developers must secure:
1. FEOC attestations from all tier 1 (cell/pack) and tier 2 (module/system) suppliers
2. Bill of materials with country-of-origin tracking for all components
3. Value-added documentation demonstrating MACR threshold satisfaction
4. Audit trail enabling IRS verification of PFE (Prohibited Foreign Entity) status
5. DOMESTIC CONTENT certification for bonus qualification (while available)
Equipment Delivery Assurance
With transformer lead times exceeding 18–36 months and battery delivery windows slipping as demand surges, EPCs need binding delivery commitments. Leading storage integrators maintain:
- Dual-sourcing agreements with UL-listed transformer manufacturers
- 12–16 week standard lead times for outdoor cabinet systems (125kW–500kW)
- 20–24 week lead times for containerized systems (1MWh–10MWh+)
- Pre-order inventory programs for strategic project pipelines
Risk Mitigation Strategy
For EPCs and developers, the optimal approach combines:
- Early FEOC compliance verification (minimum 6–9 months before NTP)
- Parallel procurement of long-lead transformers (12+ months pre-NTP)
- Phased construction using pre-commissioned BESS modules
- Contingency pricing for potential domestic content adder loss
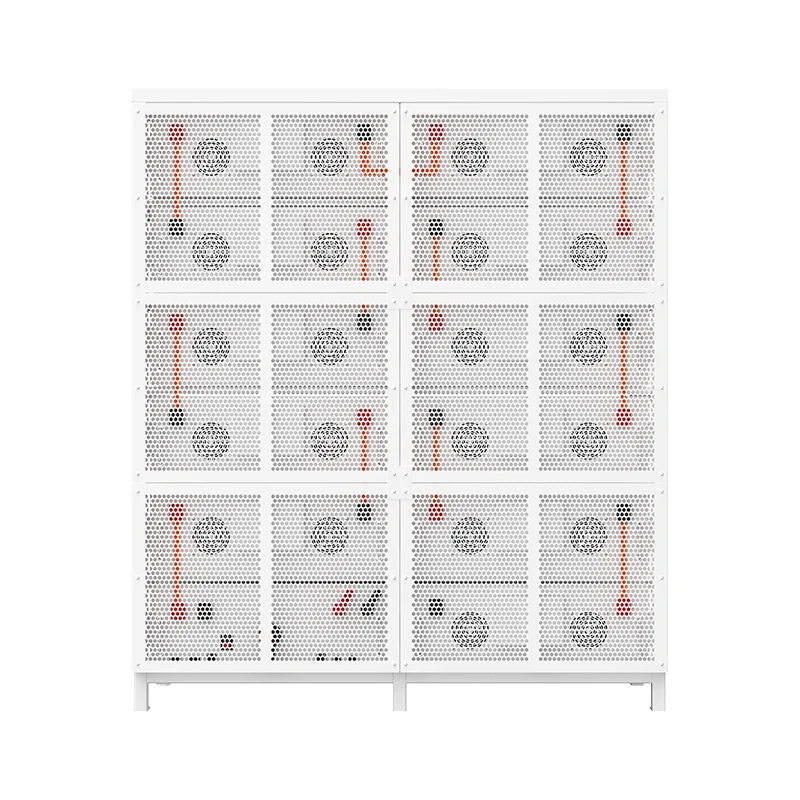
For outdoor cabinet deployments requiring rapid installation and FEOC-compliant supply chains, the 100kW/232kWh 125kW/261kWh Liquid-Cooled Outdoor Cabinet Energy Storage System offers a pre-certified, quick-deployment solution.
4. Pain Point #3: Industrial and Retail Customers—PJM Capacity Markets and NEM 3.0 Profitability
The Challenge
For industrial facilities, manufacturing plants, cold storage operators, and retail chains, the economic case for storage in 2026 is defined by two powerful but conflicting forces:
1. Record-high PJM capacity prices creating unprecedented revenue opportunities
2. California NEM 3.0 slashing solar export credits by approximately 75%, making solar-only systems financially untenable
PJM Capacity Market: A Historic Opportunity
In July 2025, the PJM 2026/2027 delivery year capacity auction cleared at **329.17/MW−day∗∗,representingan83328.92/MW-day. If no price collar mechanisms were in place, market observers estimate clearing prices could have reached $389/MW-day for 2026/2027.
Table 4: PJM Capacity Auction Clearing Prices (2023–2027 Delivery Years)
| Delivery Year | Clearing Price ($/MW-day) | Year-over-Year Change | Ключові драйвери |
| 2023/2024 | ~28.92 | / | Базовий рівень |
| 2024/2025 | ~269.92 | +833% | Data center load emergence |
| 2025/2026 | ~269.92 | 0% | Price collar implementation |
| 2026/2027 | 329.17 | +22% | Accelerating AIDC demand |
| 2027/2028 | TBD | / | PJM price collar extended (175–325 floor/cap) |
Source: PJM RPM auction results; RTO Insider
In the PJM market, battery energy storage systems can stack multiple revenue streams. In March 2026, a 1 MW battery system with a 4-hour storage duration could generate revenue of $51/kW-month by combining earnings from the frequency regulation market ($35/kW-month), real-time energy arbitrage ($11/kW-month), and capacity market payments ($5/kW-month). For a 5 MW system, this translates to a potential total monthly revenue of approximately $255,000 when market conditions are at their peak.
NEM 3.0: Solar-Only Is No Longer Viable
Under California’s NEM 3.0 (Net Billing Tariff), which took effect in April 2023, solar export compensation dropped from retail rates of approximately 0.30–0.35/kWh to avoided cost rates of 0.05–0.08/kWh—a reduction of approximately 75–80%. In 2026, under NEM 3.0, the priority has fundamentally shifted from exporting solar to maximizing self-consumption. Self-consumed solar avoids retail purchase rates of approximately $0.40/kWh (depending on utility and rate schedule), representing a 4-5x value multiple over exported solar.
Table 5: NEM 3.0 Economic Comparison—Solar-Only vs. Solar+Storage (California Commercial Ratepayer)
| Сценарій | Annual Solar Generation (kWh) | Self-Consumption Rate | Exported kWh | Export Revenue ($0.07/kWh avg) | Avoided Purchase Value ($0.40/kWh) | Net Annual Value |
| Solar-only (standard orientation) | 200,000 | 25% | 150,000 | $10,500 | $20,000 | $30,500 |
| Solar+Storage (optimized dispatch) | 200,000 | 80% | 40,000 | $2,800 | $64,000 | $66,800 |
| Difference | / | +55% | -110,000 | -$7,700 | +$44,000 | +$36,300 |
The bottom line in 2026 California: a solar-only system is a financial liability. Every installation must include robust battery storage to achieve real ROI.
Revenue Stacking Strategies
For PJM Customers:
- Participate in capacity market through approved aggregators
- Stack regulation service (RegA/RegD) during low-demand periods
- Capture energy arbitrage in day-ahead and real-time markets
- Use VPP participation for demand response events
For California (CAISO) Customers:
- Focus on peak shaving during 4–9 PM net peak period
- Participate in CAISO wholesale markets via scheduling coordinator
- Consider VPP aggregation for grid services revenue
- Utilize PCIA/NWA avoidance strategies for load-serving entities
Virtual Power Plant (VPP) Participation
Beyond ISO market participation, VPP capabilities provide critical revenue diversification. In Texas, SOLRITE and sonnen have launched battery-only VPP services expected to sign up 10,000 customers by end of 2026, providing 600 MWh of dispatchable energy to the ERCOT system. VPP participation typically generates $20–50/kW-year in incremental revenue while providing grid resilience benefits.
5. Pain Point #4: Outdoor Cabinet Applications—UL 9540A Compliance and Extreme Environmental Protection
The Challenge
For outdoor cabinet deployments serving hotels, medical facilities, retail centers, and mid-size commercial sites, safety certification and physical protection have become non-negotiable requirements. The March 13, 2026 release of UL 9540A Sixth Edition marks a watershed moment for energy storage safety standards.
UL 9540A:2026 Sixth Edition—What Changed
The new standard makes Large-Scale Fire Testing (LSFT) mandatory for installation-level certification. This represents a fundamental departure from previous editions, which allowed certification based solely on cell- and module-level testing.
Key requirements of UL 9540A:2026:
- Installation-level large-scale fire testing evaluating fire propagation between adjacent BESS units or nearby structures
- Active fire suppression and detection systems SHUT OFF during testing—worst-case scenario assessment
- Adjacent units placed to evaluate inter-unit flame spread
- Full-charge state testing for maximum thermal runaway energy
- Documented propagation control—any propagation to adjacent units constitutes test failure
The LSFT protocol involves igniting one energy storage unit while all fire suppression and detection systems are disabled, placing nearby units to assess propagation risk, and observing outcomes. Testing costs have increased significantly, and certification timelines have extended from 3–6 months to 6–12 months for full LSFT validation.
Table 6: Pre-2026 vs. UL 9540A:2026 Requirements Comparison
| Вимоги | Pre-2026 (Fifth Edition) | UL 9540A:2026 (Sixth Edition) |
| Cell-level thermal runaway test | Required | Required |
| Module-level propagation test | Required | Required |
| Unit-level fire test | Optional / By request | Mandatory (LSFT) |
| Installation-level inter-unit test | Не обов'язково | Mandatory |
| Adjacent structure evaluation | Не обов'язково | Mandatory |
| Fire suppression disabled testing | Not typical | Mandatory for LSFT |
| Typical certification timeline | 3–6 months | 6–12 months |
Environmental Protection Standards
Outdoor cabinets must withstand diverse and extreme U.S. climate conditions:
| Protection Requirement | Мінімальний стандарт | Critical For |
| Захист від проникнення | IP54 or higher | Dust intrusion, water jets |
| Corrosion resistance | C5-M (marine) / UL 1741 | Coastal CA, FL, TX, Gulf region |
| Salt fog testing | ASTM B117 500+ hours | Maritime/coastal installations |
| Seismic certification | IBC 2024/ASCE 7-22 | California, Pacific Northwest, Alaska |
| Flood resistance | NEMA 4X (submersible-capable) | Hurricane-prone regions, flood zones |
| Робоча температура | -30°C to +55°C | All geographic regions |
| Acoustic emissions | <65 dBA at 3m | Urban installations, noise-sensitive sites |
Compact Design and Site Constraints
Commercial sites typically have limited available space for energy storage. Outdoor cabinets should support:
- Wall-mountable or pad-mounted configurations
- Side-by-side or corner installation options
- Zero-clearance or reduced setback requirements per NFPA 855
- Tiered/seismic-rated anchoring systems
- Integrated thermal management (liquid cooling preferred for density)
У "The 100kW/232kWh 125kW/261kWh Liquid-Cooled Outdoor Cabinet Energy Storage System is engineered specifically for site-constrained commercial applications with IP55 rating and UL 9540A Sixth Edition certification.
6. Pain Point #5: Critical Infrastructure Backup—Grid-Forming Technology and Long-Duration Reserve
The Challenge
For data centers, large-scale manufacturing, pharmaceutical production, and other critical infrastructure, backup power requirements have evolved beyond simple ride-through capability. With aging U.S. grid infrastructure and reserve margins falling below 15% in many regions, facilities need grid-forming capability that can not only respond to grid disturbances but actively support grid stability.
Millisecond Islanding Transition
Legacy UPS systems typically require 20–50ms to detect loss of utility power and transition to backup. For AI data centers running high-density GPU clusters, even sub-cycle interruptions can trigger compute errors, application crashes, and session timeouts—with potential revenue losses exceeding $1 million per minute for hyperscale operators.
Industry requirement: <10ms seamless islanding transition from grid-connected to off-grid/island mode, with no detectable load impact.
Advanced BESS systems now achieve sub-10ms transition through:
- Ultra-fast solid-state switching (IGBT/SiC-based)
- Continuous grid synchronization with phase-locked loops
- Pre-charged DC link capacitors
- Coordinated control with existing UPS systems
Grid-Forming (GFM) Technology
Grid-forming inverters represent the most significant technical evolution in energy storage since lithium-ion commercialization. Unlike conventional grid-following inverters that passively track grid voltage and frequency, grid-forming inverters actively establish the voltage and frequency reference, behaving like synchronous generators.
Key GFM capabilities required for critical infrastructure:
- Можливість чорного старту—energize dead grid sections or facility microgrids from battery alone
- Virtual synchronous machine (VSM) behavior—provide inertia emulation for frequency stability
- Voltage source operation—stabilize weak grids or high-renewable penetration networks
- Seamless microgrid formation—transition to and from island mode without disruption
- Synthetic inertia response—sub-second frequency response comparable to rotating mass
Sungrow completed the world's first large-scale grid-forming full-scenario validation in April 2026, covering 14 operational scenarios with TÜV Rheinland independent verification. For data center applications, SST (Solid-State Transformer) solutions integrated with GFM technology can significantly reduce footprint while improving efficiency and grid disturbance mitigation.
Table 7: Grid-Following vs. Grid-Forming BESS for Critical Infrastructure
| Спроможність | Grid-Following BESS | Grid-Forming BESS |
| Grid islanding capability | Requires GFM external device | Native/Integrated |
| Можливість чорного старту | Not typical | Так. |
| Inertia emulation | Ні. | Yes (10–40 ms response) |
| Слабка робота мережі | Poor (voltage instability) | Чудово. |
| 100% renewable microgrid | Ні. | Так. |
| Parallel synchronous generator operation | Complex | Native |
| Fault current contribution | Обмежений | Significant (3–5x rated) |
Long-Duration Backup Requirements
Data center storage duration requirements are evolving: from common 2–4 hour configurations to 4–8 hours or longer for critical AI workloads. Module expandability must support:
- Power scaling: 500 kW to 5 MW+ per deployment
- Energy scaling: 4–12 hours at rated power
- Parallel container configuration for multi-MW requirements
- N+1 redundancy for mission-critical availability
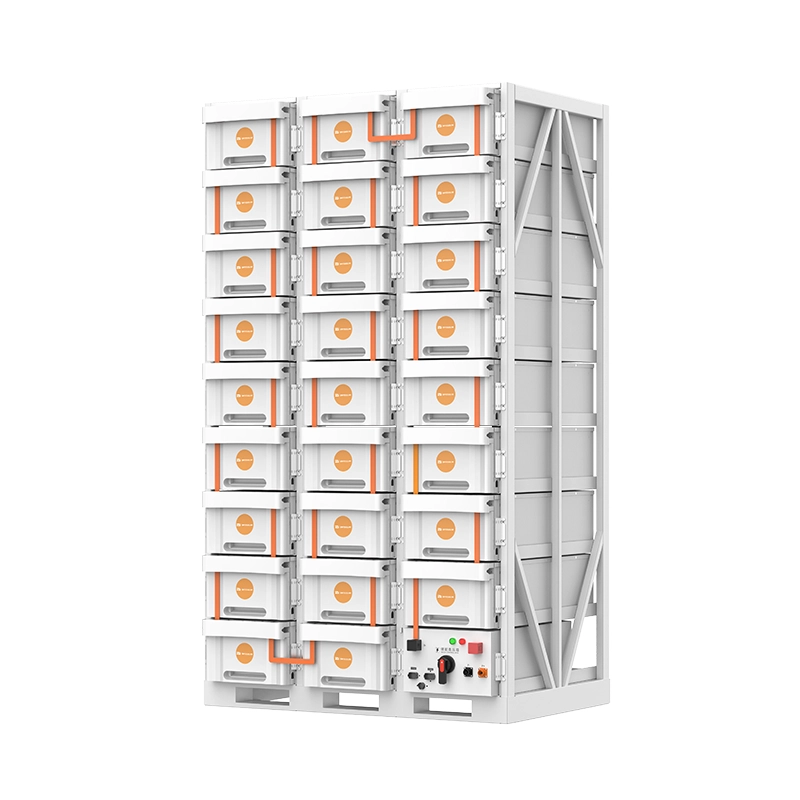
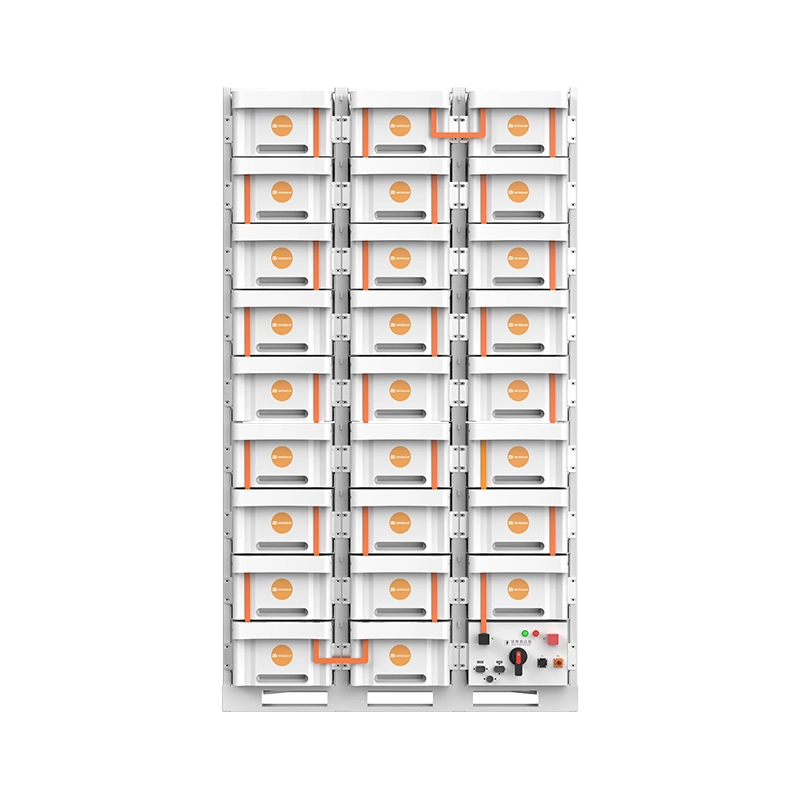
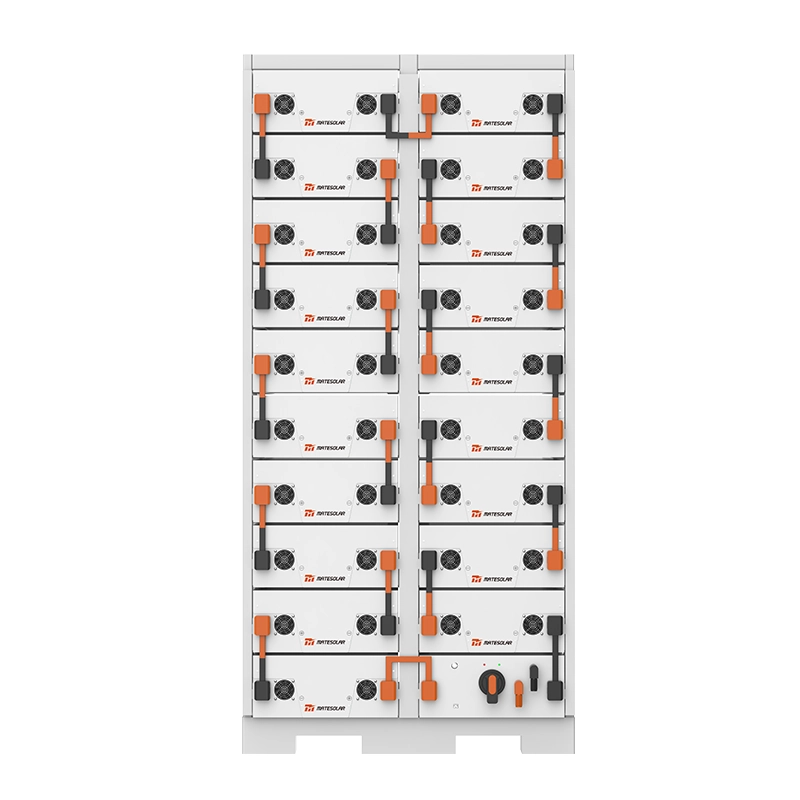
For hyperscale backup deployments requiring modular expandability and grid-forming capability, the 40Ft 1MWh 2MWh Air-Cooled Container ESS Energy Storage System і 20-футовий контейнерний накопичувач енергії з рідким охолодженням 3 МВт/год 5 МВт/год offer flexible power and energy configurations with GFM-ready architecture.
7. Pain Point #6: Project Financiers and ISO Participants—Revenue Stacking and Bankability
The Challenge
For EPCs, IPPs, and financing institutions, project bankability depends on predictable, long-term cash flows. U.S. ISOs vary significantly in market design, ancillary service types, and interconnection protocols. A one-size-fits-all EMS/control platform cannot optimize across PJM, CAISO, ERCOT, MISO, NYISO, and ISO-NE.
ISO Revenue Stacking Capabilities
PJM (Pennsylvania–New Jersey–Maryland Interconnection):
- Capacity market (RPM)—currently $329.17/MW-day for 2026/2027 delivery year
- Regulation market (RegA/RegD)—fast frequency response
- Synchronized/Non-synchronized reserves
- Day-ahead and real-time energy arbitrage
- Black start service payments
CAISO (California Independent System Operator):
- Energy imbalance market (EIM) participation
- Regulation up/down (fast frequency response)
- Spinning/non-spinning reserves
- Real-time energy arbitrage (duck curve economics)
- Resource adequacy capacity payments
ERCOT (Texas):
- Energy-only market—no capacity market
- Ancillary services (responsive reserve, non-spin, regulation up/down)
- Real-time energy arbitrage (high volatility)
- Controllable load resource participation
Table 8: ISO Ancillary Service Revenue Potential Comparison (2026 Data)
| ISO | Regulation Service ($/MW-hr) | Reserve Service ($/MW-hr) | Energy Arbitrage Spread ($/MWh avg) | Capacity Payment ($/MW-day) |
| PJM | $15–25 (RegD) | $5–12 | $10–25 | $329 |
| CAISO | $8–35 | $3–10 | $15–35 | ~$8 (resource adequacy) |
| ERCOT | $10–60 (event-driven) | $2–15 | $20–80 (spike-driven) | None (energy-only) |
| MISO | $5–15 | $2–8 | $8–20 | ~$10–20 |
| NYISO | $10–30 | $4–12 | $12–30 | $15–40 |
*Note: Revenue varies significantly by hour, day, and system conditions. The table represents typical mid-2026 ranges.*
Smart EMS Requirements
A bankable BESS requires an Energy Management System (EMS) with:
- ISO-native optimization algorithms for each target market
- Multi-service revenue stacking engine (capacity + regulation + energy + reserves)
- Real-time price forecasting (day-ahead and real-time)
- Battery degradation-aware dispatch balancing revenue and asset life
- API integration with ISO scheduling platforms
- SCADA compatibility with utility and grid operator protocols (DNP3, IEC 61850,
Modbus TCP, OPC-UA)
Standardized Interconnection and Dispatch
Project finance depends on successful ISO interconnection and dispatcher acceptance:
| ISO | Key Interconnection Requirements | Communication Protocols | Testing Requirements |
| PJM | PJM Manual 14B: BES Facilities | ICCP, DNP3 | Full complement of NERC PRC standards |
| CAISO | CAISO Tariff Appendix Q | DNP3, ICCP, Modbus over TCP | R0, R1, R2, black start capability |
| ERCOT | ERCOT Nodal Protocols §3.14 | ICCP, DNP3, Modbus | ERCOT registration and model validation |
| MISO | MISO Business Practice Manual BPM-015 | ICCP, DNP3 | MISO generator interconnection studies |
| NYISO | NYISO Manual 21 | ICCP, DNP3 | NYISO AUC Article VII or X |
Bankability Documentation
For financing institutions, project bankability requires:
- System-level certifications: UL 9540 (complete system), UL 9540A Sixth Edition (LSFT), UL 1973 (batteries), IEEE 1547 (interconnection)
- Performance guarantees: Round-trip efficiency (RTE) ≥87% (liquid-cooled), ≥85% (air-cooled); capacity retention (≥80% at year 10); calendar life ≥10,000 cycles or 12 years
- Warranty coverage: 10-year product warranty; 12-year performance warranty (optional extension)
- ISO-specific attestation: Registered unit testing verification; PJM Regulation Capability Testing (RCT) completed
For large-scale container deployments requiring full ISO certification and complete bankability packages, the 20-футовий контейнерний накопичувач енергії з рідким охолодженням 3 МВт/год 5 МВт/год provides UL 9540 certification, performance guarantees, and comprehensive warranty coverage.
8. Frequently Asked Questions
Q1: What are current lead times for BESS equipment in the U.S. as of May 2026?
A: Lead times vary significantly by system type and component availability:
- Outdoor cabinets (100–500kW): 12–16 weeks for standard configurations; 20–24 weeks for custom designs
- Containerized systems (1–10MWh): 20–30 weeks for standard configurations; 30–40 weeks for liquid-cooled with integrated medium-voltage transformers
- Transformers alone: 18–36 months for custom medium-voltage units; 12–18 months for standard off-the-shelf sizes
- Battery cells/packs: 8–16 weeks for LFP (subject to origin status)
Mitigation strategy: Order long-lead transformers 12+ months before NTP; secure priority production slots through strategic partnerships; consider pre-stocked quick-deployment systems. Nearly half of 2026 planned data center projects face delay or cancellation due to equipment shortages, making early procurement essential.
Q2: How does FEOC compliance affect my ITC eligibility in 2026?
A: For energy storage projects commencing construction in 2026, the Material Assistance Cost Ratio (MACR) threshold is 55% —meaning at least 55% of total project materials cost must come from non-FEOC sources. This threshold increases to 60% in 2027. FEOC determination uses a "look-through rule" examining component manufacturers three tiers deep (raw materials → components → subassemblies → final product). Suppliers must provide attestations for each tier. Failure to meet MACR thresholds results in complete loss of ITC eligibility for that project. IRS Notice 2026-15 (February 2026) provides safe harbors and calculation methodologies.
Q3: What is the ITC domestic content bonus status after the WTO ruling?
A: The WTO ruled in February 2026 that the U.S. domestic content bonus (additional +10% ITC) violates international trade rules and recommended removal by October 1, 2026. As of May 2026, the bonus remains technically available but carries risk policy uncertainty. Developers should model two scenarios: (1) full 30% base ITC + 10% domestic content + 10% energy community = 50% (or up to 70% with low-income adders) and (2) base 30% ITC + energy community = 40% (low-income adders unaffected). The ruling may be appealed or negotiated, but prudent project finance assumes the domestic content adder is temporary at best.
Q4: Has my BESS passed UL 9540A Sixth Edition large-scale fire testing (LSFT)?
A: UL 9540A Sixth Edition, released March 13, 2026, makes LSFT mandatory for installation-level certification. Under LSFT protocol, all fire suppression and detection systems are disabled on the test unit, it is ignited at full state of charge, and adjacent units are placed to evaluate propagation risk. If any propagation reaches adjacent units, the system fails. Certification requirements include documented LSFT results from a Nationally Recognized Testing Laboratory (NRTL) such as UL. Systems certified only under previous editions (Fifth Edition or earlier) must undergo recertification to meet new requirements for projects requiring permits after 2026 Q3 in most AHJs. Always request the specific LSFT data sheet and look for explicit "UL 9540A:2026 compliance" language.
Q5: How can I participate in PJM's capacity market with my BESS?
PJM's Reliability Pricing Model (RPM) capacity market for 2026/2027 cleared at 329.17/MW-day.
To participate:
(1) Your BESS must qualify as a Capacity Resource through the PJM Interconnection process;
(2) You need an approved Capacity Market Seller status through PJM eMarket;
(3) Your system must have a 4-hour duration rating (minimum for capacity market qualification in PJM under current rules);
(4) Register as a generation asset (even for storage) and complete PJM modeling.
Aggregate through a PJM-approved Capacity Market Seller or work with a third-party energy asset optimizer.
Storage revenues in PJM can stack capacity payments with regulation (RegD) and energy arbitrage — March 2026 data showed multi-stack earnings of 51/kW-month.
Q6: What return on investment (ROI) can I expect under NEM 3.0 in California?
A: Under NEM 3.0, solar-only systems are financially untenable. Solar+storage with optimized self-consumption typically achieves 4–7 year payback depending on: load profile (evening-dominant loads perform best), utility rate schedule (SDG&E and PG&E have highest avoided rates), system sizing (oversize solar relative to daytime load; size battery to cover 4–9 PM peak), participation in CAISO wholesale markets or VPP programs, and ITC qualification (30–50%). Export compensation dropped from 0.35/kWh to 0.07/kWh (avoided cost)—a 75–80% reduction, but self-consumed solar avoids retail rates of ~$0.40/kWh, creating a 4-5x value uplift.
Q7: What is grid-forming technology, and do I need it?
A: Grid-forming (GFM) inverters actively establish voltage and frequency reference rather than tracking the grid (grid-following). GFM is essential for mission-critical facilities requiring black start and seamless islanding, sites in weak grid areas (rural/remote), microgrids with >50% renewable penetration, and data centers with continuous load sensitivity (sub-10ms transition requirement). GFM enabled Sungrow's world-first full-scenario validation in April 2026 covering 14 operational scenarios with TÜV Rhineland verification. GFM may be overkill for simple peak shaving at sites with strong grid connections, or basic backup with transfer switches. Evaluate your risk tolerance for grid disturbances.
Q8: What certifications do financiers require for project bankability?
A: Minimum bankability package includes: UL 9540 (complete system), UL 9540A Sixth Edition with LSFT data, UL 1973 (batteries), IEEE 1547/IEEE 1547.1 (interconnection), NFPA 855 compliance plan, ISO-specific attestations (PJM Regulation Capability Testing, CAISO NQC testing), performance guarantees (RTE, capacity retention, cycle life), full warranty documentation, supply chain traceability to support FEOC compliance for ITC qualification, and third-party engineering review (DNV/Black & Veatch level).
Q9: Can my BESS serve multiple applications simultaneously?
Yes — revenue stacking is the standard approach in 2026. A properly configured BESS with intelligent EMS can simultaneously: participate in ISO capacity market (e.g., 329/MW−dayinPJM), provide regulation service (e.g.,15–25/MW-hr in PJM RegD), capture energy arbitrage (charge at low prices, discharge at high prices), offer demand charge reduction for the host facility, provide backup power (ride-through for grid outages), and participate in VPP demand response events. Real-time optimization algorithms balance revenue capture against battery degradation costs. This multi-service approach is the only way to achieve optimal project returns.
Q10: How does your warranty and technical support work for U.S. customers?
A: For hardware quality issues, we provide replacement parts for guided installation/swap or direct product replacement (new unit) per warranty terms. Our regional team can assist with RMA processing. For software/firmware, we provide remote technical support for diagnostics, configuration, and upgrades. For large-scale projects (≥1MW), we offer on-site commissioning and technical support through verified local partners coordinated by our project management team.
9. Conclusion: Partnering for Success in the New Energy Storage Era
The 2026 U.S. energy storage market presents both unprecedented opportunity and significant execution risk. AI data centers are driving structural demand growth, with grid deficits expanding from 39.9 GW this year to 67.8 GW by 2028. The record 24 GW of utility-scale storage expected in 2026 reflects this urgency, but demand alone does not guarantee project success.
Success requires navigating supply constraints (transformer lead times of 18–36 months; battery deliveries slipping as demand surges), regulatory complexity (FEOC MACR threshold at 55% for 2026, increasing to 60% in 2027; WTO ruling on domestic content creating policy uncertainty), safety compliance (UL 9540A Sixth Edition LSFT mandatory; certification timelines now 6–12 months), ISO market optimization (PJM at $329/MW-day capacity prices; CAISO duck curve economics; different revenue stacking strategies across markets), and project finance requirements (bankability packages with full certification and performance guarantees).
Across each of the six critical pain points examined in this guide—from AI data center deployment timelines to FEOC compliance documentation, from PJM capacity market participation to NEM 3.0 solar+storage economics, from UL 9540A Sixth Edition fire safety certification to grid-forming technology integration, from ISO revenue optimization to complete bankability documentation—the key success factor is selecting a partner with proven expertise, manufacturing capacity, supply chain resilience, and regulatory knowledge.
MateSolar stands as a comprehensive PV + energy storage solution provider, delivering engineered systems for the most demanding C&I applications. With UL 9540A:2026-certified outdoor cabinets, grid-forming containerized systems for critical infrastructure, and full FEOC-compliant supply chains for ITC optimization, MateSolar provides the technical foundation and operational certainty that project developers, facility owners, and financial institutions require in today's complex market environment.
Whether your application is a hyperscale data center requiring sub-10ms islanding with GFM technology, a manufacturing facility in PJM seeking to capture $329/MW-day capacity revenues, a California retail site adapting to NEM 3.0 economics, or a project finance portfolio requiring full bankability documentation—MateSolar delivers. Our pre-engineered systems shorten deployment timelines, our dual-sourced supply chain mitigates component shortages, and our comprehensive warranty and support infrastructure ensures long-term operational performance.
The window of opportunity in the 2026 U.S. C&I storage market is clear. The challenges are significant but navigable. With the right partner, the right systems, and the right strategic approach, your project can achieve the performance, economics, and reliability that this transformative market demands.
MateSolar — Your Turnkey PV + Energy Storage Partner for the American C&I Market
This Guide was prepared with market data and regulatory information current as of May 6, 2026 (Beijing time). Market conditions, regulatory policies, and ISO market rules may evolve rapidly. Readers are advised to confirm all compliance and incentive information with qualified tax and legal advisors prior to project execution.